Posts Tagged ‘Cork’

2017 Expt Wins

January 22, 2018

So in what is now becoming an annual exercise let’s review the 2017 season through the prism of Expected Wins (Expt Wins).The 2015 and 2016 versions of this article can be found here and here

For the uninitiated Expt Wins uses bookmaker’s odds (note 1), as a sort of independent arbiter, to see which teams over (or under!) performed versus what was expected on a game by game basis. It is a much better fairer view than sheer win percentages given (a) how relatively short the season is for most teams and (b) how uneven the Championship can be in terms of the quality of teams facing off against each other.

Table 1; 2017’s best and brightest

Unsurprisingly the top10 is peppered with teams that were promoted. This makes sense as for the majority of teams the league makes up at least two thirds of their season.

Carlow had an excellent season – but it was no fluke; they were also top5 in 2016. Over the past two seasons they have won 11 games when they were only expected to win ~7.7. And they managed to top the 2017 table despite losing as 1/16 home favourites against London. 1/16, without accounting for the bookmaker’s margin (see note1), implies a 94% win probability. Win that game and their “above Expt Wins” total would be twice that of second placed Louth. That loss is the shortest price loss in the database and must be one they desperately want back. There is no guarantee that Carlow would have gained promotion had they beaten London – as Wexford no doubt would have put greater emphasis on their final two games – but they must be absolutely kicking themselves every time they think of that game. And yet – they still topped the 2017 table despite this loss.

Now I am by no means an expert on the ins and outs of Louth football – and you have to think they have a good ‘un in Pete McGrath – but you have to feel for Colin Kelly. Back to back promotions. A 59% win rate over that period which lands them 5th on that metric behind the likes of Dublin, Tyrone, Kerry and Kildare (themselves aided by back to back promotions) and along with Carlow the only team to finish in the top5 Expt wins both years.

The two Championship campaigns were poor in comparison (played 6 won 3 with three loses of 4, 6 and 9 when stepping up against Derry and Meath) but still … be careful what you wish for.

In 2016 Tyrone and Cavan were in the top10 following successful promotions from Division2 and the trend holds true for Galway and Kildare. Division2 is always very tight – just under half (27 of 56) of all games in the last two years had a zero or one point handicap. Extend that to two points and 80% of the games are covered. Win enough games to gain promotion in these tight contests and you are well on your way to outperforming expectations for the season.

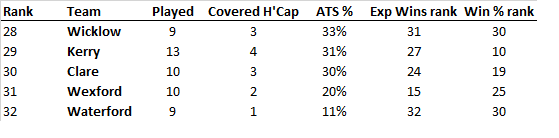
Table 2; 2017’s laggards

This is a mixed bunch of
1. Division4 teams who struggled to register wins and who are perennially down the bottom of these rankings – Limerick, Waterford, Wicklow
2. Teams that had a disastrous season – Cavan, Laois, Derry
3. Very good teams that didn’t get the job done enough – Kerry & Mayo
4. Cork!

Taking the four cohorts in order

1. The worst team in 2017 was (subjectively) Wicklow but no matter how bad you are when you play your peers in the league you are always given “some” chance. Wicklow’s seven league appearances saw them chalked up at odds of 8/11, 3/1, 5/6, 10/3, 11/2, 6/5 and 6/1. When we remove the bookmaker’s margin that equates to an expectation of two wins. And that’s for the “worst team”. Limerick’s odds were 8/13, 11/10, 13/8, 1/10, 8/15, 11/8 and 1/10 which comes out at just over four wins.

No matter how poorly you are viewed under Expt Wins you will always be expected to notch up at least two wins and maybe four or five … if you struggle to win games full stop you will always be down the bottom end of this table.

2. All three of Cavan, Laois and Derry were relegated and whilst combined they won 4 of 10 Championship games three of those victories came against Division4 teams when they were heavily favoured. At a very high level this cohort win the games they are expected to win, lost the ones they were expected to lose and came out the wrong side of way too many 50:50 calls

3. Mayo being so low on the table is easy enough to explain; in the three games that they drew Mayo were 1/5, 1/6 and 23/10 – those three games alone account for their negative Expt Wins. Kerry are slightly different. They may have finally managed to beat Dublin in the Division1 final but outside of that they failed to win half their games – with three of those games coming against Mayo when a good favourite (2/5, 1/2 and 8/13). They were almost prohibitively favoured at 1/20, 1/5 & 1/6 in the three Championship games that they won. That mixture (winning when big favourite, losing/drawing when favouritism is less obvious) is a recipe for a poor Expt Wins season

4. Cork. Ah Cork. For the second year in a row they appear in the bottom5 but can you imagine how poor they would look had Waterford managed to tack on one more point when Cork were 1/50? Cork were middle of the pack on win ratio (winning 41% of their games) but were overturned by Tipperary as a 7 point favourite in the 2016 Championship whilst also losing at odds of 1/3, 4/11 and 4/11 over the two league campaigns. They never won a game as underdog to balance these losses.

Is it predictive?
Although there are outliers – notably Carlow, Louth and Cork – I would lean towards no. There is just too much volatility as teams yo-yo up and down the table; Kerry from 27th in 2015 to equal 6th in 2016 and then back down to 28th in 2017; Cavan from 9th to 31st, Armagh from 32nd to 5th. Good luck trying to pick which of this year’s top5 will stay there!

Note1; calculating Expt Wins

Using the All Ireland final as an example. Paddy Power’s odds for the game were Dublin 4/9, Mayo 3/1 with the draw being 9/1. All that these fractional odds are is another way of expressing probabilities. To work out the probability any odds equate to you use the following formula (B/ (A+B)). For Dublin’s 4/9 the B here = 9 and the A = 4 so the probability of a Dublin win = (9/ (4+9)) which equals 0.692 or 69.2%. Do this for all three odds and you get

Dublin = (9/ (4+9)) = 69.2%
Mayo = (1/ (1+3)) = 25.0%
Draw = (1/ (1+9)) = 10.0%

The total percentages add up to 104.2%. Now we know that there are only the three outcomes for any game – team1 wins, team2 wins and draw – so anything above 100% for these three outcomes is the bookmaker’s margin. To get a truer understanding of the probabilities we strip out the margin equally across the three outcomes and come up with an Expt Win for each team. Dublin in this instance = 67.8% or 0.678 (69.2%-((104.2%-100%)/3)); Mayo = 23.6% or 0.236 (25.0%-((104.2%-100%)/3))

Note2; the odds
All odds are taken from Paddy Power and tend to be taken towards the back end of the week (Friday night/Saturday morning) to let any movements settle down. It is possible that injury news etc. changes the odds between what was taken and what they were at throw in but I’m comfortable enough that this would be a rare enough occurrence not to have too big an impact.

Kerry v Cork Munster

July 4, 2017

For those new to the blog, or who haven’t been here for a while, please find a refresher on the definitions and how the numbers are compiled here

Team Possessions Attacks Shots Scores Exp Pts
Kerry 54 40 31 1 – 23 19.41
Cork 48 37 30 0 – 15 20.83

At a macro level both teams recorded very similar numbers in terms of Attack & Shot Rate. Kerry had 6 more possessions (in the main from shots recovered & the throw-ins) but only ended up with one more shot. It was Kerry’s clinical finishing that saw then coast to victory.

If you’re explaining you’re losing … but the fact that Cork have a higher Expt Pts tally despite an 11 point beating takes some explaining.

There are two elements to this; the first is the 11 point gap which relates directly to the conversion rate of both teams. We’ll touch on that later. The second is the composition of the shots that allowed Cork to accumulate more Expt Pts.

Both teams had 4 attempts at goal. Cork had a further 26 point attempts to Kerry’s 27 however within that 26 were 10 deadballs and 16 attempts from play. Kerry had 6 deadballs and 21 point attempts. Deadball attempts are converted at a much higher rate than point attempts thus the gap in Expt Pts between the deadballs (Cork’s 10 = 8.23, Kerry’s 6 = 4.51) is such that it overcomes the gap in Expt Pts for the point attempts (Cork’s 16 = 7.76, Kerry’s 21 = 10.06). And that’s how Cork ended up with more Expt Pts.

How Kerry ended up with an 11 point win however is purely down to the Conversion Rates

Kerry’s shooting
As stated Kerry had 4 shots at goal scoring 1- 00. Which is slightly below expected. Their deadballs were flawless scoring 0 – 06 from 6. What stands apart however was their point taking where they manufactured an obscene Conversion Rate of 81% (0 – 17 from 21; Expt Pts +6.94). It was their 14th point attempt – in the 41st minute – before they failed to convert one. They are simply magnificent returns. For some context the average Conversion Rate from 2012 – 2016 was 46%. Dublin, in their drubbing of Westmeath, converted 76% (0 – 22 from 29).

Much has been made of Paul Geaney & James O’Donoghue’s prowess together (I believe it was the Examiner’s John Fogarty (@JohnFogartyIrl) who highlighted the fact that they’ve scored 5 – 58 from play when paired together in 11 Championship games) but what struck me was the supporting cast.

Combined Geaney & O’Donoghue had a stat line of 78% (0 – 07 from 9) with an Expt Pts return of +2.79. Very good indeed. But the supporting cast produced a combined 83% (0 – 10 from 12) with an Expt Pts of +4.15. Seven different players had just the one point attempt with six converting (extra shooting practise for Darran O’Sullivan it would seem ….)

Cork’s defence aided Kerry in their endeavours in that 57% (12 of the 21) of the point attempts were taken under little or no pressure. Whilst this intuitively seems high it is a new metric and we need to be careful about reading too much into it. In the above Westmeath rout 66% of Dublin’s shots were taken under little or no pressure. By the end of the year 57% will probably be on the high side but not ridiculous.

Speaking of new metrics I have started to track shot assists throughout a game. It is still raw, and subjective, but essentially looks to track those placing the bullet in the chamber for others, in this instance Geaney & O’Donoghue, to pull the trigger.

Given how quickly the ball is let into the full forward line it is no surprise to see the front three feature heavily here. What is surprising perhaps are Paul Murphy’s returns. Not surprising in the sense that he’s not capable of such a performance but more so in that he didn’t appear to feature prominently when watching the game live. He very quietly, and very efficiently, pulled the strings.

Cork

What of Cork? First the positives – they did create the four goal chances. Yes they only returned 0 – 01 but they did open Kerry up. Their deadballs were – as has been the case with Cork – more or less on point (0 – 08 from 10; Expt Pts of -0.23. Essentially average). In a game where the majority of the commentary has referenced Kerry’s forward play Cork managed 30 shots.

What failed them was (a) the aforementioned inability to slow Kerry’s shooters. Yes Kerry were on fire but they needed to place them under more pressure. And (b) their own shooting. They had 16 points attempts from play but only scored 0 – 06 (38%; Expt Pts of -1.76). Not only was it anaemic when compared to Kerry but it was well below the average.

What might be more damning than the returns is who was shooting. Outside Donncha O’Connor, who came on at half time only Mark Collins got more than one shot off. Kerrigan, Connolly, Coakley, Deane, K O’Driscoll and Hurley all only managed one shot each.

Kickouts

Kerry came out on top of the kickouts that crossed the 45 winning 61% (20 to Cork’s 13). From a “must clean up” perspective they will be unhappy that they only manufactured three shots from 9 of their own kickouts that went past the 45. They also lost two short ones when Cork pushed up. Symptomatic of their day Cork didn’t score off either but those instances could be devastating hammer blows in any other game.

Appendix

Shot Charts

Kerry’s shooting

Cork’s shooting

x = missed, disc = score, yellow = deadball, black = 1st half from play, white = 2nd half, red = goal attempt

Expected Wins; how teams fared versus their odds

January 11, 2016

Once September rolls around only one or two teams will deem their year as being successful. In 2015 Dublin had a year of years winning the league, Leinster and the All Ireland (do we throw in the O’Byrne cup?). Monaghan winning Ulster made for a successful season whilst there is an honourable mention for Fermanagh with promotion to Division2 and the quarter final appearance. But what about the rest?

If the league is a means to an end for the majority, and the All Ireland and Provincial championships are regularly shared by the same teams, how do we measure the remainder’s performance? Or indeed how do we judge a team like Tyrone that got relegated, fell short in Ulster but rallied to get to the All Ireland semi-final? One way is to compare a team’s results against how bookmaker’s thought they should fare.

Bookmakers give odds on all games. The main markets are match odds and handicap. Any bookmaker worth their salt will tell you that though all odds can be converted into a percentage chance of winning this is not their primary aim when setting the line. They are not trying to exactly predict the likelihood of an outcome but rather set a line that will encourage multi way action on the game. This then enables them to have relatively evenly split betting on all outcomes and they can take the built in margin.

Still these lines are a very good proxy for how a team is expected to perform and the cumulative odds can thus be used to extract just how many games a team won above, or below, what was expected. Thus we create an Expected Wins (Exp Wins) metric.

Expected Wins

All odds for a game were converted to an Exp Win (see methodology in Note2 below) and then teams ranked according to how many wins they obtained in the League & Championship above this mark

Exp Win Top10

It comes as no surprise that seven of the top ten teams in pure win percentage appear in the top ten based on Exp Wins. Fermanagh and Monaghan are up there given their aforementioned successful seasons. Longford also had a good year winning 9 of their 13 games. In fact on pure winning percentage they finished second in the country behind Dublin’s 75%.

But what of the remainder? The biggest surprise by far was Limerick. They only won three games in total, ranking them in the bottom third on pure wins alone, but were 7th when compared to their Exp Wins. How so?

Limerick breakdownv2

They were the outsider in all seven of their league games but won three. From those seven games the bookmakers expected them to win 1.87. They outperformed their expected wins by more than a full game. In the Championship they lost by two points away to Clare in a game that had Clare favoured by two and then walked into Tyrone in the first round of the back door. The positive Exp Win total they accumulated in the league was not too badly dented by these two losses – especially the Tyrone one where they were huge outsiders.

Sligo were a bit of a surprise given that they only won four games but again they were quite large underdogs when beating Roscommon in the Championship and complete outsiders in the next two games against Tyrone & Mayo. Given the very low combined Exp Wins from those three games (0.39) that one victory against Roscommon puts them in positive territory for the Championship alone.

Against the Spread

Another way of tracking a team’s performance is to see if they covered the bookmaker’s handicap; or what their ATS (against the spread) was in American parlance. We would expect some cross over with the best performers in the Expected Win list but crucially you don’t have to win a game to beat this performance metric – only play above an expected standard

ATS Top 10

Again six of the teams that appeared in the Exp Wins top ten re-appear. A number of the teams, such as Limerick, Sligo, Fermanagh & Monaghan we have touched upon previously but there are a few surprises. Mayo, despite being a very high profile team, would have been a profitable one to follow on the handicap. Cork, for all the negativity following the losses to Kerry & Kildare, were also profitable but it is London & Leitrim that jump out. Between them they won four games all season but it could be argued they had a pretty good year; their performance exceeded expectations in 12 of their combined 18 games.

London only won one of their nine games all year but managed to cover the handicap on six occasions. Narrow that further and they covered the handicap in five of their seven league games including all three that they played away. You would never state that London had a good season but from a performance perspective we should probably cut them some slack. They performed well above expectation.

Worst Performances

Exp Win Bottom5

Originally the above table was going to be the bottom five but I expanded it to catch two of the bigger fish.

Some of the lower lights – Carlow, Wicklow & Waterford – being down here is not really a surprise given just how few games they won. However it does indicate that perhaps the bookmakers were generally over rating them despite their poor form.

Laois were particularly poor but looking purely at their Championship form they beat Carlow when their Exp Win was 0.86 so get very little credit for that and then had a further three games failing to win any of them when the combined Exp Win was 1.75.

Given they were relegated from Division 1 with just the one win from seven it is perhaps no surprise to see Tyrone down here.

Kerry won seven games throughout the year but were expected to win eight. Creating a league/Championship split Kerry had an Expected win of -0.81 in the league and -0.19 in the Championship. Their Championship was slightly less underwhelming than their league (I kid – sort of!)

ATS Bottom 5

Three of those that appeared in the worst Exp Win table re-appear when we look at the worst performances against the handicap. Wicklow and Waterford not only failed to win enough games but also played poorly in their losses covering a combined four handicaps over 18 games. Given that they won seven games but were only an outsider once during the year – and that a slight outsider in the final against Dublin – it is no surprise that Kerry are again represented.

They had, all told, a good year but were consistently over valued by the bookmakers. Or conversely the bookmakers kept their odds short as the public’s perception of Kerry was that they were performing better than they actually were.

APPENDIX

Note 1; there can be quite a difference in bookmaker’s odds. The odds used for this piece were taken primarily from Paddy Power rather than taking the best prices available across all bookmakers. The main reason for this was laziness on my part as it meant just one source rather than hopping around sites.

When you take the price can also be important. Lines do move. However they were generally taken on Saturday or Sunday morning when any early moves had been accounted for.

Note2; generally speaking the margin on GAA match odds is 109% with lesser games getting up to 112%. A typical line in a close game would be 10/11 (home team), 15/2 (draw) & 6/5 (away team) which equals a book of 109.6%. To make this, and all games, come in at 100% – and remove the bookmaker’s margin – I extracted 3% from each outcome. There is a valid argument that this should be more nuanced (take less off the draw perhaps) but for now it’s fine.

Exp Win Explanation

The home team has a 52.4% chance of winning on the odds. We know this is inflated to account for the bookmaker’s margin. Take 3% away from each of the three outcomes to account for this and the home team now has a 49.4% chance of winning. So using the above quoted odds we get an Exp win of 0.49 for the home team (priced at 10/11) and 0.42 for the away team (priced at 6/5).

Do this for all games for a particular team and you have created an Expected Wins metric.

Cork V Kerry 2015 Munster Championship

July 6, 2015

For those new to the blog, or who haven’t been here for a while, please find a refresher on the definitions and how the numbers are compiled here

Overall

Team Possessions Attacks Attack % Shots Shot % Scores Success % Weighting
Kerry 41 32 78% 26 81% 17 65% +4.051
Cork 40 27 68% 22 81% 15 68% 3.725
Avg 37.0 28.7 77.7% 14.7 51.2%

They are some very impressive numbers – where to start?

In the preview I stated that the 2014 mauling Kerry inflicted was on the back of a trend that saw Cork’s attack differential go from +4 in 2012 to -7 in 2013 & finally -16 in 2014. Cork didn’t quite get back on par here but what they did do was break even in the possession stakes. Again the last three years showed that they had the forwards to finish – they just needed the ball.

The qualities of the Cork forwards were evident in their first two goals.

Mark O’Sé had gotten the better of C O’Neill in the early exchanges but the tables were turned for the first goal. Below are some images clipped just before the goal where O’Neill drifts out to the right and then digs hard to get in behind O’Sé – wonderful movement.

Kerry Cork O'Neill goal

The second goal had wonderful movement of a different stripe. Fitzgerald has O’Connor bang to rights on the wing but O’Connor drives past him and then fights, ignoring the jersey tug, to get in front. After that lung busting battle h then has the presence of mind to deftly lob Kealy with the fisted goal.

Kerry Cork O'Connor

From a Kerry perspective both instances show up a defence that leaked quite a few goals during the league – neither defender was able to hold the attacker in one on ones that seemed, initially, well marshalled.

Shots from Play

Team Shots Scores Success % Weighting
Kerry 18 12 67% +3.926
Cork 15 9 60% +2.845
Avgs 21.4 9.7 45.3%

What of the Kerry forwards? The big difference between how both teams amassed the high weightings was the number of players involved. Cork only had six players contributing to their 15 shots. Kerry on the other hand had 12 players taking a shot with none of them attempting more than two. Seven players attempted just the one shot – with five converting. That is some spread of accuracy.

O’Donoghue continues on his merry way. In four games across four years against Cork he has converted a truly remarkable 94% (15 from 16) of point attempts. He absolutely loves playing Cork.

The Gooch? He only had the one attempt from the left of the D which he converted – after receiving a peach of a pass in space and into the bread basket – from M O Sé. Perhaps his most telling contribution was in the build up to the third goal. There was an interesting conversation on Off The Ball last week about whether a team could afford the luxury of a non “dropping back” half forward and that even the Gooch would have to do his duty. For Cork’s 3rd goal he was in the line to stop Shields but didn’t really impede him.

Kerry Cork Gooch

Shots from deadballs

Player Shots Scores Success % Weighting
B Sheehan (Kerry) 5 3 60% +0.373
J O’Donoghue (Kerry) 2 1 50% -0.312
BJ Keane (Kerry) 1 1 100% +0.064
C O’Neill (Cork) 5 4 80% +0.653
D O’Connor (Cork) 2 2 100% +0.227
team avgs 7.2 4.9 68.7%

Positive day all round but that will ultimately be overshadowed by what happened at the end. Both 45s were central (Sector 5) with a conversion Rate of 50%. So we could have expected an average intercounty player to convert one of them. C O’Neill & J O’Donoghue are no average players though … both missing was probably the outsider of the 4 combinations.

History doesn’t tell us much unfortunately. I have 9 Cork games in the database with two O’Neill 45s; both were central and he converted one – as per the expected return. He was on a good day (4/4 from frees and 1-02 from 5 attempts from play up until then) so was entitled to have a go. D O’Connor had gone off the pitch at that stage but if he was still on I wonder would he have taken it? Again unfortunately I only have two 45s recorded from him – he converted both but they were back in 2012.

Similarly for O’Donoghue I only have the one 45 in the database (which he missed) although he did miss a relatively straight forward free in the corresponding game last year. Again Kerry’s principal deadball proponent was off the pitch; I have four instances of Brian Sheehan taking a 45 with him converting …… 50%!

What it all goes to show is the absolute luxury Dublin have in Cluxton. And if he is so rock steady what does it say of Rock that he has taken over the duties (to date)?

Kickouts

Kerry’s kickouts Won % Turned into an attack % Shot %
Kerry 11 69% 9 82% 8 73%
Cork 5 31% 4 80% 2 40%
Cork’s kickouts Won % Turned into an attack % Shot %
Kerry 5 23% 3 60% 3 60%
Cork 17 77% 12 71% 12 71%

In the 2014 Munster final Cork never went short. They smacked the ball c55-70m and let the likes of Sheehan, Buckley, Walsh & Maher dismantle their game. They were much more nuanced here understanding the importance of primary possession. Although they won their own kickout 17 – 5 what will be really pleasing is that the short kickout did not dominate. When the ball went past the 45 – and the kickout became contestable – they won the possession battle 11 – 5.

On top of that when Kerry kicked the ball past the 45 Cork broke even winning 5 of the ten. Kerry’s kickout stats, unlike Cork, are padded by the 6 short kickout.

Turnovers

Team giving up the ball Pass In the Tackle from a Shot Other
Kerry 9 5 1 1
Cork 7 7 5 3

Rather than a game of two halves this was a conspicuously loose first 15 minutes followed by some of the most controlled play you are likely to see. That first 15 minutes had 19 turnovers – they remaining ~60 minutes (taking in injury time) had a combined 20.

Kerry are past masters at defending through holding the ball. Here they went ~25 minutes – from the 15th to the 38th on the clock plus first half injury time – coughing up the ball only once. That is just phenomenal ball control.

Players with >= 3 shots from play

Shots Scores Success % Weighting
C O’Neill (Cork) 5 3 60% +0.945
D O’Connor (Cork) 3 2 67% +0.968
Barry O’Driscoll (Cork) 3 2 67% +0.612
P Geaney (Kerry) 3 1 67% -0.057

Note; some post game tidying up. I charted Fionn Fitzgerald’s last point as a shot. There has been some debate over whether he meant it but my initial gut reaction was that he did. Also Colm O’Neill had a free on the left wing towards the end which I did not chart as a shot. Again my gut reaction was that taking the free with the left, from the left sideline – and looking where the ball landed – he was trying to drop it near the square (which he did getting a 45 from the scramble).

I missed the fact that Goulding was on the field for the final 45. He converted a number of 45s in the 2010 final as well as having 3 from 3 in the database (2012 – 2014).

Kerry V Cork Preview 2015 Munster Championship

July 3, 2015

Original transcripts of the three games can be found at 2012, 2013, 2014

When Cork have the Ball

Year Attacks Shots Shot % Scores Success % Weighting
2012 37 31 84% 17 55% +1.481
2013 30 26 87% 17 65% +3.850
2014 26 23 88% 12 52% -0.359
Avg 37.0 28.7 77.7% 14.7 51.2%

Cork’s attacking play disintegrated last year. They managed a full 16 less attacks than Kerry did however this was the tipping point of a trend (if 3 games can be considered a trend!) rather than a one off. And something they need to rectify this Sunday.

The difference in attacks over the three years was Cork +4, Cork -7 & Cork -16. 2014’s defeat, whilst comprehensive, was not completely unexpected when compared to 2013. Yes Cork only lost by two points in 2013 but their shooting was sublime that day converting 65% of their shots and only leaving Kerry’s 45 without a shot on four occasions. They couldn’t repeat the trick in 2014.

Last year they converted 88% of their attacks to shots but their attack volume was so low that average shooting only produced 12 points. On 26 attacks an average team will score 0-10 or 1-09 … to get the 17 points that Cork achieved in 2012 and 2013, off average shooting, they will need 42 attacks. Assuming they maintain a high Shot Rate (in the mid 80 percentile) then off average shooting they need 39 attacks.

If they get the best of both worlds – a high Shot Rate and a high Conversion Rate (60%) – they still need 33 attacks. Sunday *has* to be about primary possession and transference of that possession into the 45. They have proved over the three years that they can manufacture shots when they attack and that their shooting is above average. They just need the ball.

From Play

Shots Scores Success % Weighting
2012 22 12 55% +2.34
2013 18 10 56% +2.19
2014 16 5 31% -1.96
Avgs 21.4 9.7 45.3%

Of course what would help immensely are goals. Or even one goal. In the last three games Cork have only manufactured 8 goal shots and returned a paltry 0 – 03. I say *only* as for comparison (unfair) Dublin managed 8 attempts at goal against Kildare scoring 4 – 01 whilst (fair?) combined Dublin & Kerry managed 9 in two games against the vaunted Donegal defence.

Cork were better in 2014 as they managed four attempts but they all came in the last ~15 minutes when the game was over.

Even with four missed goal shots in the numbers Cork’s 2014 shooting from play was abysmal; 33% going for a point (4 from 12) with a combined weighting of -1.335. They’ll need to rediscover the shooting boots from ’12 & ’13 to win on Sunday.

For points by Sector

Sector Shots Scores Success % Weighting
2 1 1 100% +0.62
4 10 3 30% -0.59
5 13 8 62% +1.52
6 9 3 33% -0.23
7 8 4 50% +0.60
8 4 4 100% +1.17
9 3 1 33% -0.25

Nothing about where Cork are shooting from stands out hugely except perhaps that they are just average when shooting from the wings. Against the big teams this can be a productive area as they mind the square – think Flynn against Donegal in last year’s AI semi final. If Cork are going to continue taking 67% (32 of 48 attempts) of their point attempts from between the 20 & 45m then they’ll have to convert more from the wings.

When Kerry have the Ball

Year Attacks Shots Shot % Scores Success % Weighting
2012 33 27 82% 12 44% -1.100
2013 37 33 89% 17 52% +1.345
2014 42 38 90% 24 63% +4.575
Avg 37.0 28.7 77.7% 14.7 51.2%

Kerry’s attacking play has improved year on year with a step up in every metric (attacks, Shot Rate, Success Rate & weighting) from ’12 to ’13 to ’14.

Not much more that can be added really – more of the same from a Kerry perspective

From Play

Shots Scores Success % Weighting
2012 20 9 45% +0.08
2013 26 11 42% -0.05
2014 31 19 61% +4.68
Avgs 21.4 9.7 45.3%

Much like Cork if there was one area of concern for Kerry (concern is a bit strong – an area that needs polishing) it would be their goal taking. In the three games they’ve taken 10 shots at goal but scored only 1 – 02.

Their point taking in 2014 was phenomenal (67% Success Rate with a weighting of +5.313) however prior to that it was average. So what was the difference?

My immediate reaction was to say O’Donoghue – take him out of the picture given his phenomenal 2014 performance and the three games would level off. Not quite

Shots Scores Success % Weighting
2012 18 7 39% -1.14
2013 22 8 36% -1.44
2014 21 11 52% +1.72

Yes O’Donoghue had a huge bearing but the rest of the team stepped up as well. Now undoubtedly they were getting more space (a) due to O’Donoghue and (b) due to the nature of the game compared to ’12 & ’13 but as a collective they still outperformed the two previous years. Something for Cork to note perhaps when they review the 2014 tape.

As for O’Donoghue? He has been incredible against Cork converting 93% (!!) of his point attempts over the three years. Below is his shot chart from ’13 & ’14 (the ’12 version has gone awol) showing how close into goal he has played.

O'Donoghue V Cork
x = for a goal, white = for a point

From Deadballs

Shots Scores Success % Weighting
2012 7 3 43% -1.18
2013 7 6 86% +1.40
2014 7 5 71% -0.11

I stated above that one area Kerry might look to polish up on was goal shots – there is a second. Their deadball shooting has been average over the past three games scoring 0-14 from 21 attempts (67% conversion Rate).

If Cork can keep it close, and increase the pressure on the free taking, this may just be an area that will let Kerry down on Sunday.

Cork V Dublin 2015 League final

April 28, 2015

For those new to the blog, or who haven’t been here for a while, please find a refresher on the definitions and how the numbers are compiled here

Overall

Team Possessions Attacks Attack % Shots Shot % Scores Success % Weighting
Cork 57 28 53% 21 75% 9 43% -1.711
Dublin 57 43 75% 33 77% 22 67% +2.969
Avg 37.0 28.7 77.7% 14.7 51.2%

Dublin will be very pleased with their day’s work but if Galvin wanted to nit-pick on something over the coming months it could be that this facile victory was built upon a second half when the game was done. In that second half their shooting returns were 12 of 15 (80%) with a weighting of +3.127. They were not clinical enough in the first half – against a better team they may find themselves in a hole with such finishing.

Still they *did* score 1-21. The above is cribbing for the sake of cribbing.

Cork on the other hand won’t be searching too hard for bulletin board material throughout the Summer. They had low shot volumes with poor execution but this all stemmed from the very low volume of attacks they had (28 to Dublin’s 43).

Although they had enough ball to be in the game they were wholly unable to use it. Cork only managed to get every other possession (53% in total) into the opposition’s 45. Dublin pressed hard up high which stifled Cork’s ability to move the ball. This was encapsulated in a little snippet around the 16th minute in the first half. About 30m out Brady hand passed a ball to McManamon but as the ball arrived McManamon slipped. Instead of lamenting his bad luck Brady chased down Cadogan, who had picked up the ball, and pressured the ensuing pass. Cadogan kicked the ball straight over the sideline – a Cork turnover, and possible counter attack, was snuffed out before it had even begun.

Shots from Play

Team Shots Scores Success % Weighting
Cork 14 3 21% -2.582
Dublin 24 14 58% +1.744
Avgs 21.4 9.7 45.3%

Perhaps the most surprising return from the game was that Dublin only managed one shot at goal from play – when Jack McCaffrey hit the post in the second half. In 2013 25% of all their shots were at goal. The new conservative Dublin or just a one off?

Elsewhere Rock, Kilkenny and Andrews were very good hitting a combined 8 from 8 with a weighting of +4.078

The most disappointing aspect of the day was Cork’s exceptionally poor shooting. Hurley & O’Neill are two of the best marksmen in the game but they were 1 from 5 on the day. Daniel Goulding missed three as well for good measure.

As a whole Cork only had nine point attempts from play converting one. Although the shooting was undoubtedly affected by the limited volume Cork’s problems were not solely limited to moving the ball up the pitch.

Shots from deadballs

Player Shots Scores Success % Weighting
D Rock (Dublin) 7 7 100% +1.312
D Connolly (Dublin) 1 1 100% +0.182
S Cluxton (Dublin) 1 1 100% -0.269
C O’Neill (Cork) 5 5 100% +1.410
B Hurley (Cork) 1 1 100% +0.064
J Hayes (Cork) 1 0 0% -0.603
team avgs 7.2 4.9 68.7%

A good day all round with only Cluxton’s very long range free and Hayes’ last kick of the ball missing the target.

Although O’Neill converted two less than Rock his weighting comes in higher due to the nature of the frees both attempted. Only two of Rock’s seven frees came from the wings whilst O’Neill converted three from the wings – including a 45. Rock’s volume basically made up for O’Neill’s difficulty.

Kickouts

Corks’s kickouts Won % Turned into an attack % Shot %
Cork 24 77% 14 58% 9 38%
Dublin 7 23% 6 86% 5 71%
Dublin’s kickouts Won % Turned into an attack % Shot %
Cork 1 7% 0 0
Dublin 13 93% 10 77% 8 62%

Dublin lorded their own kickouts winning 93% (13 from 14).

Cork were also strong on their own kickout – winning 77% (24 from 31) but this drops to 65% when the short kickouts are removed. That in itself is not bad but the high volume of short kickouts is somewhat padding the stats.

Although they got their hands on the football Cork struggled to get the ball upfield once the kickout was won. Of the 23 kickouts they won inside their own half Cork only managed to move 57% ( 13 of the 23) into the opposition’s 45

Cork have been very fond of the short kickout in the past two games – 40% of the 57 kickouts dropped short of the 45 – it will be interesting to see if they persist with this method throughout the year and whether that continues into them struggling to get attacks off against better teams.

Shot Charts

Cork’s shooting
Cork shooting (v Dublin)

Dublin’s shooting
Dublin shooting (V Cork)

x = missed, disc = score, yellow = deadball, black = 1st half from play, white = 2nd half from play,

Players with >= 3 shots from play

Shots Scores Success % Weighting
B Brogan (Dublin) 4 2 50% -0.172
D Rock (Dublin) 3 3 100% +1.495
C Kilkenny (Dublin) 3 3 100% +1.417
K McManamon (Dublin) 3 1 33% -0.636
D Goulding (Cork) 3 0 0% -1.175
B Hurley (Cork) 3 0 0% -1.184

Cork v Mayo 2014 Championship

August 4, 2014

For those new to the blog, or who haven’t been here for a while, please find a refresher on the definitions and how the numbers are compiled here

Overall

Team Possessions Shots Shot Rate Scores Success Rate Weighting
Cork 34 28 82% 17 61% +2.296
Mayo 50 39 78% 20 51% +1.353
Champ (’12 & ’13 avg) 35.8 27.6 77.2% 14.1 51.0%

In the game of percentages Cork won easily. They had a higher Shot Rate and an excellent Success Rate – the problem was that Mayo’s volume of attacking possessions was just so large that no excellence in shooting could bridge the gap.

That’s not to say that some of Mayo’s shooting was not excellent. It was – especially towards the end with Vaughan’s point under pressure & O’Connor’s free from the right with the right foot. But generally speaking Mayo had the volume of shots whereas Cork had the accuracy.

That volume of attacks is a huge step up on what Mayo have produced this year (41 against Galway & 36 against Roscommon). Even in the hammerings they dispensed in last year’s Championship to Galway (x36 attacks), London (x46) and Donegal (x49) they never breached 50.

Some will argue that part of that volume can be attributed to the Cork system which, with two deep lying sweepers in the first half, invited Mayo to carry the ball to the 45 however this does not entirely explain it – indeed the half splits were 24 attacks in the first half and 26 in the second. The next table however goes some way to explain just how Mayo had so many attacks.

Where attacks originated

Opposition k/out Own k/out Ball received in Own 3rd Ball received in Mid 3rd Ball received in Opposition 3rd Other (throw-in, rebound etc.)
Cork 4 14 12 1 1 2
Mayo 8 14 10 9 5 4

Mayo manufactured 12 extra possessions from outside their 65m line. By sitting back and not pressuring Mayo Cork only really collected the ball inside their own 45. Mayo on the other hand manufactured easy attacks by receiving the ball in prime positions time and again. Given how well Cork were shooting it was gaining these easy attacks that was the difference maker.

Shots from Play

Team Shots Scores Success Rate Weighting
Cork 19 10 53% +1.591
Mayo 35 17 49% +1.153
Champ avgs (’12 & ’13) 20.3 9.2 45.4%

35 shots from play is up there with Dublin’s returns (34 v Laois, 37 v Wexford & a ridiculous 41 v Meath) whilst a Success Rate of 49% is healthy.

The one aspect of this that might concern James Horan and his backroom team is how relatively few goal shots there were. In total they went for goal three times in this game which followed on the four attempts in the Galway game and zero against Roscommon. For the three games in which they have been featured on TV Mayo are running at a goal shot every 9.29 point attempts. Dublin are running at a goal shot for every 4.09 attempts at a point.

Of interest is the fact that Mayo only converted 14% (1 from 7) of their shots from the right between the 20 & 45m line. There was no one culprit with six different players missing from that area. In the previous two games their Success Rate from this sector was 38% (5 from 13) – which is about bang on average. It would appear to be “one of those things” but definitely something to keep an eye on in the semi final.

As a contrast Cork converted three of their four attempts from the same area but the fact that they had 16 shots for a point, as opposed to Mayo’s 32, just emphasises the problems they had manufacturing scores.

Despite their excellent returns from the right one thing that is evident on the shot charts below is how infrequently Cork were able to get a shot off from in front of goal beyond the 20m line. Mayo had eleven shots from this productive central area – Cork had three.

Shots from deadballs

Player Shots Scores Success Rate Weighting
C O’Connor (Mayo) 4 3 75% +0.199
C O’Neill (Cork) 4 3 75% +0.048
D O’Connor (Cork) 2 2 100% +0.313
A Walsh (Cork) 2 1 50% +0.257
B Hurley (Cork) 1 1 100% 0.087
team avgs (’12 & ’13 Champ) 7.3 4.9 66.7%

All round solid displays without anyone being spectacular. We have seen a trend towards longer attempts at goal this year (Beggan, Morgan & Murphy spring to mind) and Cork had three attempts from outside the 45 in this game. Walsh was successful with one mammoth free but missed a second whilst O’Neill also missed one from beyond the 45. One from three is about par but given the general excellence of Cork deadball striking over the years this is an area they would have hoped to gain an advantage from – over the three games they were on TV this year their Success Rate from long range frees was 38% (3 from 8) with a weighting of -0.4977.

One thing to note is that Mayo only won four frees within shooting range (3 points from O’Connor and one that was quickly taken to Vaughan for a fisted point). In their two previous games against Galway & Roscommon they won 6 & 7 respectively so it is not something they will dwell on but credit should be given to the Cork backs for their discipline in marking the Mayo forward line.

O’Neill shows up well here for Cork – I had him winning five of the six frees Cork attempted inside the 45. Incidentally Tom Cunniffe gave away three of these fouls with Cafferkey (x2) & Keegan being the other culprits.

Turnovers

Team “coughing up” possession Shots from Turnovers %
Cork 30 21 70%
Mayo 26 14 54%


Misplaced Pass Tackled Shots not going dead Other
Cork 15 9 3 3
Mayo 9 6 5 6

Mayo were able to transition 70% of the turnovers they manufactured (or received!) into shots. On such a high volume of turnovers that is a remarkable percentage.

Of course what helped them to maintain such a high percentage was where they won their turnovers. 9 of the 30 were won inside Cork’s 65 with Mayo getting a shot from all nine and scoring 1-05.

Nine turnovers that high up the pitch is a phenomenal number. Mayo got 5 such turnovers against Roscommon and four against Galway whilst the highest Dublin have managed this year is 7 (V Meath). Those turnovers are Class A counter attack possessions and Mayo were clinical in how they dispatched them.

Kickouts

Cork’s kickouts Won % Turned into a possession % Shot %
Cork 25 76% 14 56% 11 44%
Mayo 8 24% 8 100% 5 63%
Mayo’s kickouts Won % Turned into a possession % Shot %
Cork 5 23% 4 80% 4 80%
Mayo 17 77% 15 88% 11 65%

I define winning a kickout as being the first team to gain possession of the ball – in that respect Cork did not do too badly. Yes they had five more kickouts than Mayo but if you gave Cork essential parity – in terms of shots generated from kickout possessions – prior to the game I think they would have taken it.

Of course whilst the raw numbers here seem to show Cork acquitting themselves adequately they did have trouble on their own kickouts. We have seen that Mayo pressed very effectively in Cork’s half and the fact that Cork were willing to go short so often to protect possession enabled them to do this. Cork may have gotten their hands on the ball first (on 16 of 17 short kickouts) but often times they did so under extreme pressure (Doherty robbing Kelly & Cadogan having a hand pass intercepted spring to mind).

When they did kick past the 45 it became much more of a contest with Cork winning the possession battle 9-7 on the remaining 16 kickouts. But again of those nine wins seven were done so with a Mayo man contesting the kickout.

Mayo won 77% of their own kickouts but the remarkable thing about this is that they only went short three times. Whereas Cork won 56% of their own kickout that landed beyond the 45 Mayo won a hugely impressive 74%.

The fact that they won the kickout so far from their own goal enabled them to turn such a high percentage (92%) of their wins into attacks

As a complete aside the fact that Mayo were having such dominance on contested kickouts is a reason why I would have attempted to manufacture a goal attempt with that last free. Granted Cork won the previous Mayo kickout – and A O’Shea was off the pitch – but Cork must have had a <40% chance of gaining possession from that kickout.

Shot Charts

Cork’s shooting
Cork shooting (V Mayo)

Mayo’s shooting
Mayo shooting (V Cork)
x = missed, disc = score, yellow = deadball, black = 1st half from play, white = 2nd half from play

Players with >= 2 shots from play
Alan Dillon had a very productive day only missing on one of his five attempts for a point whilst his other miss was a shot at goal from very close range attempted when O’Halloran was on top of him.

Shots Scores Success Rate Weighting
A Dillon (Mayo) 6 4 67% +1.169
B Hurley (Cork) 6 4 67% +0.966
C O’Neill (Cork) 4 2 50% +0.497
J Doherty (Mayo) 4 2 50% +0.424
C O’Connor (Mayo) 4 2 50% +0.424
D Vaughan (Mayo) 4 2 50% +0.081
S O’Shea (Mayo) 4 2 50% -0.065
D O’Connor (Cork) 2 2 100% +1.176
A Moran (Mayo) 2 2 100% +1.094
F Goold (Cork) 2 2 100% +1.003
A O’Shea (Mayo) 2 1 50% +0.233
K McLoughlin (Mayo) 2 1 50% +0.142
L Keegan (Mayo) 2 1 50% -0.068

Cork V Sligo 2014 Championship

July 28, 2014

For those new to the blog, or who haven’t been here for a while, please find a refresher on the definitions and how the numbers are compiled here

Overall

Team Possessions Shots Shot Rate Scores Success Rate Weighting
Cork 44 38 86% 21 55% +2.055
Sligo 35 25 71% 12 48% -0.662
Champ (’12 & ’13 avg) 35.8 27.6 77.2% 14.1 51.0%

An excellent set of numbers from Cork with all the main markers coming in above average. They will also be delighted, from a defensive point of view, that they kept Sligo to a Shot Rate as low as 71%. Sligo had a lot of the ball but were unable to penetrate Cork’s defense in any meaningful way.

Where attacks originated

Opposition k/out Own k/out Ball received in Own 3rd Ball received in Mid 3rd Ball received in Opposition 3rd Other (throw-in, rebound etc.)
Cork 6 13 14 7 1 3
Sligo 2 17 11 2 2 1

Both teams manufactured 19 attacking possessions from kickouts – it was Cork’s ability to (a) create turnovers (or conversely Sligo’s inability to mind the ball) and (b) convert the turnovers they manufactured into shots that ensured Cork had so many more attacks.

Shots from Play

Team Shots Scores Success Rate Weighting
Cork 29 15 52% +1.495
Sligo 16 5 31% -1.258
Champ avgs (’12 & ’13) 20.3 9.2 45.4%

Again good accuracy from Cork. Kerrigan was granted man of the match for his industrious performance that resulted in 5 points from play from 10 shots however it is Colm O’Neill’s returns that were the real highlight; 6 from 6 with a weighting of +2.959 which is just behind the weighting achieved by James O’Donoghue against Cork. Add in his deadball accuracy and he had a 100% game (3x frees, 1x 45, 2x points from the right & 4x points from the centre). The only blip was that one of his points was an attempt at goal – but still he at least got the point.

There will come a point when we can adequately judge the quality of the opposition’s defence on a player’s shot attempts however until then the weighting is the best method we have for comparing performances across games. Personally I think Munnelly’s performance against Dublin is the best this year but from a weighting perspective this O’Neill performance, and O’Donoghue’s game against Cork, lead the way.

Speaking of goal attempts Cork only had the two (O’Neill’s & Goulding’s towards the end of the game) from 29 shots. Four times they were close enough to goal to attempt a fisted point (Kerrigan missed one whilst off balance). If that was Dublin they would have looked to recycle the ball and created one if not two goal shots.

Shots from deadballs

Player Shots Scores Success Rate Weighting
C O’Neill (Cork) 4 4 100% +1.638
A Walsh (Cork) 3 1 33% -0.757
B Hurley (Cork) 2 1 50% -0.322
A Marren (Sligo) 7 5 71% -0.309
M Breheny (Sligo) 2 2 100% +0.906
team avgs (’12 & ’13 Champ) 7.3 4.9 66.7%

Considering the scoreline was not close for large tracts of the game it might be somewhat surprising that there were 16 shots at goals from frees (2x 45s made up the rest of the deadballs) however this is bang in line with the 2013 average (one free for every 2.8 shots from play).

Looking ahead the spread of those Cork players committing the fouls was wide with only Aidan Walsh (x3) committing more than one foul from which Sligo attempted a shot.

Although Marren had a relatively good Success Rate at 71% the negative weighting indicates that the level of difficulty of those he converted were on the easy side. All 5 were central with only the long range effort just outside the 45 being considered on the difficult side.

Given the deadball talent at their disposal Cork’s long range free taking was below par with Walsh missing two (a long range free & a 45) whilst Hurley also missed a free just outside the 45.

As we have touched on earlier the one bright spark for Cork from deadballs was O’Neill – though even at that his four were relatively central as well.

Turnovers

Team “coughing up” possession Shots from Turnovers %
Cork 25 15 60%
Sligo 33 22 67%


Misplaced Pass Tackled Shots not going dead Other
Cork 11 5 5 4
Sligo 16 6 4 7

Pretty good from Cork. Although there were quite a high volume of turnovers in the game Cork only committed 25 with a high percentage (20%) coming from shots dropping short.

Cork also converted 67% of Sligo’s 33 turnovers to shots. As an overall percentage 67% is just a tad below the best returns but is very respectable.

One point they will want to tidy up on is giving turnovers away in their own half. On three occasions Cork gave Sligo the ball within their own 65. Sligo managed one point from these three turnovers however more clinical teams will be looking to pounce on such lapses.

Kickouts

Cork’s kickouts Won % Turned into a possession % Shot %
Cork 16 80% 13 81% 11 69%
Sligo 4 20% 2 50% 2 50%
Sligo’s kickouts Won % Turned into a possession % Shot %
Cork 9 29% 7 78% 5 56%
Sligo 22 71% 16 73% 11 50%

There was much criticism of Cork’s kickout strategy against Kerry with little variation exhibited when Kerry got on top. In that game Cork’s first five kickouts went long – long – long – long – mid. Here they went short – short – mid – short – mid. A case of change & adapt!

Against Sligo Cork were much more concerned with securing primary possessions from their kickouts than had been the case previously with 50% of all their kickouts going short. Their running & transition game was working effectively so they were able to convert 60% (6 from 10) of these short kickouts to shots.

Of the remaining 10 Cork won 6 getting a shot from 5; Sligo got their hands on four and managed a shot from two of them. Cork will be pleased, considering the attention being placed on this area of their game post the Kerry match, that Sligo only got two shots in the entire game from their kickouts.

What might be of more concern for Cuthbert and his backroom staff will be how they performed on Sligo’s kickouts.

Sligo went short on 9 kickouts. Of the remaining 20 – which should be contestable given that the ball lands outside the 45 – Sligo gained possession on 60% (12 from 20). Their ability to convert that possession to shots was poor (6 shots from those 12 wins) given how far up the pitch they won that possession. Other teams may not be as forgiving.

Shot Charts

Cork’s shooting
Cork shooting (V Sligo)

Sligo’s shooting
Sligo shooting (V Cork)
x = missed, disc = score, yellow = deadball, black = 1st half from play, white = 2nd half from play

Players with >= 2 shots from play

Shots Scores Success Rate Weighting
P Kerrigan (Cork) 10 5 50% -0.194
C O’Neill (Cork) 6 6 100% +2.959
A Marren (Sligo) 5 1 20% -0.863
S Coen (Sligo) 4 2 50% +0.318
A Walsh (Cork) 4 1 25% -0.716
D Hodnett (Cork) 2 1 50% +0.282
M Breheny (Sligo) 2 1 50% +0.215
B Hurley (Cork) 2 0 0% -0.718
P Hughes (Sligo) 2 0 0% -0.785

Cork V Kerry 2014 Championship

July 8, 2014

For those new to the blog, or who haven’t been here for a while, please find a refresher on the definitions and how the numbers are compiled here

Overall

Team Possessions Shots Shot Rate Scores Success Rate Weighting
Cork 26 23 88% 12 52% -0.359
Kerry 42 38 90% 24 63% +4.575
Champ (’12 & ’13 avg) 35.8 27.6 77.2% 14.1 51.0%

A stunning performance from Kerry no matter the metric. Outstanding accuracy on a very high Shot Rate from a large base of attacking possessions. You could not ask for more.

Their dominance can be summed up in a few nuggets
• In 18 minutes play in the first half Cork controlled the ball once inside Kerry’s 45
• After Cork started the second half with three points Kerry had 13 of the next 14 attacks
• Kerry did not misplace a pass for 31 minutes in the 2nd half

Whilst both teams have lost a large number of household names from last year Cork’s inability to get attacking possession here is a carryover from the 2013 Munster Final. That day they had 30 attacking possessions (to Kerry’s 37) but had a phenomenal Success Rate of 65% that got them back into the game. Here there was no repeat of that shooting accuracy and the paucity of attacking ball told for their chances pretty quickly.

Indeed the metrics may actually hide just how poor Cork were. Excluding the last 10 minutes, when Kerry arguably let up (I present Cork gaining possession on their last 8 kickouts as evidence!) their possession total was 20.

Shots from Play

Team Shots Scores Success Rate Weighting
Cork 16 6 31% -1.964
Kerry 31 19 61% +4.684
Champ avgs (’12 & ’13) 20.3 9.2 45.4%

In the Dublin – Laois game it was noted that “It will be an exceptional shooting performance that tops what we witnessed” when commenting on Ross Munnelly’s performance. At the time he had topped anything we had seen in 2013 – O’Donoghue’s day was another leap above that.

O’Donoghue recorded an 80% Success Rate on 10 shots with a weighting of +2.967 – and one of his misses was an attempt at goal. He therefore had an 89% Success Rate when going for points. Ridiculous.

He was ably supported by Geaney & Buckley who combined for a Success Rate of 70% on 10 shots with a combined weighting of +2.564. Three players combining for 0-15 from play from 20 shots. The average would be 0-09.

If you wanted to find something to gripe about then the fact that they didn’t convert any of their four goal shots could be one area. But you would really be stretching for a gripe. Another area that may be of concern is the lack of pressure that Cork placed on the forwards – could this performance be reproduced?

Of their 27 shots for a point 17 were taken under no pressure – 63% in total. Kerry converted 11 of these for a Success Rate of 65%. Of those taken under pressure 70% were converted (7 out of 10). No real difference in terms of conversion rates and nothing that could be gleaned regarding future games.

Prior to the Championship I wrote about how Kerry would struggle to replace the quality of Cooper’s returns (here). I was reminded during the week of the Ewing concept articulated by Bill Simmons – essentially how other players step up and show themselves to be better than previously thought when a leader is injured. Step 1 for Kerry well and truly accomplished.

Cork’s numbers look terrible from an accuracy stand point and it could be argued that this is driven in the main by desperate attempts for goal at the end of the game. After 60 minutes however their weighting was -0.957 on (a paltry) 11 shots. Their radar was missing from early doors.

Shots from deadballs

Player Shots Scores Success Rate Weighting
B Sheehan (Kerry) 4 3 75% +0.340
J O’Donoghue (Kerry) 3 2 67% -0.449
D Goulding (Cork) 4 4 100% +1.199
B Hurley (Cork) 3 3 100% +0.406
team avgs (’12 & ’13 Champ) 7.3 4.9 66.7%

About the only positive you could take from this game, from a Cork perspective, was Goulding’s deadball striking. Hurley hit 3 from 3 however they were all very central; Goulding on the other hand converted a 45 and a very tight free on the corner of the sideline and 20m line.

The impression that one will take from this game, re Kerry’s deadball striking, is Bryan Sheehan’s effortless 45 & the ridiculous free from the sideline on the 13m line. However the overall returns paint a different picture. On top of those two sublime efforts were two misses one of which was on top of the D.

Prior to this game there were 12 Kerry Championship games in the database that showed a 62% Success Rate (31 from 50), with a combined weighting of +0.720, for non Cooper deadballs. Essentially average. Despite the perceptions from the Sheehan’s efforts the returns here were much the same – a Success Rate of 71% (5 from 7) with a combined weighting of -0.109

Kickouts

Cork’s kickouts Won % Turned into a possession % Shot %
Cork 20 61% 11 55% 10 50%
Kerry 13 39% 10 77% 10 77%
Kerry’s kickouts Won % Turned into a possession % Shot %
Cork 8 47% 6 75% 5 63%
Kerry 9 53% 7 78% 7 78%

(note that there was no 65m line marked on the pitch – therefore trying to identify “long” & “mid” kickouts was difficult on borderline 65m kickouts)

The full set of numbers, over 70 minutes, do not reflect the dominance that Kerry had in this area nor the apparent lack of alternative strategies that Cork seemed to possess.

Kerry lost 8 of their kickouts to Cork but two were in the first three minutes whilst three were at the end in the last 10 minutes. For the 60 minutes in between Kerry won 7 of their own 10 kickouts gaining 0-05 points to Cork’s 0-01.

Cork do not appear to have performed too badly on their own kickout however their performance was bookended by winning 8 of their first 10 and also their last 8 when the game was gone. Whilst the game was in the melting pot they lost 11 out of 15.

Despite getting cleared out in this period of the game the kickout never really varied – it was kicked c55-70m with a range of about 10m either side of the centre – a nice big rectangle for Sheehan, Buckley, Walsh & Maher to establish base camp. During this phase, either side of half time, Kerry manufactured 9 shots from possessions on Cork kickouts to Cork’s two.

What is surprising is that Cork never went short. They did so on one in five of their kickouts in the league game against Kerry and had manufactured two shots from the two short kickouts they had executed prior to this phase (admittedly one of them was taken by Cahalane under severe pressure but it was taken).

Contrast this steadfast approach with that of Kerry. Cork came out in the 2nd half with the wind and manufactured three points from four shots. This included winning two Kerry kickouts that had been dispatched down the middle. Kerry’s response? They went short with the next one and relieved the pressure

Turnovers

Team “coughing up” possession Shots from Turnovers %
Cork 26 19 73%
Kerry 18 8 44%


Misplaced Pass Tackled Shots not going dead Other
Cork 11 7 4 4
Kerry 6 6 3 3

Very good from Kerry. When they did receive a turnover they converted 73% into a shot which is up there with the best returns we have seen (small sample size granted).

But perhaps more impressive was what they did on turnover ball that they forced. One could group “Mishandled” and “fouled ball” with tackles as generally these occur because of the pressure being employed by the opposition. Kerry thus “forced” 11 turnovers and they converted these forced turnovers to a shot 91% of the time (10 from 11). That has got to be hugely demoralising to the opposition.

On the other hand Kerry only misplaced 6 passes in the entire game. In the second half they went 31 minutes without misplacing (opposition getting the ball) a pass.

Shot Charts

Cork’s shooting
Cork Shooting (V Kerry)

Kerry’s shooting
Kerry shooting (V Cork)
x = missed, disc = score, yellow = deadball, black = 1st half from play, white = 2nd half from play

Players with >= 2 shots from play

Shots Scores Success Rate Weighting
J O’Donoghue (Kerry) 10 8 80% +2.967
J Buckley (Kerry) 5 4 80% +1.907
P Geaney (Kerry) 5 3 60% +0.658
B Hurley (Cork) 4 1 25% -0.591
D Goulding (Cork) 3 2 67% +0.643
S O’Brien (Kerry) 3 1 33% -0.265
P Kerrigan (Cork) 2 0 0% -0.833

Dublin V Cork 2014 League

April 15, 2014

For those new to the blog, or who haven’t been here for a while, please find a refresher on the definitions and how the numbers are compiled here

Overall

Team Possessions Shots Shot Rate Scores Success Rate Weighting
Dublin 54 45 83% 22 49% -1.280
Cork 35 28 80% 14 50% 0.719
Champ (’12 & ’13 avg) 35.8 27.6 77.2% 14.1 51.0%

Please note that Cork’s second goal is not considered in the below returns. Although it emanated from a Cork shot that shot is deemed to have dropped short rather than the end result being a goal.

44 is the highest number of shots recorded in a game to date. It generally won’t matter what your Shot & Success Rates are if you can totally smother the opposition in shots.

As it happens Dublin’s shooting was quite poor converting only 49% of their shots. Cork’s returns were actually average – their shooting was, however slightly, better than Dublin’s – but they just could not deal with the avalanche of attacks.

1st half

Possessions Shots Shot Rate Scores Success Rate Weighting
Dublin 22 17 77% 7 41% -1.273
Cork 23 20 87% 10 50% 0.681

2nd half

Possessions Shots Shot Rate Scores Success Rate Weighting
Dublin 32 28 88% 15 54% -0.007
Cork 12 8 67% 4 50% 0.038

This game was the atypical game of two halves. It was not that Cork were more dominant than Dublin in that first half – they had 23 possessions to Dublin’s 22 – but rather they were more clinical in their shooting.

In the second half however Dublin took over with 32 possessions & 28 shots (a Shot Rate of 87.5%). There are teams that would struggle to achieve those numbers in 70 minutes let alone 35.

Shots from Play

Team Shots Scores Success Rate Weighting
Dublin 37 17 46% -0.757
Cork 26 13 50% +1.107
Champ avgs (’12 & ’13) 20.3 9.2 45.4%

Again we can see that Cork’s radar was more accurate than Dublin’s – Dublin just (!) had an extra eleven shots.

Some of Dublin’s starters had quite an off day with A Brogan, McManamon, Connolly & Andrews combining for a very poor stat line of 5 scores from 20 shots (20% Success Rate) with a weighting of -3.803. It was the accuracy of O’Gara, B Brogan & McAauley that ensured the returns were just below average.

A quick mention for Brian Hurley as well. Against Kerry he hit 7 scores from 11 shots and was on course to better that here with a first half return of 5 points from 7 shots. I’m not sure what’s more remarkable – the volume of shots or the combined Success Rate of 67% (average = 45%) during that span. Unfortunately for Cork he was starved of the ball in the second half and didn’t manage to get another shot off.

Shots from deadballs

Player Shots Scores Success Rate Weighting
B Brogan (Dublin) 3 3 100% +0.618
D Connolly (Dublin) 3 2 67% +0.056
S Cluxton (Dublin) 2 0 0% -1.197
D Goulding (Cork) 2 1 50% -0.387
team avgs (’12 & ’13 Champ) 7.3 4.9 66.7%

Much like the Kerry-Cork game last week the figure that jumps off the page is Dublin only affording Cork two shots at goal, or one for every 17.5 possessions, from free kicks.

Dublin had 7 frees, or 1 free in scoring range for every 7.7 possessions, converting four. Cluxton missed two but one of them was a monster attempt from outside the 45

Kickouts
Dublin won 64% (37 out of 58) of all kickouts gaining 12 extra shots from the possessions won but this really was a case of contrasting fortunes.

Dublin had a total of 24 kickouts in the game and won possession on 21 of these (88%). This return is inflated however by the fact that, from afar, Cork appeared to be content to ‘let’ Dublin have the short kickout. This worked initially in that Dublin did not manage to manufacture a shot from the first 5 kickouts that went short but of the next eight short kickouts Dublin got a shot off 6 times. The stat that best shows that Cork’s tactic didn’t work was that from Dublin’s 24 kickouts Dublin managed a shot 12 times; Cork managed two.

Cork more or less broke even on their own kickouts winning 18 to Dublin’s 16. This wasn’t enough however considering that the tactic on Dublin’s kickouts wasn’t working.

In the 30 minutes of Dublin dominance in the second half Cork had 20 kickouts. They gained primary possession on 11 of these so the kickouts did not collapse per se in that period. They got their hands on the ball as often as they did in the first half. They were just not able to get their hands on Dublin kickouts nor turnover the ball when Dublin were attacking (28 shots from 31 possessions)

Players with >= 2 shots from play

Shots Scores Success Rate Weighting
B Hurley (Cork) 7 5 71% +1.832
A Brogan (Dublin) 6 1 17% -1.476
P Andrews (Dublin) 5 2 40% +0.023
K McManamon (Dublin) 5 1 20% -1.634
C O’Neill (Cork) 4 2 50% -0.040
D Connolly (Dublin) 4 1 25% -0.716
E O’Gara (Dublin) 3 3 100% +1.158
B Brogan (Dublin) 3 2 67% +0.434
D O’Connor (Cork) 3 1 33% -0.078
M Collins (Cork) 3 1 33% -0.238
P Flynn (Dublin) 2 2 100% +1.094
MD MacAuley (Dublin) 2 2 100% +0.884
D Goulding (Cork) 2 1 50% +0.142
F Goold (Cork) 2 1 50% -0.207
P Kerrigan (Cork) 2 0 0% -0.719
P McMahon (Dublin) 2 0 0% -1.116