Posts Tagged ‘championship’

2019 All Ireland Review

September 12, 2019

The preview of this game is referenced throughout the below and can be found here

Overview

• Kerry won the possession battle – but mainly through regaining shots rather than kickouts or turnovers
• They also had more shots than Dublin
• On raw volume Kerry had five shots at goal only returning 1 – 01. Dublin had one and returned 1 – 00. But Kerry had a propensity to foul O’Callaghan to stop the attempts at goal whilst O’Shea popped over 0 – 02 from subsequent 45s
• Dublin were brilliant on the use of kickouts scoring 1 – 10 from 25

Dublin attack

(disc = score, X = miss; yellow = deadball, red = attempt at goal, black = point attempt 1st half, white = point attempt 2nd half)

This is not Jim Gavin’s template. In the four games used within the preview Dublin produced a 62% Conversion Rate on point attempts with 54% coming from “outside”. Here they were 47% (0 – 09 from 19) with 63% (12 of 19) coming from “outside”. Neither are horrendous but when compared to their previous outputs it does look like Kerry knocked them out of their stride. I say Kerry but quite a lot of the poor Conversion Rate was execution. Of their 12 shots “outside” I tagged eight as being taken under little or no pressure. From those eight Dublin managed just 0 – 01

Part of the reason for the “inside”/”outside” split was Kerry’s propensity to foul. They gave Dublin eight shots at goal from frees with six being very central – including four on O’Callaghan (nicely rotated by Kerry – one each for Foley, Barry, Murphy & O’Sullivan). These inside frees are also directly relatable to the fact that Dublin only had one shot at goal. Less shots at goal because Kerry were intent to foul O’Callaghan. More fouls equate to less mayhem (rebounds, pulling up for easy point attempts inside the 20m line) which affects the inside/outside ratio.

On those goal attempts, Kerry only allowing one (frees on O’Callaghan aside) was an exceptional defensive effort. From 2018 (the Super8 games onwards) Dublin have averaged five attempts a game (6, 1, 8, 2, 3, 8, 5 and 7 before the drawn game). Even if we include the O’Callaghan attempt that was pulled back for a free (as an aside this isn’t recorded in the database as the end result of the possession was a shot at goal from a free …) that means that Kerry allowed a shot at goal once every 21 possessions. Dublin had been producing a goal attempt once every 8.5 possessions in the run up to the final. And this would appear to be repeatable as after the Munster final Kerry had allowed only eight shots at goal – or one every 23 possessions!

At a player level Kerry were excellent at nailing down Dublin’s Big3 (O’Callaghan, Mannion & Kilkenny). In the run up to the final they were accounting for 49% of Dublin’s point attempts with an incredible Conversion Rate of 71%. Here they combined for just 0 – 03 off five points. You cannot say that these three were peripheral as they combined for 11 primary assists but Kerry did lock down their shooting. One man who was, in an attacking output sense, peripheral was Scully. He didn’t pull the trigger whilst on the pitch and his only primary assist was the final pass for McCaffrey’s goal.

And yet for all this the strength of Dublin’s panel flowed through with Rock & McCaffrey combining for 1- 06 from 9 shots.

Rock’s numbers were gaudy. Scoring 0 – 10 in an All Ireland is a phenomenal achievement. But we must overlay a little context here. 0 – 07 came from nine deadballs with 0 – 06 coming from readily scoreable positions. He got everything, deadball wise, he was expected to and missed two of his three hard ones; – out wide right with his right and the last kick from on the sideline.

Kerry’s attack

Kerry had two more shots than Dublin (31 to 29). This quite simple statement is not to be taken lightly. Only Mayo, in the 2015 semi final and 2017 Final, had achieved this in the 20 late stage games (QF/Super 8s onwards) in Dublin’s drive for 5.

They were very similar to Dublin on point attempts with 19 in total and 58% (11 of 19) “outside”. Dublin were 0 – 03 from 12 on their outside shooting; Kerry 0 – 04 from 11. Dublin got 0 – 06 on their seven “inside” shooting with Kerry producing a relatively poor 0 – 04 from 8.

(disc = score, X = miss; yellow = deadball, red = attempt at goal, black = point attempt 1st half, white = point attempt 2nd half)

Dublin will look to up their “Outside” returns but Kerry equally have room to improve on the easier “Inside” attempts. Whether they will is another matter – their “inside” shooting has been consistently poor all year; in the four games from the Super8 to the semi final they were 59%. I cannot give a concrete reason as to why Kerry have been so consistently poor “inside”. But it is definitely a thing.

The big divergence on how the teams performed, and executed, was on goal attempts. It is a crude (but effective) read through that Kerry restricted Dublin here by fouling O’Callaghan. So their attempts are somewhat supressed in the raw numbers. Still Kerry produced a very impressive five shots at goal but only returned 1 – 01. Given one of these attempts was a penalty – which are converted at a rate > 80%, the expected return is somewhere in the region of 2 – 01.

In the run up to the final Kerry’s Big3 (Clifford, Geaney & O’Brien) had combined for 51% of their attempts from play with an excellent Conversion Rate of 69%. Here they were again to the fore with 48% (11 of 23) of all of Kerry’s shots from play but their radar was well off scoring just 0 – 03 from those 11 shots. And one of those points was an attempt at goal that went over. Given the shots attempted Kerry left 1 – 00/0 – 03 behind them from these three alone.

Luckily (though in truth luck has little to do with it) for Kerry the rest of the team stood up scoring 1 – 06 from 12 attempts (58%; Expt Pts of +2.19). This was in line with what we had seen in the run up – 52% & +4.0 Expt Pts – and should give Kerry confidence that they can keep the scoreboard ticking over

Aside from the raw numbers perhaps the most impressive element was that these “secondary” shooters attempted Kerry’s final six shots producing 1- 04 from the 55th minute onwards. When the pressure was on the shooters outside the Big3 stood up.

Another man who stood up was Séan O’Shea. Whilst Rock had the headline figure of 0 – 10 his deadballs were, as noted above, average. O’Shea converted all seven of his deadballs including three 45s. We are more certain on the Expt Pts for deadballs than from play and O’Shea returned 0 – 02 more from his seven attempts than the average free taker would score. And that is without overlaying the situational position he found himself in “needing” to keep the scoreboard ticking over just to keep Kerry within range.

Kickouts

Despite the fact that the possession regains were relatively even, at 25 v 23, Dublin are still the Kings of the restart. Getting their hands on the ball is only part of their strength – what they do with these restarts is their real weapon. Here they scored 1 – 10 from the 25 kickouts won, or 0.52 points per possession (ppp). Kerry scored 0 – 08 or 0.35ppp

(slight change in language here. Normally we use the phrase “won” the kickout but we’re using “possession regain” instead as won indicates a positive intervention from the keeper or outfield players. Sometimes teams just get lucky when they “win” a kickout)

In the preview it was predicted that kickouts out past the 45 would break even. And so it was with both teams getting their hands on 12 apiece (Dublin won 8 of their 13 that went past the 45; Kerry were 7 of 11 on theirs). The fear for Kerry was their short ones. They had lost seven in the run up to the final and Dublin were primed to pounce getting their hands on 7% of the opposition’s short ones and scoring off each one.

Kerry did give up two short ones. And Dublin did score off both. But both had gone over the sideline and whilst the two quick points hurt it was not calamitous.

Cluxton gave up his first short one of the year. Tommy Walsh intercepted one out to Cluxton’s left and whilst he composed himself to take a shot off same it was a poor effort. If Dublin give you an easy one, whether it is the 1st minute or the 71st, you have to take it.

(disc = kickout team won, X = kickout team lost; black = 1st half, white = 2nd half)

Looking at the kickout chart Ryan did not shirk from the difficult ones … but those “mid mid” kickouts just around the 45 are lethal. Kerry won all four but you have to imagine that Dublin will be looking to pounce on these come the replay. Compare where those four are compared to where Cluxton puts them when he goes past the 45

All Ireland preview; – 3 key areas (Examiner)

September 12, 2019

The below article was originally published in the Irish Examiner on August 31st (the day before the game)

Dublin’s Goal threat

From 2015 – 2018 teams have had a shot at goal once every 18.5 possessions. Dublin have averaged 13.5 in the same timeframe including once every 11.6 possessions in both the 2017 and 2018 campaigns.
In their three competitive games (ignoring the reserve’s run out up in Omagh) this year, from the Super8s onwards, they have recorded 20 goal attempts; 8 vs Cork, 5 vs Roscommon and 7 vs Mayo. That equates to one goal attempt every 8.2 possessions.

That big a jump in one year represents a clear change in strategy.

The catalyst for this change? Con O’Callaghan. He has been directly involved in 60% of these goal chances (6x shots and another 6 assists in the build-up). Not unconnected is the fact that Dublin have earned 0 – 06 from Rock frees after O’Callaghan was fouled. His ability to hold the ball up also enables Dublin’s marauding midfield duo to join the fray. Fenton & MacAuley have combined for 4 – 01 from five attempts.

Can Kerry contain this goal threat? They will have to. First impressions matter and our first Championship glimpse of this Peter Keane led Kerry team was that of Cork ripping the back line asunder for goal chance after goal chance in the Munster final.

There is hope, however. In the four games since then Kerry have allowed just nine shots at goal – or one every 23 possessions. That is immensely frugal and counter to the general view held of this Kerry backline.

If Dublin get their seven shots at goal, then Kerry will concede in the region of 3 – 02. If the Kerry defence can maintain their current form, they will allow two shots at goal conceding 1 – 00/0 – 02.
Incredibly small differentials – but it is in these margins that All Ireland finals are won.

The Big3

Both teams have a Big3 up front. For Dublin they are O’Callaghan, Mannion & Kilkenny. Kerry’s are Geaney, Clifford & O’Brien. Both sets are producing incredibly accurate displays – whichever trio prevails on Sunday will go a long way to deciding the outcome.

In the aforementioned three games Dublin’s Big3 have accounted for 45% (33 of 74) of all their attempts from play combining for an exceptional Conversion Rate of 70% (3 – 20 from the 33 shots). The average intercounty Conversion Rate for shots from play is 48%.

A quick word on Mannion. Over the years Dublin have had an obvious target of moving their shots in closer to goal. Every Dublin player’s shot map will be much tighter in 2019 when compared to 2016. Except for Mannion. He is their designated “outside” shooter (if such a thing exists). And he is fulfilling that role to perfection. In the three games under review he is 81% (0 – 09 from 11) on point attempts and 0 – 05 from 6 on the wider, longer attempts. If Kerry do drop to protect the goal, they cannot allow Mannion to pick them off from long range.

What of Kerry’s Big3? They are even more central to Kerry’s game plan being responsible for 51% (49 of 97) of Kerry’s attempts from play. This despite Clifford missing the Meath game and O’Brien running into black card trouble. Combined they are running at a barely creditable 76% (3 – 34 from 49).

The fear from a Kerry perspective is just how reliant they are on these three. If Dublin shut them down the back up is O’Shea, the two Spillanes, Moran, Murphy, Tom O’Sullivan. All capable but not “shooters” of the quality to replace the output of the Big3. The rest of the panel have produced a Conversion Rate of 50%. Dublin’s Conversion Rate outside the Big3 is 61%.

Kickouts

It is impossible to preview a big game without considering primary possession. And thus kickouts. Kickouts account for 52.7% of all possessions. To win the game you must have the ball. To have enough ball you must get your hands on kickouts.

There has been quite a bit of commentary on Dublin’s high press and the pressure it applies to the opposition’s goalkeepers. And it absolutely does. But in terms of kickouts retained the raw numbers have Dublin winning 31% of the opposition’s kickouts and 43% of those that travelled past the 45. Kerry have also won 43% of the opposition’s kickouts that travelled past the 45. So, whilst the Dublin press is exceptional it hasn’t produced the volume of raw possessions, in direct comparison to Kerry’s returns, that might be expected.

Dublin do have a distinct advantage in one area; short kickouts. Dublin have not lost possession off a Cluxton short one this year. In big games since 2017 (QF onwards) Cluxton has coughed up just 3 out of 162 short kickouts. Yes, teams drop off. And yes, Dublin possess a wonderful group of ball handlers at the back. But Dublin also have Cluxton. He always has been, and continues to be, the master of the quick restart. And, crucially, he doesn’t overcommit. There are no absolutes, but the numbers suggest he has learned not to press the short one.

Contrast that with Ryan. He is still on a steep learning curve in his maiden campaign. Kerry have gone short 60% of the time but have lost possession seven times. That includes three in one vs Donegal. Dublin have gotten their hands on three of the opposition’s short ones scoring off each (1 – 02). Ryan will come under immense pressure on Sunday. The default, when the pressure comes, must be long.

2019 All Ireland Preview

August 28, 2019

As in previous years we will do a preview of this year’s All Ireland final by reviewing previous games within the year.

The methodology is roughly the same. We have four competitive games for Kerry under Peter Keane – the three Super8 games against Mayo, Donegal and Meath plus the semi-final against Tyrone. We have a lot more for this Dublin team but so as to ensure like for like comparisons I have used Dublin’s semi-final against Mayo, the two competitive Super8 games against Cork and Roscommon (no sniggering down the back) and I have replaced the run out for the reserves up in Omagh with their Leinster semi-final v Kildare (see NOTE1).

When team or player numbers are referenced, they will relate to these eight games unless specifically stated otherwise.

The commentary has a “this is what Dublin do – how do Kerry measure up/defeat them” slant to it. This is the nature of the beast when you are going for 5 in a row.

Possession – the unseen edge

I reference “the unseen edge” above because in the previous four Championship campaigns every three possessions you gather is worth 0 – 01 on the scoreboard (teams scored 0.37 points per possession (ppp)).

In their four games under scrutiny Dublin managed to get their hands on the ball 27 times more often than their direct opponents. The differences ranged from 3 more possessions against Cork (in a game with 81 total possessions) to 11 more against Roscommon (in a game with 91 possessions). If they maintain this in the final it is akin to starting 0 – 02 up.

The makeup of their possessions is interesting. Given their dominant nature (NOTE2) in these games Dublin have had 20 less possessions directly from their own kickout despite having a much higher retention rate; Dublin have retained 81.5% of all their kickouts whilst the opposition retained 70.5%.

How have they made up the deficit then if they are starting from -20 on their own kickout? One area is the aforementioned retention rates on kickouts – Dublin have gotten their hands on 36 opposition kickouts whilst only giving up 15 of their own. Thus, on kickouts in their entirety Dublin are one possession up. We’ll go onto the details later but here is where the mere fact of counting can set you wrong. Yes, their opponents have essentially broken even on kickouts against them – which is surprising given Dublin’s perceived dominance. But it is the type and ratio of kickout that is won/lost that is of vital importance.

The remainder of Dublin’s possession edge is gained on turnovers (+22) and Other (NOTE3) (+4). Dublin’s turnover differential is nearly all achieved inside their own 45. On turnovers outside their own 45, which would be deemed as the most dangerous as the opposition is caught in an attacking mindset, they are only +2 (gained 20 turnovers outside their own 45 but gave up 18 such turnovers to the opposition).

It is somewhat surprising that they gave up the ball 18 times outside the opposition’s 45. Digging a bit deeper Mayo did the damage getting their hands on such ball ten times. The other eight were split evenly (Kildare x3, Cork x3 & Roscommon x2); so, it appears to be just small sample size noise.

What of Kerry?

Unlike Dublin their games have been closer which means that they have, proportionally, taken more of the kickouts (45% in total; Dublin have taken 40%). On the surface this should help Kerry in the possession battle. But Kerry have not been as clinical in their execution either on their own kickout (Retention Rate of 77%) or the oppositions (opposing teams have retained 80%). This in turn means that whilst Dublin came out with a possession total of +1 from all kickouts Kerry come out with a -20.

The good news is that they were aligned with Dublin in pure turnover terms (+19; 89 turnovers won in the four games v 70 conceded) however were slightly ahead of Dublin in where those turnovers were won. 28 were won outside their own 45 with 19 such turnovers conceded.

Revisiting that small sample size noise from the Dublin numbers. What if Mayo’s press identified a small chink? Mayo claimed ten (five of which occurred in the first half when the game was there to be won) turnovers outside their own 45. Kerry, with the oft quoted Donie Buckley link, are not only good here but have obviously worked on what they do when they win such ball. Of the 28 turnovers up the pitch they have produced 21 shots and scored 2 – 13. Of the 21 shots 14 had six or less player touches … they look to strike hard and fast off the turnover.

But for all their good work on turnovers that kickout number of -20 is very concerning. Especially when you consider that they will be up against (a) the best kickout press in the game and (b) the team with historically the best kickout in the game. More of that anon.

When Dublin have the ball

Once Dublin get their hands on the ball what do they do with it? The simple answer is they score. The 10-84 they amassed in the four games equates to 0.58ppp. As stated previously the average for games from 2015 – 2018 was 0.37ppp (NOTE4). And the scary thing is that they are actually getting better.

Last year’s preview touched on a lot of the themes as to how Dublin had increased their Conversion Rate. It is worth re-reading now as a lot of the principles still hold through.

Goals

Dublin are the goal Kings. From 2015 – 2018 inclusive (non-Dublin) teams went for goal every 17.8 possessions. As the above table shows Dublin have, apart from the blip in 2016, gone for goal at a much more frequent clip. But they have been relatively consistent on this going for goal every c11.5 possessions. In 2019 they have obliterated this mark going for goal once every c8.2 possessions. That is a huge change in emphasis.

It is worth noting that they have not been more efficient when going for goals (NOTE5). But they don’t need to be. They are coming away with 1.50 points per goal attempt which is better than can be achieved than going for points. Con O’Callaghan has been the catalyst here with six shots himself but also being directly involved (NOTE6) in the build up to another seven attempts (3x primary assists & 4x secondary assists).

You want to stop Dublin going for goals – nail down O’Callaghan. That’s not to say he’s the only threat. The two midfielders (Fenton & MacAuley) have combined for another six attempts getting a score from each attempt (4 – 02). Only Mannion, of the main strikers, has not been productive scoring 0 – 01 from his three attempts.

To increase your points per possessions you don’t necessarily need to get better at any one thing – if you tweak the ratios to go for the more productive shot more often then you’ll increase your returns.

Point attempts from play

That tweaking of shot types, to eke out more efficiency, leads us to Dublin’s point taking. The below shot chart is taken from 2016 and contains Dublin’s point attempts for the four games from the QF onwards

Every team will have a different shooting zone (as an example I used a completely different zone when previewing last year’s final). For illustrative purposes I use the red dotted line to denote “inside” and “outside”. I’m sure internally Dublin’s is different, but we can work with this. In 2016
• Dublin had an overall Conversion Rate of 45%
• 21% of all their point attempts came from “inside”
• They produced a 76% Conversion Rate “inside” and 37% “outside”

Now let us look at the same chart for 2019

Even visually you can see the change – the “inside” is so much more populated. There are no shots inside the 20m line from out wide. But to put some comparative meat on the bone
• Dublin now have a 62% Conversion Rate
• 46% of all their point attempts were from “inside”
• They have recorded a 74% Conversion Rate “inside” and 52% “outside”

Want to improve your points per possession? Go for goals, which are more productive per shot, more often whilst maintaining the Conversion Rate. Move more point attempts “inside”, again maintaining the consistency whilst also improving your “outside” shooting.

Kerry have their big three in Geaney, Clifford & O’Brien. For Dublin this year it has been Mannion, O’Callaghan & Kilkenny. Between them they have taken 49% of their point attempts with a whopping combined Conversion Rate of 71% (0 – 30 from 42; Expt Pts of +10.15). That is amazing consistency.

Con O’Callaghan again shows up well on the point taking tables with a 70% Conversion Rate (0 – 07 from 10; Expt Pts +1.82) and 11 primary assists. Combined with his involvement with the goals and he has become a central cog in what Dublin do.

But Paul Mannion has topped him in terms of accuracy with a Conversion Rate of 76% off a whopping 21 point attempts. That despite him being Dublin’s ostensible outside shooter.

Elsewhere Niall Scully has been the assist machine being directly involved in the build up to 25 point attempts and six goal attempts

Deadballs

And just to top it all off introduce a red hot Dean Rock during the Super8s. He is 95% (0-20 from 21) on deadballs with his only miss being deep in injury time against Mayo out wide left just to kill the clock.

On Rock. In the lead up (QFs, Super8 & SFs) to the AI final in the last three years he has been imperious recording a 92% conversion rate (0 – 36 from 39) on frees with an Expt Pts tally of +4.81. He has dropped off in the finals however returning just a 73% Conversion Rate with an Expt Pt of -0.20.

He is the best free taker bar none. He has shown his metal in 2017 when slotting the winning point deep into injury time. But he is human and has shown it previously when we enter the finals.

What of the Kerry defence?

Have we seen anything from Kerry to show that they can disrupt this process?

In the four games under scrutiny they have only allowed eight shots at goal including two penalties. That is an excellently frugal one attempt every c23 opposition possessions. If Kerry can keep Dublin to their pre 2019 standards of 1 goal attempt per every 11.5 possessions that should see Dublin at 4 shots at goal (assuming a c90 possession game). Meet somewhere in the middle of the 8.2 attempts from Dublin and 23.2 allowed by Kerry and you are at three attempts. Using Dublin’s conversation rates 3 attempts comes in at 1 – 01; four attempts and you are at 2 – 00. Any more than that and Kerry are staring down the barrel of a defeat.

Dublin have attempted 23 point attempts from frees or one every 8.6 possessions. Kerry have allowed the opposition to take 24 shots, or one every 7.7 possessions, at goal from frees. These 24 included three from outside the 45 (2x M Murphy, 1x C O’Connor). Whilst Rock is capable of slotting these over he knows his range and generally doesn’t take them from out there. Removing these three longer ones reduces the rate to one every 8.8.

All other things being equal you want to avoid giving Dublin, and Rock these easy points. Foley, Murphy & Crowley will need to be cognoscente of their tackling as they have given away four shots at goal, from fouling, apiece. On top of that O’Callaghan is the most fouled player for Dublin (he’s won 6 shots at goal from frees – the next best is 2).

Stop Dublin going for goal. Especially O’Callaghan. But don’t foul him. No problem!

That leaves us with Kerry defending point attempts. At a macro level this has been very poor this year. Opponents have converted 66% (0 – 45 from 68) of all point attempts from play scoring in excess of 0 – 11 more than what those 68 shots would be expected to record.

However, when we look at the shot graph for these 68 point attempts what is striking is just how good teams have been from “outside”. Between them Kerry’s four opponents have combined for a whopping 62% (0 – 24 from 39) Conversion Rate “outside” which, for context, is miles ahead of Dublin’s 52%. And I can find no good reason for it other than Kerry have been on the wrong end of some excellent shooting. Will this continue in the final? Anything is possible in a one-off game against Dublin. But what it does indicate is that the Kerry defence has not been as poor – or porous – as the final scoreboard(s) indicate.

You can begin to see the bones of an argument as to why Kerry’s defence can hold Dublin. Restrict Dublin to four goal attempts (Dublin have averaged six, Kerry have given up two) with them scoring 2 – 00. A point attempt from a free every 8/9 possessions should yield Dublin 0 – 04 to 0 – 05. Give them the “inside”/”outside” ratio that they have enjoyed to date but restrict them to 19 shots (Dublin have averaged 21.5; Kerry have allowed a lower). That equates to 0 – 11 from play. You are now at 2 – 15 … possibly 1 – 16. And assuming your attack shows up you are in the game for 80 minutes.

When Kerry have the ball

So what of Kerry? Whilst not as stellar as Dublin their attacking returns have been very positive

If we assume 50 possessions each then just using the baseline metrics above Dublin come away with 24.4 scores (50*83%*84%*70%) whilst Kerry come away with 21.9 (50*83%*80%*66%). Using the points per possession its Dublin 29 points and Kerry 25 points. That’s not to say that this is how the game will end (that calculation is as rough as a badger’s a*se) but it does show that the Kerry forward line are not a million miles behind perhaps the most accurate front line of all time.

Their goal attempts – perhaps surprising given an inside line that consists of Geaney and Clifford with O’Brien on the burst from the half forward line – has been an issue, however. Not so much the execution but the volume. They have only managed nine attempts at goal over the four games which contrasts starkly with Dublin’s 24. Again, their Conversion Rate is very good (56% Conversion Rate and 1.89 points per attempt) but the volume just isn’t there. Playing it safe when in front of goal? You feel this is something that Kerry will have to up in the final. Either they have to take the two chances they get, or they have to go for goal more often and come away with 2 – 00 from four attempts rather than 1 – 01 from two goal attempts and two point attempts.

Whilst not quite in the Dean Rock mould Séan O’Shea has been very good on deadballs returning 83% (0 – 20 from 24) and scoring about 1.5points above what would be expected from his attempts. Very solid. Just like Rock he will have to prove he can do it in the white heat of an All-Ireland final.

Kerry’s point taking has been a smidgen off Dublin’s with a combined 59% (0 – 52 from 88). That is still excellent returning about 8.5 points above what was expected. But that could be even better if they were more careful on their “inside” shooting.

They’re “outside” shooting at 56% (0 – 29 from 52) is better than Dublin’s – which, as we have noted, has taken a huge leap from where they were at in 2016. It is their “inside” shooting at 59% (0 – 23 from 39) that is hurting them. It is almost as if the mind wanders when they get inside thinking the job is down. They have the outside shooting to compete with Dublin – they need to pop those easier points or alternatively turn some of those closer in shots to less secure goal attempts.

Kerry’s big three (Geaney, Clifford & Stephen O’Brien) returns are eerily similar to Dublin’s big3 attempting 49% of all of their point attempts for a combined Conversion Rate of 70% (0 – 30 from 43; Expt Pts +9.01).

Like Mannion O’Brien has been on fire with a 90% Conversion Rate (0 – 09 from 10 Expt Pts of +3.62) whilst he has been very high up on the assist chart with 16 primary assists (1x goal attempt, 9x point attempt and 6 frees won).

Dublin’s defence

Dublin have only allowed nine goal attempts in the four games tightening as they’ve gone along (3 v Kildare and Cork, 2 v Roscommon and 1 v Mayo). Stephen Cluxton has again shown just how good he is by producing five saves from those nine shots with the only ones getting past him being an outrageous piece of skill from Lee Keegan and a penalty from Luke Connolly.

Dublin have only coughed up 13 shots from frees (John Small x3, MD MacAuley, B Fenton, C O’Sullivan with two apiece) in the four games which equates to one every 13.1 possessions.

On point attempts they have allowed more or less what is expected; 20 per game with a 51% Conversion Rate allowing an Expt Pts of +0.94

All very simple and concise compared to the in-depth detail above. But only because Dublin, like on offence, do the basics very, very well. Don’t offer up the goal attempts. When tackling do so properly – or at least if you need to foul don’t do so inside the scoring zone. Only give up what is expected from point attempts.

For Kerry’s attack let us assume things stay as they are. The Dublin defence do their thing whilst the Kerry offence does theirs. Kerry will get two goal attempts (Dublin have allowed nine in four games; Kerry have attempted nine) resulting in 1 – 00. Kerry win five shots at goal from frees (somewhere between the one every 7.5 possessions that they earned, and the one every 13 possessions Dublin have allowed) scoring 0 – 04. Kerry take 21 shots from play (Kerry have average 22 point attempts whilst Dublin have allowed 20) with a Conversion Rate somewhere in the mid 50s which comes in at 0 – 11/0 – 12.

All things being equal Kerry score 1 – 15/1 – 16. Their defence stands up as previously outlined allowing 2 – 15/1 – 16. Just saying ….

Kickouts

Attempting to show how Kerry can stay in, and even win, the game is conditional on a lot of things, plausibly, going their way. Contain Dublin to four attempts at goal. Foul at a “normal” rate. Allow point attempts at a slower rate than Dublin have taken to date. Up either the goal attempt volumes or the accuracy. Outside shooting efficiency against them to regress to the mean. Maintain their high attacking efficiency.

But that is all superseded by one larger condition that also needs to break Kerry’s way. We touched on it earlier when looking at the possession volumes – Kerry absolutely need to break even in terms of possession volumes on kickouts. [A gentle reminder that they were -20 on kickout possessions compared to Dublin’s +1. Despite having more kickouts in games than Dublin]

Dublin kickouts

The kickout details for both teams are in the Appendix. Unsurprisingly Dublin have not lost a short one. I say unsurprisingly as in the eight games that comprised the QFs onwards in 2017 and 2018 Dublin lost just three short kickouts – a combined retention rate of 97.5% (retained 118 of 121).

If they get their hands on one of your short ones lookout – they got one each against Cork, Roscommon and Mayo scoring off all three. Those three equated to 7% (3 of 46) of all short kickouts faced. This success rate is a step up on previous. In the aforementioned eight games in 2017 & 2018 they got their hands on 5% of the opposition’s short ones (6 out of 103) but only came away with 0 – 02.

In the four games there have been 116 kickouts past the 45 with Dublin gaining possession 50% of the time. That may seem poor enough, but they were 63% on their own kickout and 43% on the opposition’s. Dublin may have a fearsome press, but the opposition have been getting their hands on the ball

Kerry kickouts

Intriguingly enough Kerry have also won 50% (40 of 80) of kickouts that went past the 45. They had similar splits to Dublin in that they won 58% of their own kickouts and 43% of the opposition’s.

The problem, and the fear, is that they have lost seven short ones in the four games played. Seven. Compared to Dublin’s zero. And not in any one game where they had a systems malfunction either. They have lost at least one short kickout in every game. Indeed, they lost two vs Tyrone and three vs Donegal.

As stated at the very start I was worried for Kerry winning primary possession on kickouts. I still am but if they can force the majority to go past the 45, they can break even. But if they continue to press the shorter ones (60% of their kickouts have been short) then they have a propensity to cough up the ball which will be calamitous against this Dublin team.

Prediction

I have faith in the Kerry brains trust. Although under different management they came with a plan against both the Dublin kickout in 2016 and the Donegal kickout in 2014. I believe they will lose the possession battle here by two or three, as Dublin get a few short ones off quickly, but they will avoid any obvious calamitous errors.

They will break even in terms of turnovers. The game will be a relatively open 92 possession game (Dublin games averaged 91.75 possessions; Kerry’s 93.5) with Dublin winning that battle 47 – 45. Then the fun starts. On current point per possession trajectories that has Dublin at 27 points (47 possessions x 0.58). I don’t see that – as outlined I can see the Kerry defence being stouter than anticipated. If it “drops” (drops is a relative term here!) to the 2018 level of 0.52ppp that brings them into the 2 – 18/2 – 19 realm. To get down to the projected score I have for Kerry of 1 – 16 then Dublin’s ppp needs to drop to 0.40. Which I just can’t see.

Kerry to be closer than people think but Dublin to win 2 – 17 to 1 – 16

NOTE1 By right I should have used the Leinster final v Meath as a more “competitive” game however Meath’s shooting was so poor that it would affect the overall averages. Plus Kildare went in at half time only four down, so it was competitive enough to spark the familiar second half surge from Dublin.
NOTE2 Dublin’s opponents tend to have more kickouts due to the sheer volume of shots Dublin take. You retain your own kickout at a much higher rate therefore if the opposition has a lot more kickouts they should have a higher volume of possessions from same
NOTE3 Other is defined as Throw Ins at the start of halves or shots blocked, off the post etc. regained by the attacking team
NOTE4 Remove Dublin’s returns from the equation and that drops to 0.36ppp
NOTE5 Dublin can have a higher points per attempt in 2019 compared to 2018 with a lower Conversion Rate as points scored off goal attempts are not included in the Conversion Rates but are in the points per calculation
NOTE6 Assists here are still defined by being on the ball – actual passes. Runs off the ball are probably as important – especially for goal attempts – but we’re not quite there yet.

APPENDIX
Dublin kickout data

Kerry kickout data

Comparison of League & Championship returns

January 20, 2019

Comparing league and Championship

I have only ever used Championship games when creating specific averages or metrics. In the main this was due to laziness on my part as I wasn’t really tracking League games but there was also a part of me that viewed League & Championship as sufficiently different to be treated individually. Separate entities. Different games on different pitches in different weather.

But then I got notions and tracked the 2018 league. Was the league data sufficiently similar to that of recent Championships allowing us to augment existing datasets and produce more robust outcomes? Or did the “gut feeling” that the two should be kept separate stand up to even the most rudimentary of reviews?

In the end 22 League, and 32 Championship, games were tagged (a fancy way of saying “noted a lot of different things within a game”) throughout the year. A nice, healthy, robust possession count of just under 5,000.

Given the size of the dataset, and the fact that the games reviewed were within the same calendar year, any differences should really be due to the competition, and its peculiarities, rather than any observed changes in styles throughout the years. (And as a nice aside we’ll also have a clean, comparable, dataset to test the effects, if there are any, of the new rules being introduced in 2019).

Game flow

At the outset it became obvious, despite the best intentions of curtailing the review to one season, that we were not comparing apples with apples. Within the 32 Championship games there were quite a few where the disparity between the two teams’ quality was very evident (somewhat expanded upon here). So the 2018 Championship returns were subdivided further into (a) all Championship games and (b) those games between Division1 teams only (Dublin, Tyrone, Galway, Monaghan, Donegal, Kerry, Kildare & Mayo) of which we had a healthy number – 15 in total – thanks to the introduction of the Super8s.

And we have our first surprise. There were as many possessions per game in the league as there were in the Championship; and the differences between the two Championship subdivisions were small enough to be deemed immaterial. I say “surprise” as, based on nothing more than intuition, I fully expected there to be more possessions during the League as a result of increased turnovers through weather, heavy pitches and teams not being quite at their peak.

Now there were more turnovers during the league – five a game – but this was counter balanced by how teams used the ball. There is an appreciable step up in attacking production across the Championship with higher Attack and Shot Rates. Both these then lead to noticeably more shots (~8.5%) per game. More shots equal more kickouts.

Those turnover possessions “lost” from the League to the Championship were regained through extra kickouts resulting in the immaterial movement in the total number of possessions.

Kickouts

Viewing kickouts in isolation that point is further evidenced; kickouts account for 49% of all possessions in the League but 54% in the Championship.

Teams were much more on point on kickouts throughout the Championship retaining possession at a much higher rate than they did during the League (77% v 70%).Teams won more short ones (95% v 91% during the league) as well as more of the longer ones (61% v 56% during the league).

One of the contributing factors here could be the well-worn training cycle within GAA where teams work on kickout routines coming into the Championship as the winter months are used to lay down a fitness block.

Interestingly this is the first time we see a break in how the two Championship subdivisions perform. During the league the kickout team won 56% of their own kickouts that went past the 45; this stepped up to 61% in the Championship and again to 66% when we segment just the Div1 teams.

A jump in retention rates from 56% to 65% on kickouts past the 45 is quite noticeable – especially on those kickouts that should be the most contestable. The teams, and the quality of the opponent, haven’t changed. Instead teams have just improved.

This stepped increase in retention rates, both from league to Championship and within the Championship subdivisions, lends credence to the above supposition that teams “work on” their kickouts more in the lead up to Championship than they do in the League with the better teams, i.e. Div1, being more successful at implementing their plans.

Shooting

As noted above there are more shots attempted during the Championship. But that alone does not account for the higher scoring rates observed during the summer. Teams are more efficient with that extra shooting. And not just in one particular phase but across all three – point attempts, both from play and deadballs, as well as goal attempts.

Point attempt Conversion Rates (from play) during the League were lower than those in the Championship. But not massively so. They are probably within any margin of error so further work is required to confirm if this a League v Championship, early season v late season, bad weather and heavy pitches v good weather and “proper” pitches thing or just one season noise.

Deadball returns have improved the last two Championships (2018 – 74.0%, 2017 – 73.5%, 2016 – 69.0%, 2015 – 68.9%) so the 72.2% achieved within the 2018 League feels like a lag. Again though it is within any margin of error so it is probably wise to err on the side of caution and say that the differences are inconclusive.

Goal shots are probably the most eye catching numbers with just 32% of shots converted during the League and 39% during the Championship. Again those Championship games involving the Div1 teams saw another slight bump to 41%. The volume of goal attempts in those Championship games was less at 4.2 per game (as against 4.7 during the league) yet they were converted at a much higher rate. Why? More work done on finishing moves? Random one year fluctuations on small sample sizes? Effect of must win games in the Championship ensuring players take points off less clear cut chances? That most unsatisfactory of answers … to be determined.

Instinctively the Conversion Rates for all three elements, deadballs, point attempts and goal attempts, being lower in the League feels right. As stated I have never been a fan of mixing data from the two competitions and whilst the disparities are probably small enough for some the differences just reinforce my original belief that, without further analysis, we shouldn’t just lump the two competitions together to get bigger volumes.

So there you have it. At a macro level League games are similar to Championship games with the same number of possessions and comparable Conversion Rates. But get under the hood and the makeup of each component differs just enough to warrant (for me anyway) keeping all metrics for the two separate.

One final quick note

Defence

Unfortunately there are no great defensive metrics per se. The sign of a good defensive performance is usually evidenced by the absence of good offensive metrics for the opposition. But that doesn’t really work here when we are looking at averages in the round as everything just becomes an aggregate blob with no real decipherable differences.

Some specific defensive metrics we can look at are turnover rates (though the assumption that all turnovers are induced by the defence doesn’t hold much water), how often teams get in for an attempt at goal and the pressure faced by teams when shooting.

Focussing on the Div1 teams we can see a tightening up on the defensive front with a ~10% increase, from the league to the Championship, in the number of shots taken under strong pressure. There is also a ~10% increase in the number of possessions it takes to get a shot on goal.

As well as getting more clinical on their use of possessions and kickouts the Div1 teams also tightened up defensively (balanced by more efficient shooting). Everything trends towards the Championship just being that step ahead of the League. Sometimes what you see really is what you get.

Dublin v Tyrone 2018 All Ireland Final

September 6, 2018

This may seem like a ridiculous statement when reviewing a game in which the four time Champions won by six points but Dublin were just better. We’ll go into the various components below but they had more primary possession, more shots and better accuracy on those shots.

More ball plus more efficiency in using that ball equates to a relatively straightforward win.

When Dublin had the ball

What makes the margin of victory more impressive was the hole that Dublin had dug for themselves. After 16 minutes they were 12 – 9 behind on the possession count, 10 – 7 behind on the shot count and four points behind on the scoreboard. They were losing the primary possession battle and returning a hitherto fore unseen 14% (0-01 from 7) Conversion Rate. This also included Dean Rock missing two frees. The same Rock who recorded an 83% (0-25 from 30; Expt Pts of +3.15) Conversion Rate on frees in All Ireland finals and semi-finals in 2016 and 2017. It is lost in the talk of five in a row but that was a dreadful start reminiscent of their start against Mayo in 2016.

Of course combining the end result with that terrible start (and it was terrible) means that when Dublin removed the handbrake post the 15th minute they then proceeded to destroy Tyrone in the following 65 minutes winning the possession battle 41 – 32, producing five (25 to 20) more shots and returning a Conversion Rate of 72% (Expt Pts + 5.24 and a points per possession of 0.54). Utterly devastating. The below time sequence chart shows the gap, in terms of score and Expt Pts, just widening from that first goal.

The controlled nature of the second half display (0–10 from 14 (71%) and winning all 16 kickouts) is very reminiscent of the 2017 final when they went 0-12 from 16 attempts (Conversion Rate of 75%) and secured all 11 kickouts. Something similar was in effect in the semi-final against Galway (time series chart in the Appendix). Had Galway taken their chances at even an average rate they would have been with Dublin well into the second half – but still Dublin powered away with excellent second half shooting.

So how did Dublin do it?

First and foremost they converted their goal chances. They had three shots at goal returning 2-00. Even when Morgan saved Costello’s attempt Rock popped up with the subsequent 45.

Speaking of Rock he had a sterling day scoring 0 – 07 from 9 including 0 – 03 from 3 from play (Expt Pts of +1.33). That is even better than the bare numbers when we consider that his three points from play came in the first half after missing those aforementioned early frees. Ciarán Kilkenny clipped over 0-03 from 5 (Expt Pts of +0.69) whilst Brian Fenton popped over his two attempts.

The Dublin shot chart is in the Appendix. The shooting wasn’t as tight as was highlighted in the preview (only 9 of the 23, or 39%, were from the artificially created central channel) but it was tight enough with next to no wild attempts. Whilst Tyrone have to be given credit for keeping Dublin outside of this central channel it is an indication of Dublin’s clinical nature that of the 14 point attempts from “outside” they converted 57% (0-08 from 14)

Not only did Fenton score 0-02 but he was also very active in the attack with four primary assists. These assists are probably more a testament to his conditioning, and relative cool, as three of them came in injury time at the end of the second half. The epitome of this Dublin team – the right option executed properly when under the twin pressures of fatigue and an opponent attempting to manufacture a comeback.

Having said all that the unsung hero for Dublin was Con O’Callaghan. He was the primary assist for seven separate shots including for Scully’s goal and winning three of Dublin’s five frees all in the first half when the game was there for the taking.

When Tyrone had the ball

In the preview it was highlighted that whilst, in the run up to the final, Tyrone’s Conversion Rates were on a par with Dublin there were reasons to believe that theirs was a false position being propped up by an unsustainable outing against Roscommon. And so it proved.

Tyrone scored 1 – 14 from attempts that the average intercounty team would return 17.22pts. The fact that every team doesn’t face Dublin when those averages are being compiled gives Tyrone some leeway – so let’s say they returned in and around what was expected. Tyrone did not lose because of their wides or due to any perceived inefficiency. Their Conversion Rate, excluding the Roscommon game, coming into the final was 52%. Their average from ’15 – ’17 was 52%. They shot 50%. It was always going to be thus.

Tyrone lost because they didn’t produce enough shots (or alternatively reduce Dublin’s volume of shots) knowing they would be up against the most efficient team we have ever seen. Or as stated in the very first sentence because Dublin are just better.

How Tyrone compiled their returns is slightly at odds with how we would expect. We knew coming in to the game that despite having four goal attempts in the recent Super8 contests against Roscommon and Dublin they were struggling to create chances. They had only manufactured three goal attempts in their three previous games against Dublin. Now we can make it four in four with two of those being penalties. They did maintain their recent fine record of converting goal chances. In the five games from the Super8 onwards they have had 10 attempts at goal scoring 8-01. That’s a phenomenal return (the average over the years has been creeping up to about 40%) but is it indicative of a too cautious approach at an average of 2.0 a game? Only taking the shot when it is absolutely on? Dublin were 4.0 a game in the same period.

Frees were an issue coming into the game (averaging out in the mid 60% range) though given Dublin’s defensive discipline there was the possibility it wouldn’t be an issue. Dublin did maintain their discipline (again only offering up five shots at goal from frees with only two in the first half) but Tyrone were excellent here converting all five using the rota of Harte, McAliskey & Lee Brennan.

So six shots at goal from frees and deadballs returning 1-05 (Dublin were 2 – 04 from 10). What let Tyrone down was their point taking. At a macro level they were 38% (0 – 09 from 24) with an Expt Pts of -1.92. Dublin ended up with 57% (0-13 from 23; Expt Pts of +1.88) despite their very poor opening.

Their two strike forwards of Bradley & McAliskey were good combining for 80% (0-04 from 5) with an Expt Pts of +1.79. Of course that means everyone else was very, very poor combining for 26% (0-05 from 19; Expt Pts of -3.44). That’s just not going to work against Dublin.

In the preview we highlighted how Tyrone’s shot location was hampering them. Here Tyrone had some poor efforts (three shots in a knot at the 20m line out by the right sideline) but overall 45% of their point attempts came from the aforementioned central channel. Right place but just poor execution; think of Lee Brennan’s snapped shot wide with his right @ 67:40, Cathal McShane @ 52:29 with his left about 16m out directly in front of the goals

Tyrone will have regrets, and thus something to build on, as their shooting was an absolute mixed back. At a macro level their accuracy was not a problem – they hit the average. But unlike previous form their free taking held up so their accuracy from point taking was an issue. But even therein their strike forwards were accurate – everyone else was very poor.

Tyrone’s shot location was another mixed bag – more shots from central locations should have helped the Conversion Rate but they had some very poor attempts from “inside” mixed in with some absolute haymakers from out wide.

Kickouts

In all the above what we have yet to touch on is just exactly how Dublin built up +6 on the possession count. And it is quite different than a “normal” Championship game.

Tyrone won the turnover battle quite comprehensively 23 – 13 which in and of itself is striking. So how do you lose a game by six points if you gain 10 more possessions from turnovers? By getting cleaned out on kickouts.

The possession count from kickouts was 36-19 in favour of Dublin. Whilst remarkable using a term like “cleaned out” may be hyperbolic as 13 of those 17 extra possessions came from short kickouts – and once again Tyrone dealt very well with Dublin’s short kickouts allowing just 0.23pts per kickout won. Tyrone allowed 0.28pts in the three games prior to the final. This is against the 0.47pts allowed by other teams in the run up to the final.

Tyrone, it would appear, can handle Dublin’s short kickouts. What we saw in the three previous games was that they couldn’t handle the longer ones with Dublin scoring 2-13 off 34 won past the 45 (0.59pts per kickout won – compare that to how they stifled Dublin on short ones). Again here Dublin scored 2-04 off just 14 won past the 45; 0.71pts per kickout won.

Apart from only breaking even (winning 8 to Dublin’s 7) on their own kickouts past the 45 the other glaring number from a Tyrone perspective is that they only got two shots from the nine short kickouts (22%) they reclaimed. This seems to have been a one off as in the three games against Dublin they created a shot on 64% (18 shots from 28) of their short kickouts

Appendix

Time series chart v Galway

Dublin shooting chart


disc = scored, x= missed, yellow = deadball, red = goal attempt, black = point attempt 1st half, white = point attempt 2nd half

2018 All Ireland preview

August 28, 2018

Possessions

It goes without saying that the first primary objective of any team is to gain control of the ball. In the three most recent meetings between the protagonists (2017 AI semi-final, 2018 league and 2018 Super8) the total possession count is 136–135 in Dublin’s favour. It is somewhat surprising to see things so evenly matched however when we review first halves only Dublin are 69–62 ahead so game state has definitely had an effect on this metric.

Still Tyrone have been better in the last two encounters trailing the possession count at half time 24–23 in the league game and 22–20 in the Super8 contest. The concern here is that both of these contests were held in Omagh with all the built in advantages that entails. It will be imperative for Tyrone that they replicate these Omagh starts in the slightly less friendly environs of Croke Park and, at the very least, get on as much ball as Dublin. And get on it early.

Possession can be garnered in two primary ways. The first is through kickouts and the second is through turnovers (see note1 below). Kickouts are covered in depth below but focussing on turnovers there is definitely a trend favouring Tyrone. They, in their three games against Dublin, lead the turnover count 75 – 64 however that advantage dissipates when it comes to the prime counter attacking turnovers garnered outside your own 45. Both teams have managed to get their hands on 17 turnovers apiece outside the 45 with Dublin producing more (which will become a common theme) scoring 2–04 from these 17 possessions compared to 0–04 for Tyrone (see note2 below).

Tyrone’s turnover advantage is blunted by the fact that they have received the ball more often inside their own 45, giving Dublin time to reset the defence.

Once control of the ball is established the next step is to manufacture a shot. This is the oft referenced transition stage and is generally something that we in the GAA are bad at quantifying. We know, just from visual observation, that Dublin are excellent in this phase but just how good are they? And how do you quantify that?

Using shot totals as one measure Dublin are not that much better. In their three meetings Tyrone, despite having one less possession, actually end up with one more shot than Dublin (80 – 79). That even includes two shots that Dublin got from rebounds (so can’t really be attributed to “transition”). Now there is great disparity game to game (Dublin had six more shots in the 2017 semi-final, Tyrone had eight more in the league game whilst Dublin had just the one more in the Super 8 encounter) but Tyrone have, on the whole, created chances.

As further evidence of Tyrone’s ability to create chances; in their four most recent games (3x Super8 contests and the semi-final v Galway) Dublin progressed 68.9% of their possessions to a shot whilst the opposition combined for 69.3% on this metric. In their last four games, against much the same opposition as Dublin, Tyrone progressed 73.9% of their possessions to a shot. Of late Dublin have not really stopped teams, be it Tyrone or others, from transitioning to a shot.

If there is no discernible quantitative difference between how the teams use the ball then, given that Tyrone have lost the last three encounters by a combined 20 points, there must be quite a large qualitative difference.

When Dublin have the ball

Going into the 2017 final Dublin were recording a quite remarkable Conversion Rate of 61%. That was from five games which included three in the Leinster championship so theoretically that 61% should have been somewhat bloated by facing lesser opposition (that theory was dented when they then went out and hit 68% against Mayo in the final but still …. )

In their last four games, which on paper should have been collectively harder than the 2017 run in, Dublin have returned a quite incredible 64% (see Table1 in the Appendix for detailed player breakdowns). To try and put this into some form of perspective the average Conversion Rate from 2015 to 2017 was 53% whilst everyone else in the 2018 timeframe (Super8s and semi-finals) has hit 55%.

So how are Dublin achieving this?

Frees

Perhaps the most obvious place to start is with their free taking. Dean Rock has been the leading light in terms of accuracy of late. From 2015 to 2017 Dublin converted 82% of their frees (0–93 from 113) with Rock accounting for the vast majority of this; he took 81% of all their frees in this timespan recording a whopping 88% (0–81 from 92) Conversion Rate. Every other free taker was a combined 72% during this period.

Within the four games outlined above Dublin have converted 82% (0-18 from 22) of their shots from frees with everyone else from the Super8s onwards combining for 74% (0–95 from
128). Dublin would appear to be maintaining their free kick superiority.

It is not as clear cut as all that however. With the Super8s including long range experts like Michael Murphy, Rory Beggan and Niall Morgan it could be argued that Dublin should be hitting a higher Conversion Rate as they are collectively attempting easier frees.

Dublin have taken 55% of their 2018 frees from central locations (an imaginary line up from the D out to the 45 in the above chart) with only four being attempted from outside what I consider to be the optimal range. By contrast only 36% of the other teams’ frees were from this central alley with a not insubstantial 7% of all frees coming from outside the 45. So Dublin’s frees have been appreciably easier.

This is where the Expected Points model comes into its own. On the 22 frees Dublin attempted they were expected to score 18.42 points. They scored 0–18 thus were below average (Expt Pts of -0.42) for these attempts. The other teams had an Expt Pts of 91.26 on the 128 they attempted so the 0–95 scored was 3.74pts above average (Expt Pts of +3.74). Dublin have aided their 2018 Conversion Rate with easier frees but they have not been better free takers per se.

Tyrone however cannot rely on this. Dean Rock has stood up on the big stage before recording a whopping 83% (0-25 from 30; Expt Pts of +3.15) in All Ireland finals and semi-finals in 2016 and 2017. The balance of probabilities is he will deliver again in this final.

There is nothing Tyrone can do to affect Rock’s Conversion Rates (I have no doubt they will try all sorts of verbals, and running across his eye line, but if Lee Keegan’s flying GPS unit in injury time of a final can’t put him off I doubt anything Tyrone do will!). All they can do is cut down the number of opportunities they afford him from frees.
In their most recent non Dublin games Tyrone have given up an average of 6.75 shots at goal from frees (6.5 if we exclude those frees from outside the 45 which Dublin tend to ignore). In their last three games against Dublin they have allowed an average of 4.67 (4, 5 and 5) shots from frees. That is pretty good. This discipline needs to be maintained.

Point attempts

Something similar, in terms of Conversion Rates, is identifiable when it comes to point attempts. Dublin in 2015 – 2017 converted 54% of all their point attempts whilst everyone else was at 46%. In the last four games Dublin have scored on a remarkable 61% of their point attempts (see Table1). Everyone else in that time span has converted 50%. What gives?

Unlike frees – where the main influence on Conversion Rates is from where on the pitch the free was taken from – you can have more constituent parts here affecting the outcome. Location on the pitch is still a deciding factor; as is pressure (see note3) being applied to the defender. Weather can be a factor whilst game state (reviewed here) is also an issue.

Here we are going to focus on two of those – pitch location & pressure applied – but in truth all the above factors can feed in.

Pitch Location

Using our previously constructed central channel as a starting point Dublin again – much like their free taking – help themselves by taking more shots from here. 48% of their point attempts in the last four games come from this region as opposed to 38% for everyone else. But here the similarities end.

Dublin have converted 67% (0–29 from 43) of all point attempts from this central channel and 55% (0–26 from 47) from elsewhere. Everyone else, from the Super8s onwards, is 59% (0-113 from 192) centrally and 45% (0-135 from 303) from elsewhere. Dublin may take easier shots more often but they also convert them at a higher rate.

You may, correctly, say that all these percentages are within any margin of error given the sample sizes. But this phenomenon is not new. In 2017 Dublin were 63% on point attempts from the central channel and 54% elsewhere for an overall Conversion Rate of 58%. Everyone else was 57% centrally, 42% elsewhere and 47.5% overall.

The one trend that is very noticeable this year is just how much Dublin have focussed on shooting centrally. As noted above, and which is very noticeable from the shot chart, 48% of their point attempts have come from the central channel this year – that was consistently in the low 30s the last three years (32% in 2015, 34% in 2016 and 31% in 2017).

Pressure

Looking at the pressure applied to the point attempts we can see that strong or severe pressure was applied to 41% of Dublin’s point attempts and 49% of everyone else’s. It is hard to know if that gap is purely based off Dublin’s fluid movement and decision making or something else. One factor that could aid the gap is game state.

Dublin tend to be involved in more lopsided games than anyone else. Intensity, and as a consequence pressure on shots, drops off in such games. We are getting into very small volumes here but if we only look at point attempts in the first half, when that intensity drop should not be in evidence, do we get the same results? It does narrow the gap; Dublin face strong or severe pressure on 48% of their first half point attempts as opposed to 51% for everyone else.

Dublin’s high Conversion Rates are aided by centrally located shooting and a drop off in pressure in low key second halves. But that shouldn’t belie the skill in evidence – they still convert those centrally located shots at a higher rate than anyone else and manage to take more shots, under less pressure, despite shooting more often from the same crowded central zones.

What about Tyrone’s defence? Is there anything in their recent history that suggest they can affect this? In the seven games under review (see note4) Tyrone have allowed a 50% Conversion Rate on point attempts. About average. This overview masks a pretty big differential however.

Dublin have converted 56% of their point attempts in their three games against Tyrone whilst Monaghan, Donegal and Roscommon combined have converted 45% in their four games.
That 45% is very good. The 56%, when compared to 2017 and 2018 Dublin averages of 58% and 61%, is quite good. Tyrone will need more than quite good here however.

In fairness Tyrone have progressed game on game allowing Conversion Rates of 62% (0-13 from 21) in the 2017 AI SF, 57% (0-08 from 14) in the league encounter and 50% (0–10 from 20) in the Super8 contest. They can allow a high conversion rate off a low base – the league encounter, or a low Conversion Rate off a high base – the Super8 contest. Just not a high Conversion Rate off a high base which is what happened in last year’s semi-final.

Goals

Dublin are known for going for goals. The last four games, excluding penalties, has seen them return 8–02 from 17 shots at goal for a 47% Conversion Rate and 1.53 points per attempt (ppa). Everyone else from the Super8s onwards returned a 40% Conversion Rate (22-09 from 55) and 1.36 ppa.

In 2015 – 2017 Dublin converted 44% of their goal attempts for 1.43ppa whilst everyone else was 38% and 1.23ppa. Dublin are better at taking their goal chances and have been consistently so over the last few years. Quelle surprise!!

Dublin’s higher Conversion Rate is not the real story however. What is really devastating is that they maintain these above average returns whilst going for goal more often. In their last four games they have gone for goal once every 11.4 possessions whilst everyone else has gone for goal once every 18.6 possessions. From 2015 to 2017 they went for goal once every 14.9 possessions versus once every 19.0 possession for everyone else.

There is also the belief that Dublin go for goal early. This was definitely a “thing” in 2017 where the time of their first goal attempt in each game was 09:33 v Kildare (which they scored and then proceeded to goal again on their very next possession), 00:49 v Westmeath, 08:40 against Monaghan and then O’Callaghan’s two salvos against Tyrone @ 04:33 and Mayo @ 01:22 respectively. Five games all with a goal attempt within ten minutes and three with a goal attempt within five minutes.

This has not been as evident in 2018. It was 14 minutes before their first goal attempt against Donegal, their one and only attempt up in Omagh was in the 39th minute and 26 minutes had elapsed against Galway before they had a shot at goal. Only the non-entity of a game against Roscommon produced an early attempt (Costello had his saved on Dublin’s very first possession).

In the seven games in focus Tyrone have allowed 17 shots at goal, or 2.43 per game. In and of itself this is fine however again there is a Dublin/non-Dublin split. In the three Dublin fixtures they have allowed nine goal attempts. That’s three a game, or one every 15.4 possessions, to Dublin and two a game, or one every 23 possessions, to other opponents.

Again there has been an improvement. In their two 2018 meetings with Dublin they have allowed four shots at goal; two a game and one every 23 possessions. You feel that Tyrone will need to replicate this to have any hope but the nagging fear is that, as stated previously, both of those 2018 games were in Omagh. In their Croke Park meeting last year they allowed five shots at goal – can they replicate the Omagh form in Croke Park?

When Tyrone have the ball

Somehow, whilst everyone has been focussing on the blue marvels in the capital, Tyrone have amassed a very nice 60% Conversion Rate in their last four games (see Table2 in the Appendix). Whilst, like Dublin, they were greatly aided by Roscommon (Tyrone converted 79% for their 4–24 whilst Dublin hit 74% in their 4-23) the fear is that, unlike Dublin, the non-Roscommon return of 52% is a more accurate reflection of Tyrone’s level. To this point their 2015 to 2017 shooting saw them return a combined Conversion Rate of 52% with no individual year standing out as particularly accurate (50% in 2015, 49% in 2016 and 56% in 2017).

If Tyrone are not able to do any more than stem the Dublin tide can they show a hitherto fore unseen level of accuracy? In a one off game of course they can but their recent collective history is not so bullish.

Frees

One of Tyrone’s big downfalls in recent years has been their free taking. 2015 to 2017 combined saw them return 65% (2015 = 53%, 2016 = 55%, 2017 = 80%). This is against the backdrop of Rock hitting 88% in the same period. The 2017 mark of 80% looks like they may have hit on a solution however that elevated return was due entirely to Séan Cavanagh who is no longer there. He scored 0–12 from the 13 frees he took last year leaving everyone else to convert 67% (0–08 from 12).

2018 hasn’t seen much progression either. Combined Tyrone returned a below average 71% (Expt pts -0.68) in the last four games and have converted just 69% (0-09 from 13) in their three games against Dublin.

Tyrone know it is an issue (hence why they have had five different free takers in the three games against Dublin). Dublin know it is an issue. The crowd know it is an issue. As such the pressure will get ratcheted up with every miss (think of the pressure on McCaliskey in Ballybofey as he attempted one just before half time after Tyrone had missed three of their first four). At the very least Tyrone could really do with a clean first half here.

In the last three non-Tyrone games games Dublin have been very disciplined allowing the opposition an average of just 3.7 shots from a free with 1.67 in the first half of those games. They have allowed Tyrone just two frees in the first half of each of their three encounters.

Despite this being a weakness for Tyrone it might not manifest itself if Dublin maintain their normal discipline.

Point attempts

Although Tyrone have amassed a total Conversion Rate of 60% in the last four games that has been aided by a 90% Conversion Rate on goals (8 – 01 from 10 shots). This in turn then deflates the Conversion Rate for point attempts to 53% (0–48 from 90). Remove the Roscommon game and it drops to 46% (0 – 31 from 67). In the three games against Dublin it drops further to 41% (0-26 from 63).

There is just no sugar coating this. Tyrone’s point attempts from play have been poor. Very poor.
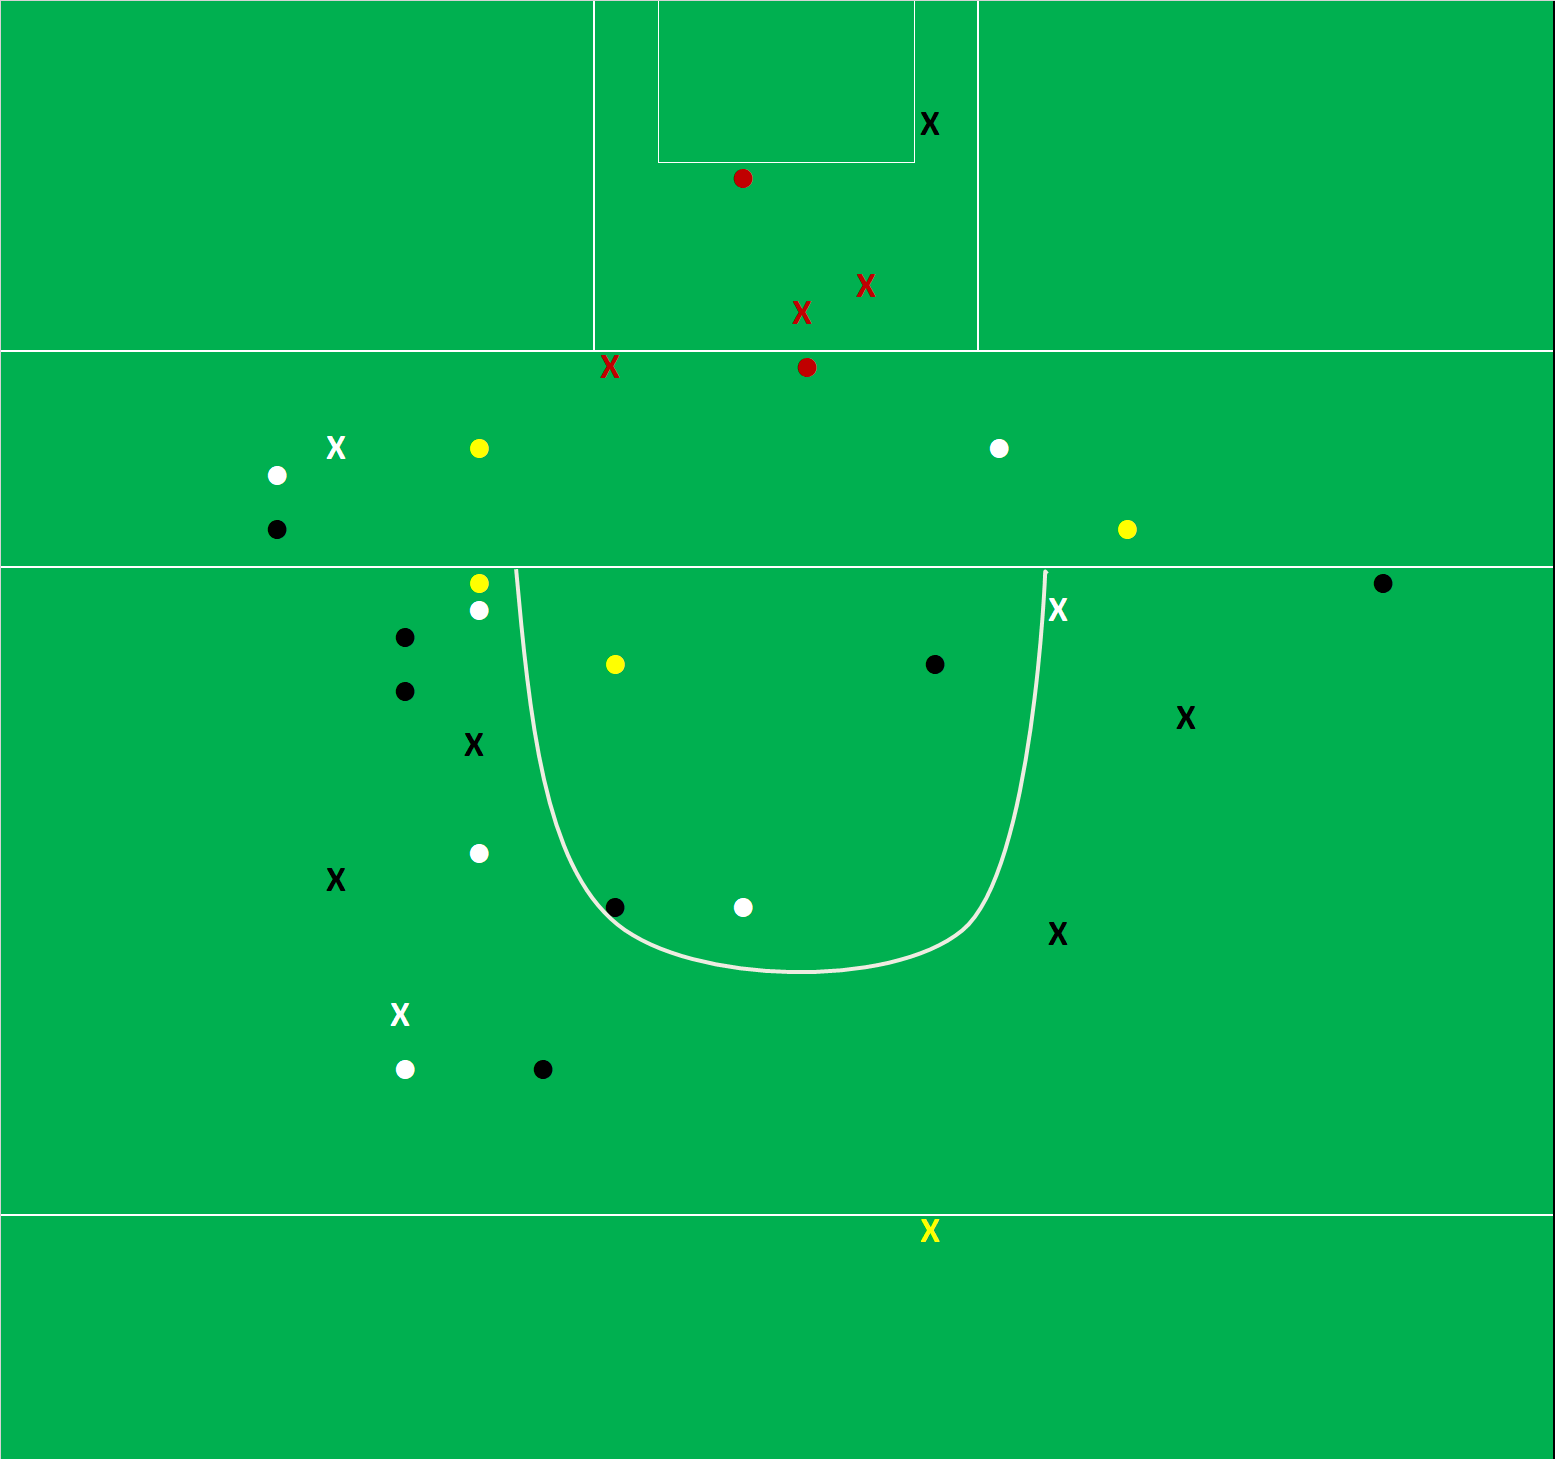
Part of the problem is shot location. If you recall Dublin are taking 48% of their shots from the central alley whilst the remainder are at 38%. Tyrone, in their three games against Dublin as outlined in the below chart, have only taken 24% (15 of 63) of their point attempts from this alley.

This isn’t a Dublin defensive thing either. In their three games, excluding Tyrone, Dublin have allowed 46% of point attempts from this central alley. Even removing the lacklustre Roscommon game it is still 43% for Donegal & Galway combined.

Just to prove it is more Tyrone than Dublin in their last four games, since the beginning of the Super8s, the volume of Tyrone shots from that central channel is 30% (27 of 90). An increase but still nowhere near the average let alone anywhere near Dublin’s returns.

Tyrone have been shooting themselves in the foot by ignoring the most productive sectors and shooting from what can only be described as sub optimal locations.

Goals

This may come as a surprise to those watching Tyrone of late but they have been relatively shy on the goal shot front. In the seven games under review they have just the 13 attempts with a sequence of 1, 2, 1, 4, 0, 4 & 1. That duck egg is the Super8 game against Dublin in Omagh whilst they have only managed three attempts in the other two Dublin games (a penalty in last year’s semi-final and two in the league game).

All that adds up to 1.86 attempts at goal per game over seven games or 1 every 23.5 possessions. Even more starkly it is 1 per game and 1 every 45 possessions versus Dublin! They will have to do something to create more goal chances.

There is a chink of light however in that Dublin have allowed teams to get in behind them of late with Donegal having three shots at goal, Galway four and Roscommon five. All Roscommon’s five came in the second half when even the pigeons had had enough of the game but still Donegal and Galway combining for seven attempts shows that it is no forlorn hope to step up on their current record

Kickouts

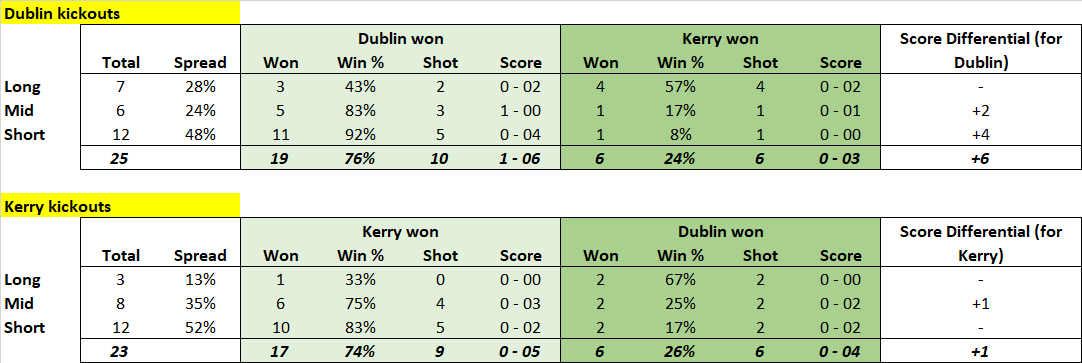
The below table shows the result of kickouts from the three Dublin v Tyrone games. There’s bit to unpick!

First of all, at a macro level, both teams have used a similar enough kickout profile with approx. 50% going short (inside the 45), 33% mid (between the 45 & 65) and 17% going long (past the 65).

On the short ones the returns are broadly (we’re dealing in broad brush strokes here!) in line. Tyrone have lost just the one – which was a throw up after an infringement – but managed to get a shot from 64% of the remainder.

We have seen that Dublin’s Conversion Rates are quite a bit ahead of Tyrone so it is no surprise to see that they have scored 0 – 03 more from the short ones they won. It is a surprise however to see that they converted the ones they won to a shot at a much lower rate than Tyrone (47% v 64%).

That equates to Dublin scoring 0.28pts per short kickout won. Against Monaghan, Roscommon & Donegal combined (see Table3 in the Appendix) Dublin have manufactured a shot from 53% of their short kickouts and scored 0.47pts per short kickout won.

Against Dublin the short ones, both defending against and attacking from, have not really been Tyrone’s problem.

The longer ones are a different issue. At a primary possession level there is no great problem. There have been 62 kickouts that have landed past the 45 with Dublin winning the contest 34–28. At the start of any game you would probably take a 55-45% split against Dublin on kickouts that land past the 45. One step further and Tyrone match Dublin when converting those key primary possessions to shots; Dublin convert them to a shot 59% of the time (20 shots from 34 possessions) with Tyrone at 57% (16 from 28).

It is the scores that come from these longer kickouts that become the problem. Dublin have scored 2 – 13 to Tyrone’s 1 – 07 from kickouts won past the 45. That’s 0.56 points per kickout versus 0.36. This is not unique to Tyrone; against the three aforementioned teams Dublin have scored 0.61 points per kickout won past the 45 and allowed 0.30.
Initially I had thought it was something that Dublin were cleverly doing around Marks but that is not the case. Tyrone have “out-Marked” Dublin 10–6 in their three encounters and scored 0–04 to Dublin’s 0–03 from those Marks. Instead the issue is within those kickouts that land gently into a Dublin player’s stride, past the 45, with no pressure applied.

To break these kickouts down
• Dublin have won 34 kickouts past the 45.
• They have claimed 6 Marks scoring 0–03. That leaves 28.
• Of these 12 were claimed off Tyrone kickouts with Dublin only managing to score 0-01; Dublin may be able to win the Tyrone kickout but haven’t scored off it.
• That leaves 16 of their own kickouts won past the 45 where the ball has hit the deck … but Dublin have scored 1 – 09!

We are in the realm of extremely small sample sizes here and these numbers are not something Tyrone can base a game plan around. But they are unique to Tyrone. Against the other three teams Dublin have won 44 kickouts past the 45 scoring 2-21; 2-06 scored off 16 Marks, 0–10 scored off the opposition’s kickouts (x16) and only 0-05 off their own (x12).

Wrap Up

Dublin are the offensive juggernaut that Tyrone will have to stifle. To do this they will need to ensure they manufacture as many possessions as Dublin, especially in the first half, and maintain their recent discipline in the tackle by offering up no more than five scoreable frees to Rock. They will also have to avoid the dagger of an early goal though luckily for them Dublin may be compliant in this by not going for goal as early as they did in 2017.

After that (sure the first bit is easy!!!) every shot needs to be affected through pressure or location. They need to stay in the game.

Offensively Tyrone have to pick up. They cannot hope to win this game with 70% on frees and mid 40% on point attempts. Although they have not created many goal chances against Dublin we know from the Donegal and Roscommon games that they can. And more importantly that they have been clinical in taking them. If they cannot stem the Dublin attack then they will have to score whatever goal chances come their way.

note1; 95% of all possessions emanated from kickouts (48%) or turnovers (46%) in 2015 – 2017 (9,018 possessions). The remainder came from shots regained (thus the start of a new possession) or throw ins.

note2; As an aside Dublin scored 1-15 from turnovers garnered inside their own 45 (0.38pts per turnover) with Tyrone scoring 0-17 (0.29pts per turnover). Again a function of Dublin’s ability to convert rather than anything Tyrone are (not) doing in transition.

note3; One man’s pressure is another’s loose arm – there is no agreed methodology for tracking pressure but I subjectively give a points range of 0 (no pressure) up to 3 (severe pressure) on each shot to indicate how much the defence pressure shots taken. It is subjective but over time any errors or biases should be applied to all teams evenly so if it is wrong it should be wrong in a very fair and even manner.

note4; The seven games are the three against Dublin, the two non-Dublin super8 fixtures (v Donegal & Roscommon) and their two encounters with Monaghan this year (in Omagh & Croke Park)

APPENDIX

Table1; Dublin shooting by player (Super 8 & AI SF)

Table2; Dublin shooting by player (Super 8 & AI SF)

Table3; Dublin kickouts v Donegal, Roscommon (Super8) & Galway (AI SF)

Mayo v Galway 2018 Connacht

May 15, 2018

For those new to the blog, or who haven’t been here for a while, please find a refresher on the definitions and how the numbers are compiled here

Team Possessions Attacks Shots Scores Exp Pts
Mayo 40 35 27 0 – 12 14.69
Galway 41 34 23 1 – 12 12.33

Overview

81 possessions in total is very low. In the 31 Championship games charted in 2017 only one – Carlow v Dublin at 79 possessions – came in lower whilst there were 106 total possessions in the 2016 meeting of these teams and 113 in 2017. The low possession total was very much aligned to the “new look” Galway which emerged during this year’s league campaign. In the five games involving Galway shown live on TV the possession totals were 77, 77, 78, 78 and 84.

Focusing on Mayo the positive is that they produced four more shots than Galway in a game where they, for various reasons, managed to get just over one full game from the two O’Connor brothers, Lee Keegan & Tom Parsons combined as well as playing with 14 men for more than half the game. The downside? Old failings, that have haunted them at various ports in this journey, are still evident. Poor conversion rates. Frees from the right. Ill-discipline.

Galway? Once again they won a game by hitting their marks. Progression from the league was maintained by continuing to condense games and converting at an above average rate. They may be concerned at just how long it took them to break down a team playing with 14 but somehow I doubt it. They played *their* game and won. Move on.

When Mayo had the ball

Overall Mayo were able to get shots off at a better rate than Galway (27 shots from 40 possessions as against 23 from 41 for Galway) however the execution was very poor. Perhaps surprisingly the majority of the damage was done *before* the sending off. Up until D O’Connor’s red card Mayo had attempted 12 shots scoring 0 – 05 (42%). Three of these points were from frees leaving their point attempts from play at a very poor 25% (0 – 02 from 8; Expt Pts of -1.971). When they went down to 14 their overall Conversion Rates improved to 46% (0 – 06 from 13; Expt Pts of +0.240). This improvement only dragged them up to average however and couldn’t “fix” the poor start.

This poor shooting is nothing new. Galway have proven to be kryptonite to Mayo’s forwards. In 2016 and 2017 combined Mayo were a very poor 28% (0 – 11 from 38) on point attempts from play. Here they were 38% (0 – 09 from 21).

Below is the 2018 point attempts (in yellow) overlaid on the 2016 and 2017 shots (black). A couple of things are stand out. Lessons were learned in terms of shot location in that unlike the previous two years there were no wild shots this year from out on the wings (possibly aided by Galway’s inverted umbrella defence around the D allowing Mayo to get closer) however on the flipside Mayo were unable to get inside the cover during this year’s encounter.

From a shooting perspective no one stood out. Kevin McLoughlin converted his two shots from play but also missed two readily convertible frees from the right (he also turned down a difficult third free from the right wing on the 20m line).

A O’Shea had a quietly efficient game. He ended up with five primary assists for shots on goal – the next highest on either team was three.

The lack of offensive depth on the bench is a stick regularly used to beat Mayo with. They were already stretched given the above noted absences but again the last ~30 minutes were effectively left to the stalwarts. Those involved in the shots, from when Parsons went off and C O’Connor came on, were

Shots – A Moran x3, C O’Connor x2, K McLoughlin, C Boyle & J Durcan x1
Assists – K Higgins x3, A O’Shea & C O’Connor x2

Stretch it out to the 2nd last pass – where it mattered in the lead up to the shot – the players involved were C O’Connor x3, A O’Shea & J Doherty x.

Tough I know given that C O’Connor was a sub, and the defensive realignments allowed Higgins to move forward, but you want to see Loftus & Doherty more involved in this period when they were on the pitch. S Coen (though he won the free at the death) and P Durcan as well. One shot from J Durcan was the sum attacking involvement of the 2nd rank in that last 30 minutes.

When Galway had the ball

As intimated earlier the shape of the game was played out to Galway’s league template; low possessions high conversion rates.

The Conversion Rates, and high Expt Pts (+2.67), were aided greatly by McHugh’s two very good free kicks and them converting the only goal chance in the game. McHugh’s two frees were on the edge of the normal free taking range, or just outside it, and the conversion of both saw him bring his excellent league form (90%; 0 – 19 from 21 with an Expt Pts of +2.42) through to the Championship.

Galway’s point attempts were essentially average (47%; 0 – 09 from 19 Expt Pts of -0.416) with Comer (0 – 02 from 3) and Duggan (0 – 02 from 2) standing out.

Galway, unlike Mayo, managed to get a great kick from their bench. In the same period as noted above they got shots from P Cooke x2, S Kelly, E Brannigan and T Flynn after he came back on. Another player who stood out was Ian Burke. In his ~20 minutes on the pitch he was central to 1 – 02 of Galway’s late scoring providing a primary assist on three shots and was also the link man for Heaney’s goal.

Kickouts

Despite the intensity of the game, the nature of the teams, the pre-game talk about David Clarke’s kickouts, Galway’s league “form” in terms of eschewing short kickouts, this being the first televised Championship game under the new kickout rule – the kickouts were quite boring! The kickout team won 83% of the game’s kickouts. 62% (26 of 42) of kickouts were short with only one being won by the opposition.

The red card played into this. Nine of Galway’s eleven second half kickouts went short to the left as Mayo dropped off. Looking at Mayo’s kickout chart it is perhaps surprising that Galway didn’t make hay on Mayo’s 2nd half kickouts. First half (black on the chart) were pulled mainly to Clarke’s left – Galway could easily have pushed up hard against 14 in the second half but didn’t manage to in any effective manner.

Dublin v Mayo AI Final 2017

September 19, 2017

Unfortunately I won’t be in a position to do a half decent write up until much later in the week so below are the usual battery of stats/tables. I will do up a write up at some stage and post it here – mainly for reference when these teams meet in 2018!!!

Listening and reading to some of the coverage post the final what jumps out to me is

O’Connor’s free at the end was outside his range – see the preview. It is so harsh on O’Connor that he takes a hit for stepping up to cover his team’s deficiencies and in some way lessens what he does elsewhere – see his brilliant long range point to draw the game level at the end.

Take a look at the assists table for players who had hugely impactful, under the radar, game

Mayo’s shooting was not poor! It was better than both 2016 AI Finals … it was just that Dublin’s shooting was exceptional. At one stage in the second half they were 0 – 11 from 12 for a Conversion Rate of 92%. Collective ice in their veins.

Overview

Kickouts

Dublin attack

Shot Chart

Shooting Table

Assists

Mayo attack

Shot Chart

Shooting Table

Assists

Dublin v Mayo 2017 All ireland preview

September 14, 2017

Immediate post-game reactions and numbers from the 2016 final can be found here (drawn game) and here (replay). Both will be referenced heavily below

Dublin Attack

We’ll get into the constituent parts below but as a collective Dublin have returned a whopping 61% Conversion Rate so far in 2017. The 188 shots they have attempted has netted them 19 points more (Expt Pts +19.05) than the average intercounty team would have scored. This Dublin attack is rolling.

Point attempts from play

Table 1 in the Appendix shows the breakdown per player but as a collective over two thirds (+13.87) of Dublin’s positive Expt Pts has come from their point attempts from play. The average Conversion Rate over the past 5 years has been 46%; thus far Dublin have returned 56%. The question is not how good they are – we know they are exceptional – but whether they can maintain that level of production?

And it is an open question as we have seen this before. Coming into both the 2015 and 2016 finals Dublin’s forwards were also flying with pre final Conversion Rates of 57% in 2015 (Expt Pts +17.63) and 51% in 2016 (Expt Pts +8.25). In the 2015 final they were impressive in maintaining their high returns with a 57% Conversion Rate (0 – 08 from 14) and a one game Expt Pts of +1.57 (in poor weather it must be remembered). However in the two games against Mayo last year they stumbled to a very poor 37% (0 – 14 from 38; Expt Pts -4.72).

The question is whether this stumble was induced by facing Mayo or was it more of a Dublin blip? There is no way to categorically state either way but looking from the outside I would give Mayo a great deal of credit. Coming into the 2016 final Mayo, in their six games, had allowed a Conversion Rate of 41% (0 – 45 from 109) as opposed to the 51% Dublin had been putting up. Across the two games the 37% Dublin achieved was much more in line with what Mayo had been allowing.

We have a similar scenario this year. Dublin are flying with the aforementioned Conversion Rate of 56% but again over a nine game span Mayo’s defence have only allowed a Conversion Rate of 41% (which, as an aside, shows remarkable consistency year to year). Can Mayo repeat their 2016 trick and “drag” Dublin’s Conversion Rate down in the final?

In an effort to explain the drop in Dublin’s shooting I created a pressure index (see Note1) and noted that Mayo were consistent across the two games in applying strong or severe pressure to just under half of Dublin’s point attempts (45% in the drawn game and 44% in the replay). In 2017 – across the nine games – Mayo have applied strong or severe pressure to 46% of their opponents point attempts. This has risen to 59% in the last four games.

So we know that Dublin can shoot and that they can carry it over (2015 final) however we also know that Mayo stymied them in both games last year and that the pressure index for their 2017 season is trending upwards.

One difference, for Dublin, observed when comparing this year to the last two All Irelands is just who is taking the shots. Below are the top 5 point takers coming into the last three finals and whilst there was a change from ’15 to ’16 the new entrants then were generally known quantities in McManamon & Rock. With Connolly suspended and Brogan & McManamon mainly coming off the bench there is a newer, fresher, look to the Dublin strike force.

Mannion & Andrews are well known to the Mayo defenders at this stage but O’Callaghan – despite there being a mountain of video evidence on him – is new and may cause the Mayo defenders to sit off initially; remember it was the relatively unknown Costelloe off the bench that did the damage in last year’s replay.

Deadballs

Given their experience, both last year and in their run to the final this year, Mayo may believe that they can handle the Dublin forwards. But what they will have to be very conscious of is fouling. Rock had a poor day in last year’s drawn game (0 – 03 from 7 (43%); Expt Pts of -1.58) but was then devastating in the replay (0 – 07 from 7 with an Expt Pts of +1.58).

He, and Dublin as a whole, have maintained this form throughout the 2017 Championship returning a barely credible 94% Conversion Rate (0 – 33 from 35) with an Expt Pts of +6.43 (see Chart 1 in the Appendix).
A special note of praise for Rock here. Although he had an off day in the 2016 drawn final he has been phenomenal since basically being removed from free taking duties at the back end of 2015. In 11 Championship games since the start of 2016 he is 92% and as the below graphic shows he is not only consistent “inside” where he is 96% but also outside (75%). Not only has he accuracy but he has accuracy with length.

Mayo cannot hope that the Rock from the drawn 2016 final appears. Instead they must expect that the Rock we have seen from the start of 2016, and in the 2016 replay, shows up. They gave up seven scoreable frees in the replay; in 2017 they have given up an average of 6.6 shots at goal from frees. Unless defending a lead their target has to be to minimise Rock’s opportunities from frees to seven or less.

Goal attempts

Dublin have – surprisingly given their opposition and reputation – only been average on goal attempts. In 2015 they were averaging 6.0 shots at goal per game but had a phenomenal 60% Conversion Rate (18 – 04 from 30). In 2016 this reduced dramatically to 2.2 attempts & a 46% (5 – 00 from 11) Conversion Rate. So far this year it is back up to 5.0 attempts a game but with a basically average Conversion Rate of 36% (9 – 01 from 25). In the 2015 final they manufactured 4 goal attempts but couldn’t convert any whilst in the two 2016 games they only created four distinct attempts at goal – but did manage to score in the most unconventional manner!

It’s all a bit of a rollercoaster. I think it is fair to say that Dublin are a lot less goal hungry than previous incarnations but this year has seen them somewhat pick up their attempts per game.

Mayo attack

Whereas Dublin are on fire Mayo have been hotter and colder, both from game to game and within games, than any other team. They returned a Conversion Rate of 41% against Galway and 71% against Cork; they scored 1 – 09 from just 12 shots in extra time against Derry after producing 0 – 01 from 15 attempts in a 25 minute spell in the second half. Against Cork they scored 0 -14 from their first 15 point attempts from play.

Mayo are the walking embodiment of the fact that you can twist stats to back up any argument

Point attempts from play

Looking at the nine games in the round (see Table 2 in the appendix) however we can say that their point taking has been just above average (50% Conversion Rate; +2.21 Expt Pts). But this is a step up on their 2016 campaign (46% Conversion Rate; +1.62).

There’s a slight anomaly in the above figures in that Mayo’s Conversion Rate has increased but the Expt Pts has remained more or less static. That’s because Mayo have attempted much more shots from central locations this year compared to last year. In a most Un-Mayo like fashion they have made life easier on themselves!

If we run an imaginary line vertically from the outer edges of the D to the 45m line we create a central channel. In 2016 34% of Mayo’s point attempts came from inside this channel. In 2017 this has risen to 51%.

A lot has been made of Mayo’s reliance on Moran and C O’Connor. Between them they have attempted 32% of Mayo’s point attempts returning 34% of their scores however in truth this is not too far removed from Dublin’s spread. Dublin have relied on O’Callaghan & Mannion for 29% of their point attempts and 30% of their scores. Now the argument can be made that Dublin have more alternatives in Connolly, Brogan, Kilkenny, Rock, Andrews et al should you shut the front two down – and that’s fair – but there are only so many shots to go around. And as good a unit as Kerry’s defence couldn’t shut them down. Moran & C O’Connor took 28% of Mayo’s point attempts across the two semi-finals with a combined Conversion Rate of 72% and Expt Pts of +2.89

Another notable point re Mayo’s shooting is that the “back-up”, the next ten players by shot volume (see Table2 in the Appendix), have been as accurate as Moran & C O’Connor with a 53% Conversion Rate (0 – 55 from 104) compared to Moran/C O’Connor’s 54% (0-34 from 63). Have Mayo got two top shooters? Yes. Have they ready-made, volume based replacements if they are shut down? No. Can the workload be spread and the efficiency maintained if they are shut down? Yes.

What of the Dublin defence? Coming into the 2016 final Mayo were running at an about average Conversion Rate of 45% (Expt Pts +0.89). For the two finals their combined numbers were 0 – 14 from 31 (Conversion Rate of 45%; Expt Pts of +0.22). The sample size is small but Dublin’s defence had no real additional effect on Mayo’s efficiency – Mayo carried over their conversion rate. Where they did have an effect however was in limiting the attempts Mayo had. Coming into the 2016 final Mayo had taken 20.7 point attempts per game. In the final this dropped to 15.5.

This year so far Mayo have averaged (again with remarkable consistency) 20.5 point attempts per game. In 2016 Dublin – prior to the final – had allowed the opposition to take 16.6 point attempts per game but this has risen to 18.6 in 2017. So not only has Mayo’s efficiency on the same volume of shots increased but Dublin are allowing more shots and (in 2016 at least) didn’t have an effect on Mayo’s efficiency.

Deadballs

C O’Connor has been rock steady on frees throughout his career converting, when the pressure has been at its most intense, 86% (0-55 from 64 Expt Pts of +4.99) in semi-final and finals alone from 2012 to 2016. His range does appear to have shortened however.

The above chart shows C O’Connor’s 2017 frees in yellow and using the same boundaries as the Rock chart above we can see that O’Connor is as good as ever “inside”. He has recorded very similar numbers to Rock at 95% (0 – 35 from 37) however he has definitely struggled “outside” recording a very poor (relatively speaking) 35%.
The two black dots on the chart are Jason Doherty’s attempts in the semi-final replay versus Kerry whilst the red cross is the free that O’Connor missed at the death in last year’s replay. As discussed at the time you would not have wanted anyone else standing over that free given his performance in the most pressurised of stages previously but it was definitely on the outer edge of his range.

Given his range limitations, his record this year and how comfortable Doherty looked the last day surely there’s a case for handing over the longer range attempts?

Apart from C O’Connor’s range – which does look to have a ready-made alternative should Mayo wish to employ Doherty – another area of concern would be frees from the right. Attempts from this area are sparse in the above chart (C O’Connor handed the ball to Moran for at least one free from this area against Kerry) as you would imagine C O’Connor is only too aware of his limitations. The issue was only exasperated by McLoughlin missing his two frees from inside the 20m on the right against Derry and Sligo.

Everyone knows O’Connor doesn’t want to take frees from wide right whilst the alternative, in McLoughlin, has, being kind, been shaky. Mayo know this is a weakness. We know it. You can be damn well sure that the Dublin defence knows it too.

Goal attempts

Mayo have been slightly below Dublin in their attempts per game at 4.2 however have been ahead of Dublin with a Conversion Rate of 42% (16 – 03 from 38 attempts). In the round that’s 5.6pts per game from both for their goal attempts (Dublin 5.60, Mayo 5.67).

Kickouts

One of the most eagerly anticipated duals will be the kickouts. How successful will Mayo be at getting their, what at times look extremely dicey, short kickouts away? Will they push up on Dublin? Once won how good will each team be at manoeuvring the subsequent possession into a shot and score?

Dublin Kickouts

See appendix for raw numeric tables

To date Dublin have gone short (see Note 2) on 66% (63 from 96) of their kickouts winning them all and managing to produce a shot from 73% which resulted in 3-27. That’s 0.57 points for every kickout won. Which is incredible. The returns for all other kickouts won is 0.45 – which doesn’t account for the kickouts the lost when the ball went past the 45 – whilst Mayo are a net (unlike Dublin they have lost 9 of their own short kickouts which has resulted in the opposition getting 0 – 03) 0.33 points per short kickout.

You have to imagine that Mayo will look to disrupt this wherever they can. To date 50% of the opposition’s kickouts have gone short in Mayo games with the opposition getting 0.31 points per kickout won. Mayo have gotten their hands on 10% (12 out of 120) of the opposition’s kickouts and when they do they go for goal – scoring 2 – 03 off those 12.
In the two finals last year Dublin had a similar split to this year in that 65% of their kickouts went short but Mayo had much more success keeping Dublin to just 0.12 points per short kickout won (0 – 03 off 25). And that’s without referencing the two short ones that Mayo won.

When we compare this to what Dublin have done to date in the 2017 Championship you have to believe that whilst Mayo may not be able to stop Dublin completely, and may not be able to clamp down as rigidly as they did last year, they should at least provide a much more substantial obstacle than Dublin have faced hitherto fore.

Mayo kickouts

Across both 2016 games Mayo lost five (17%) of their 29 short kickouts against Dublin including two at the death of the drawn game that surely had a part to play in Clarke being dropped for the replay. Clarke is now firmly ensconced as Mayo’s No.1 but the short kickout roulette can still occur at any moment as they have lost 9 across six different games.

Mayo have been somewhat fortunate in that none of those 14 lost short kickouts (5 against Dublin and 9 this year) have resulted in a goal – instead 0 – 08 has come from them – but it is only a matter of time. But Mayo will continue to roll that dice, even in the face of the Dublin pressure, as it has served them well overall. Whilst not as spectacular as Dublin’s 0.57 Mayo have returned 0.39 points for every short kickout won this year.

That does rise to 0.43 for their own kickouts that they win past the 45 however they only win 63% of these – for all the anxiety they give their fans on the short ones they are still winning 90%. It’s almost a no brainer. No matter how many palpitations they give you if your returns are the same on the short ones as on the longer ones but you win more of the short ones – well you keep going short. That is until you give away the inevitable calamitous goal … let’s hope for Mayo’s sake their luck holds for one more game.


Appendix

Table 1 – Dublin point attempts by player

Chart 1 – Dublin 2017 deadballs

Table 2 – Mayo point attempts by player

Table 3 – Dublin 2017 kickout overview

Table 4 – Mayo 2017 kickout overview

Note 1 – Pressure Index explanation; this is a subjective metric where the pressure applied to a shot from play is given a range from 0 to 3. Very generally
• 0 = no pressure applied,
• 1 = very little (e.g. a player running alongside but not tackling)
• 2 = strong (e.g. on the shoulder, catching the shooters eye by flying in to tackle)
• 3 = intense (e.g. a block, delivering a shoulder just as the shot is being taken)

It does come with a warning as it is subjective but seeing as there is only one person applying the metric you would expect that there would be a level of consistency when a large enough volume of shots is reviewed.

Note 2 – Kickout definition
• Short = ball landing inside the 45
• Mid = ball landing between the 45 & 65
• Long – ball landing past the 65

Again some judgement is required for contested balls around the 45/65 but on a large enough dataset any kinks will be lost to the averages

Dublin v Tyrone 2017 AI SF

September 5, 2017

Unfortuantely I haven’t been able to get to the game and at this stage there really is nothing I can add to the commentary that is already out there.

Instead I will just leave the raw outputs here in case anyone wants them

Game overview

Dublin attack

Shot Chart

Assists & shooting overview

Tyrone attack

Shot chart

Assists & shooting overview

Kickout overview