Posts Tagged ‘Frees’

Free Taking Review

June 15, 2020

This piece started out as a simple question – who is the best free taker? Just like reviewing the impact of short kickouts however that simple question opens up differing layers of complexities. So before we can answer that original simple question we need to disentangle the complexity, by understanding the various components, and then put it all back together again. (see note1)

Historic returns
Frees (for this piece 45s are considered free kicks) have produced a relatively stable return for the past number for years though there was a step up in 2017 that has been maintained.

The numbers involved, at just under 2.5k attempts, are robust. We can be happy that the returns, whilst covering approximately one third of all Championship games, are indeed indicative of free taking in the game at the highest level.

2017 – 2019
The relative stability of the returns means that the Expt Pts methodology works well. Thus we are able to look past pure Conversion Rates and take into account the relative difficulty of various frees to see who is outperforming the average

The above table shows the returns for any player with >25 attempts recorded in Championship games from 2017. Why we chose 2017 will become apparent. We can immediately see the importance of overlaying something (in this instance Expt Pts) onto the Conversion Rate through the lens of Rory Beggan. His Conversion Rate is low as the vast majority of his attempts are from distance. But his strike rate on these more difficult attempts is such that it ensures his returns, through Expt Pts, are well above average.

But this table is incomplete. It only includes those games fully charted and in the database.

To ensure a complete picture all frees from games not in the database, for those nine players, as well as the data for another six free takers from Roscommon & Tyrone (see note2), was reviewed and backfilled

Some quick highlights
• Diarmuid Murtagh comes in with a bullet; first on Conversion Rate and an above average return
• A “big three” emerges with Dean Rock, Seán O’Shea and Beggan pulling away from the others in terms of Expt Pts
• Through this lens Conor McManus & Michael Murphy are surprisingly low on the table
• Tyrone’s issues from deadballs are evident. They have used Seán Cavanagh & Darren McCurry as well but their main strikers have been below average as a trio

Shot Charts

From 2017 onwards I started to chart exactly where point attempts were taken from as opposed to just the sector which feeds into the Expt Pts calculation. This allows us to produce individual shot maps. It has also allowed us to create zones for frees – demarcated by the blue line above- with the guideline returns being 90% for “inside” and 50% for “outside”

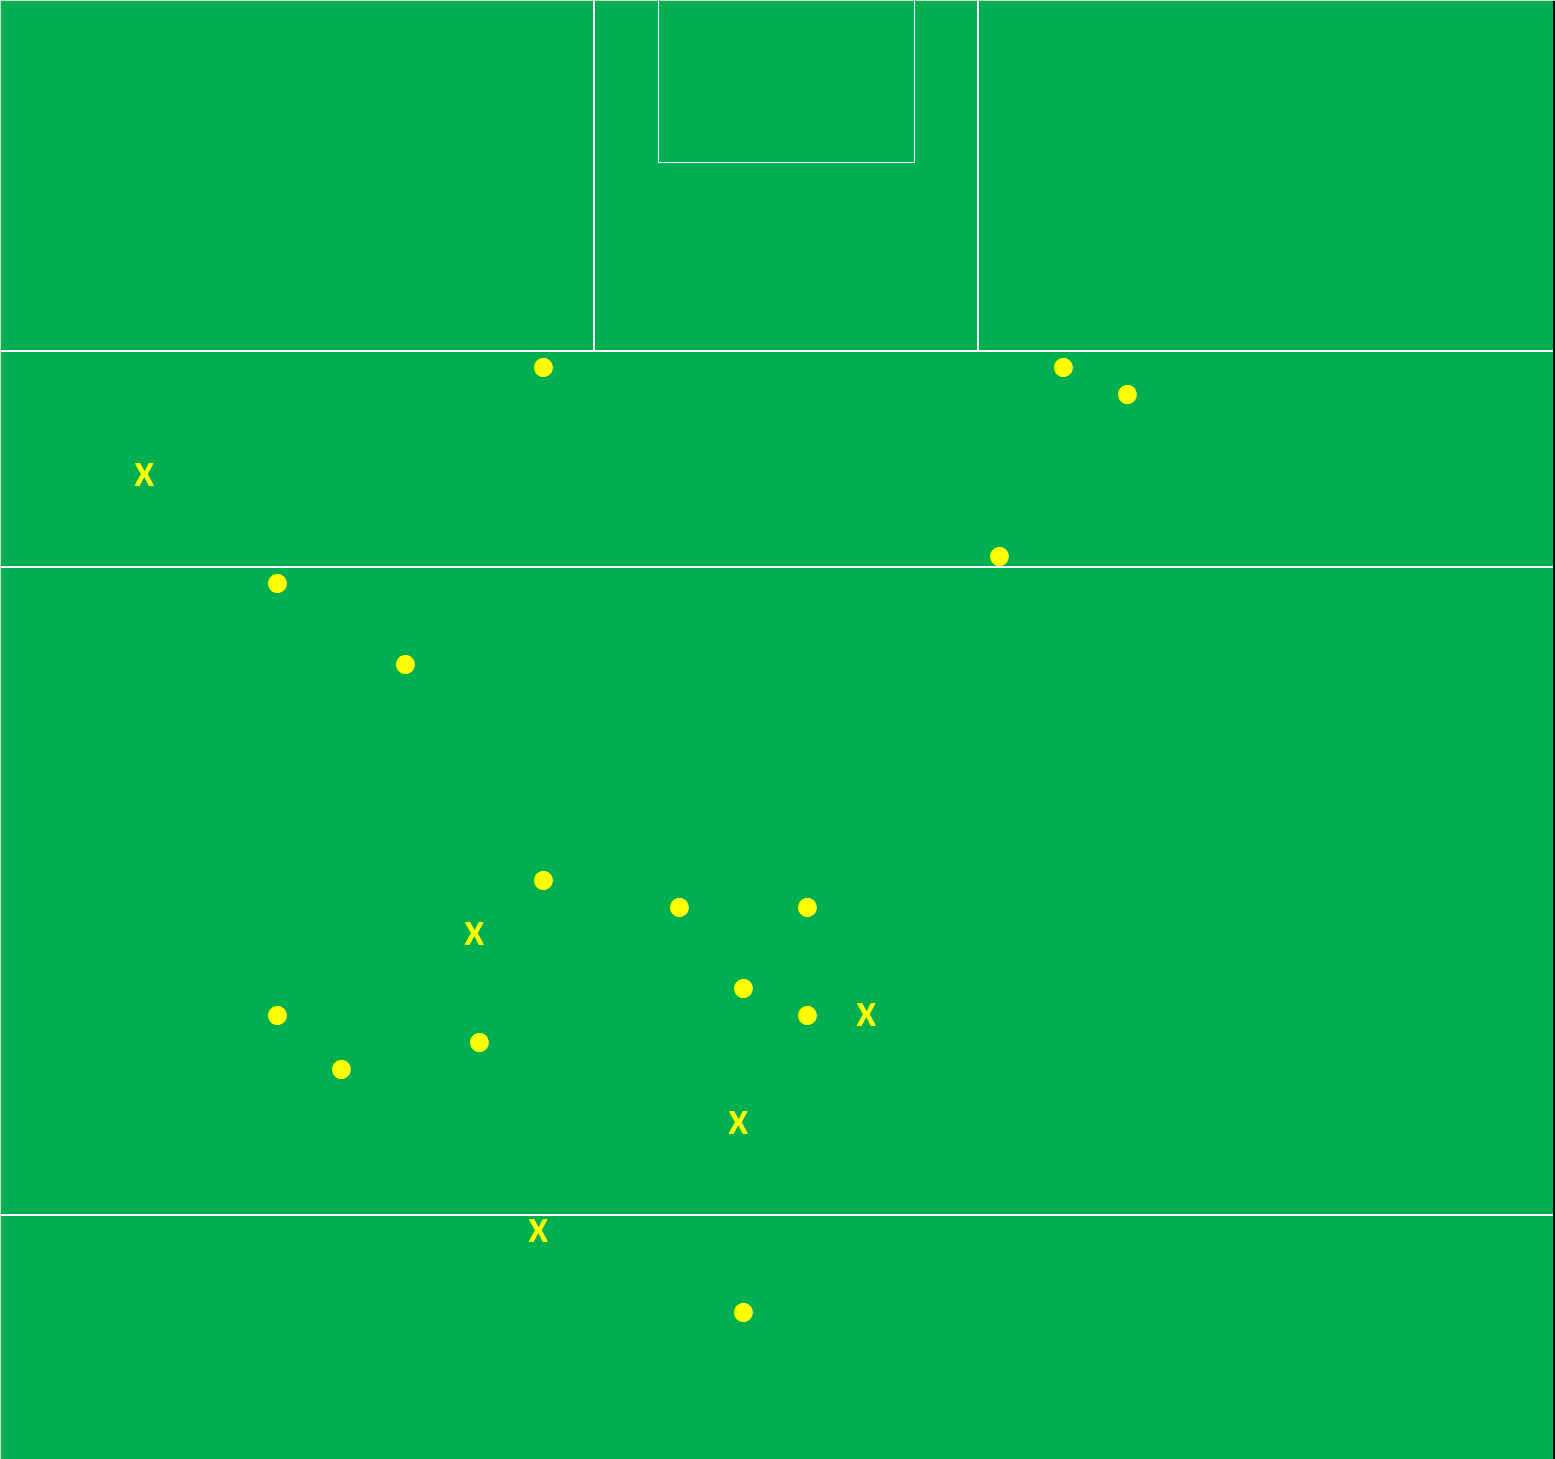
In this guise below is Beggan’s shot map since 2017 (yes that is the 65m coming into view!)

He immediately presents a problem (one that we only really see elsewhere with Paul Broderick from Carlow) in that his “outside” shooting is very outside. Given that all attempts from beyond the 45 are placed into three zones based on the width of the pitch no consideration is really given to angle or length. And we can’t really model the returns as there are so few to compare against. It is therefore possible (probable?) that Expt Pts is underselling his performance.

To overcome this I’ve layered another zone so that instead of just “inside” and “outside” we now have “inside”, ”outside” and “ultra” (open to better names!!!). The “inside”/”outside” demarcation was subjectively arrived at after reviewing games. The below “ultra” outline is similarly subjective in nature. It could be moved 1 metre either way. Two metres perhaps? But looking at Beggan & Broderick’s shot maps we do have to introduce the concept so the below is as good an educated guess as any as to where to apply the line.

Individual players
Using these three ranges we now have new averages – 90% for inside, 58% for outside and 34% for ultra. Using these new ranges gives us a very different view of some players

Dean Rock

Mister consistency. Rock is second on the Conversion Rate ranking and first on Expt Pts. He is not padding his stats with short range efforts either. 71% of his attempts are “inside” and, whilst above average, his returns at 93% from this zone are not earth shattering. There are plenty with similar returns. What he is very good at is knowing his range – only two from “ultra”, which were out wide rather than long, with a lot of the “outside” attempts being centrally around the 45. This all aids his excellent 78% from “outside”.

On top of the mere accuracy we must note that 38% of his attempts have come in All Ireland finals and semi-finals. Preliminary work (here) has shown that game state can have an impact on a free taker’s returns. Given the sheer number of big game he has been in it is even more impressive that he has maintained this level of consistency.

Rory Beggan

No. 1 on “outside” shooting, from those with any volume, plus maintaining an above average return on the “ultra” length (40% versus a 32% average without his attempts included). The idea of a wrong side (right footer from the right) dissipates when we are shooting from such long range distances as the narrowness of the angle of the goalposts lessens, however it is still evident in Beggan’s chart. He is deadly centrally (80%; 0-16 rom 20) but if we draw a line up from the edge of the D he is 42% (0-07 from 17) on the right and 55% (0-06 from 11) on the left.

But that is nit picking. His abilities – such length whilst maintaining above average accuracy – is unique and is a deadly weapon. Quite apart from his accuracy just the threat of him means where you foul Monaghan has to come into any opposition team talk – which gives their inside forwards that extra split second to make their runs.

Conor McManus

We can’t talk about Beggan without reviewing Conor McManus. His returns were those that surprised me the most as my go to image of him is always hitting monster points from ridiculous angles. But that image hides a lack of consistency on his free taking; 84% “inside” is poor when you consider the volume he has taken from there.

Now there are mitigating factors. There are five misses from the right (wrong side) which indicates a lack of a reliable left footer whilst the subjective placement of the “inside” line goes against him. A metre further in and five of his misses would transfer from “inside” to “outside”. On top of the five misses inside from the right there are another two “outside”.

There are also another ten misses around the 45 which, when we compare to Beggan’s success there, make no sense as to why he would be taking them. They are obviously outside his zone. But the majority of these were pre Beggan becoming who he is. Eight of those ten central “outside” misses came in the 2017 campaign. Beggan had 12 attempts in total that year. McManus has more or less relinquished those efforts from which he is weakest from.

Seán O’Shea

The GAA’s own holy trinity is completed by Seán O’Shea. His unerring accuracy “inside” gives him a path to overtaking Rock on Conversion Rates but he will want to tidy up the “outside” shooting, especially just to the right of centre, to completely pull away from the other two in Expt Pts

Paul Broderick

Perhaps the most surprising entrant; he is the only member on the list outside of perennial Division1 & 2 teams. That in itself is a testament to the volume of games Carlow have played on their recent journey as well as their willingness to let him have an attempt given his accuracy.

Comments will become repetitive as we go through the players. He knows his limitations so doesn’t take them from the wrong side. The fact that he is left footed helps as “inside” right footed free takers are easier to come by. Again when the angle widens we can see him try some “ultra” attempts from the left. Prone to lapses of concentration – two of his three misses inside are within 25m on his good side.

Diarmuid Murtagh

His accuracy is good but he has been aided by the majority of his attempts being close and central. Again like Broderick the fact he is a left footer helps as Conor Cox & Ciarán Murtagh were able, in the main, to cover his “wrong side”

Neil Flynn

Neil Flynn took over from Kevin Feely as the main free taker in 2018. Overall conversion rate looks low at 71% but as the chart above shows he is reliable with his only two misses “inside” being from (a) the wrong side and (b) a straight on attempt close to the outside range. Has a weakness from centre to right of D for up to ~10metres outside the 45.

Peter Harte

As a unit Tyrone have struggled but Harte has held his own. Again like Diarmuid Murtagh he is aided by the fact that he is, in the main, an “inside” left footed free taker so does not have to take attempts from the wrong side. Again like Murtagh the majority of his attempts are within a specific close in zone – struggles on the edge of the “Inside” zone.

Shane Walsh

The only man to take frees off both feet (white = left foot above, black = right) and it is a testament to his two footedness that he is up there. The only other player I came across with this level of two footedness was Kevin Feely. Walsh was 94% (0-16 from 17) off his left “inside” and 85% (0-17 from 20) off his right. A bit of inconsistency with close in misses whilst Galway could develop a wide/long range shooter to take some of the pressure off as he struggles wide outside

Ciaran Murtagh, Conor Cox & Conor McAliskey

Murtagh & McAliskey had four attempts between them in 2019 whilst Cox’s volume is too small to extract too much from. All three come out with average returns on Expt Pts. Once again a reminder that average here is not bad – this is average in the context of the best players in our game in possibly the era with most collective accuracy ever.

Niall Morgan

Niall Morgan has an obvious comfort zone right of centre around the 45 (81%; 0 – 09 from 11). Everywhere else he has struggles (15%; 0-02 from 13). Playing amateur psychologist Tyrone see these as shots to nothing but there are consequences to such low returns – are they affecting Morgan’s confidence? Could Tyrone have scored more than 0 – 02 if they had gone quick with these attempts? Low volumes but poor enough game management.

Michael Murphy

Michael Murphy’s overall Conversion Rate at 66% is low but the perception, or mine at the very least, is that this was ok given the volume of his long range efforts. To some extent this is true as just under half (36 of 74) of his attempts come from “inside”.

And he is as good as the next man from “inside”. But this perception hides the fact that his long range shooting has not been up to scratch. He is, or at least has shown in Championship, that wide left, when he has, from distance, to swing them in, does not suit him.

For “outside” his returns of 45% are well below the average of 57%. Even more so when compared to those of the holy trinity – Rock, Beggan & O’Shea combined for 71%; 0-55 from 77.

Cillian O’Connor

In many ways Cillian O’Connor is the hardest player to peg. And the most surprising. I wrote on this subject, in what feels like a different lifetime, back in 2016 when O’Connor came out on top. He was the Dean Rock of 2013 – 2016. But this portion of his game has obviously regressed from there.

His “inside” shooting is still as metronomic as ever with his only misses coming from the right (due to the fact that Mayo have been unable to rely on a left footed free taker) and two out wide right on the subjective partition line.

The original “inside”/”outside” demarcation was not built on O’Connor’s data but it could well have been. The minute he steps outside that range his returns begin to plummet, from 94% “inside” to 41% “outside. This is the biggest drop of any player with any volume. The cherry on top being that he has missed all six from the “ultra” range.

Mayo have to help O’Connor here. Develop a left footed free taker. Transfer those longer range attempts to someone else. His brother perhaps? If you can’t do either start going short. Do something because what has happened for the last three years hasn’t worked.

Appendix

Note1: We must also understand that there are elements not captured. The impact of weather. The differing grounds. Pressure. Taking a free one point behind in an All-Ireland final is very different than taking one when ten points up in a Leinster final. We know all of these have an impact but that impact is not measured here.
We must also always be cognoscente of the small volumes involved

Note2; Roscommon & Tyrone were chosen given their relative success in the timeframe. We had the main free takers for the other “big” teams. Both of these had made the Super8s in both years

2019 All Ireland Review

September 12, 2019

The preview of this game is referenced throughout the below and can be found here

Overview

• Kerry won the possession battle – but mainly through regaining shots rather than kickouts or turnovers
• They also had more shots than Dublin
• On raw volume Kerry had five shots at goal only returning 1 – 01. Dublin had one and returned 1 – 00. But Kerry had a propensity to foul O’Callaghan to stop the attempts at goal whilst O’Shea popped over 0 – 02 from subsequent 45s
• Dublin were brilliant on the use of kickouts scoring 1 – 10 from 25

Dublin attack

(disc = score, X = miss; yellow = deadball, red = attempt at goal, black = point attempt 1st half, white = point attempt 2nd half)

This is not Jim Gavin’s template. In the four games used within the preview Dublin produced a 62% Conversion Rate on point attempts with 54% coming from “outside”. Here they were 47% (0 – 09 from 19) with 63% (12 of 19) coming from “outside”. Neither are horrendous but when compared to their previous outputs it does look like Kerry knocked them out of their stride. I say Kerry but quite a lot of the poor Conversion Rate was execution. Of their 12 shots “outside” I tagged eight as being taken under little or no pressure. From those eight Dublin managed just 0 – 01

Part of the reason for the “inside”/”outside” split was Kerry’s propensity to foul. They gave Dublin eight shots at goal from frees with six being very central – including four on O’Callaghan (nicely rotated by Kerry – one each for Foley, Barry, Murphy & O’Sullivan). These inside frees are also directly relatable to the fact that Dublin only had one shot at goal. Less shots at goal because Kerry were intent to foul O’Callaghan. More fouls equate to less mayhem (rebounds, pulling up for easy point attempts inside the 20m line) which affects the inside/outside ratio.

On those goal attempts, Kerry only allowing one (frees on O’Callaghan aside) was an exceptional defensive effort. From 2018 (the Super8 games onwards) Dublin have averaged five attempts a game (6, 1, 8, 2, 3, 8, 5 and 7 before the drawn game). Even if we include the O’Callaghan attempt that was pulled back for a free (as an aside this isn’t recorded in the database as the end result of the possession was a shot at goal from a free …) that means that Kerry allowed a shot at goal once every 21 possessions. Dublin had been producing a goal attempt once every 8.5 possessions in the run up to the final. And this would appear to be repeatable as after the Munster final Kerry had allowed only eight shots at goal – or one every 23 possessions!

At a player level Kerry were excellent at nailing down Dublin’s Big3 (O’Callaghan, Mannion & Kilkenny). In the run up to the final they were accounting for 49% of Dublin’s point attempts with an incredible Conversion Rate of 71%. Here they combined for just 0 – 03 off five points. You cannot say that these three were peripheral as they combined for 11 primary assists but Kerry did lock down their shooting. One man who was, in an attacking output sense, peripheral was Scully. He didn’t pull the trigger whilst on the pitch and his only primary assist was the final pass for McCaffrey’s goal.

And yet for all this the strength of Dublin’s panel flowed through with Rock & McCaffrey combining for 1- 06 from 9 shots.

Rock’s numbers were gaudy. Scoring 0 – 10 in an All Ireland is a phenomenal achievement. But we must overlay a little context here. 0 – 07 came from nine deadballs with 0 – 06 coming from readily scoreable positions. He got everything, deadball wise, he was expected to and missed two of his three hard ones; – out wide right with his right and the last kick from on the sideline.

Kerry’s attack

Kerry had two more shots than Dublin (31 to 29). This quite simple statement is not to be taken lightly. Only Mayo, in the 2015 semi final and 2017 Final, had achieved this in the 20 late stage games (QF/Super 8s onwards) in Dublin’s drive for 5.

They were very similar to Dublin on point attempts with 19 in total and 58% (11 of 19) “outside”. Dublin were 0 – 03 from 12 on their outside shooting; Kerry 0 – 04 from 11. Dublin got 0 – 06 on their seven “inside” shooting with Kerry producing a relatively poor 0 – 04 from 8.

(disc = score, X = miss; yellow = deadball, red = attempt at goal, black = point attempt 1st half, white = point attempt 2nd half)

Dublin will look to up their “Outside” returns but Kerry equally have room to improve on the easier “Inside” attempts. Whether they will is another matter – their “inside” shooting has been consistently poor all year; in the four games from the Super8 to the semi final they were 59%. I cannot give a concrete reason as to why Kerry have been so consistently poor “inside”. But it is definitely a thing.

The big divergence on how the teams performed, and executed, was on goal attempts. It is a crude (but effective) read through that Kerry restricted Dublin here by fouling O’Callaghan. So their attempts are somewhat supressed in the raw numbers. Still Kerry produced a very impressive five shots at goal but only returned 1 – 01. Given one of these attempts was a penalty – which are converted at a rate > 80%, the expected return is somewhere in the region of 2 – 01.

In the run up to the final Kerry’s Big3 (Clifford, Geaney & O’Brien) had combined for 51% of their attempts from play with an excellent Conversion Rate of 69%. Here they were again to the fore with 48% (11 of 23) of all of Kerry’s shots from play but their radar was well off scoring just 0 – 03 from those 11 shots. And one of those points was an attempt at goal that went over. Given the shots attempted Kerry left 1 – 00/0 – 03 behind them from these three alone.

Luckily (though in truth luck has little to do with it) for Kerry the rest of the team stood up scoring 1 – 06 from 12 attempts (58%; Expt Pts of +2.19). This was in line with what we had seen in the run up – 52% & +4.0 Expt Pts – and should give Kerry confidence that they can keep the scoreboard ticking over

Aside from the raw numbers perhaps the most impressive element was that these “secondary” shooters attempted Kerry’s final six shots producing 1- 04 from the 55th minute onwards. When the pressure was on the shooters outside the Big3 stood up.

Another man who stood up was Séan O’Shea. Whilst Rock had the headline figure of 0 – 10 his deadballs were, as noted above, average. O’Shea converted all seven of his deadballs including three 45s. We are more certain on the Expt Pts for deadballs than from play and O’Shea returned 0 – 02 more from his seven attempts than the average free taker would score. And that is without overlaying the situational position he found himself in “needing” to keep the scoreboard ticking over just to keep Kerry within range.

Kickouts

Despite the fact that the possession regains were relatively even, at 25 v 23, Dublin are still the Kings of the restart. Getting their hands on the ball is only part of their strength – what they do with these restarts is their real weapon. Here they scored 1 – 10 from the 25 kickouts won, or 0.52 points per possession (ppp). Kerry scored 0 – 08 or 0.35ppp

(slight change in language here. Normally we use the phrase “won” the kickout but we’re using “possession regain” instead as won indicates a positive intervention from the keeper or outfield players. Sometimes teams just get lucky when they “win” a kickout)

In the preview it was predicted that kickouts out past the 45 would break even. And so it was with both teams getting their hands on 12 apiece (Dublin won 8 of their 13 that went past the 45; Kerry were 7 of 11 on theirs). The fear for Kerry was their short ones. They had lost seven in the run up to the final and Dublin were primed to pounce getting their hands on 7% of the opposition’s short ones and scoring off each one.

Kerry did give up two short ones. And Dublin did score off both. But both had gone over the sideline and whilst the two quick points hurt it was not calamitous.

Cluxton gave up his first short one of the year. Tommy Walsh intercepted one out to Cluxton’s left and whilst he composed himself to take a shot off same it was a poor effort. If Dublin give you an easy one, whether it is the 1st minute or the 71st, you have to take it.

(disc = kickout team won, X = kickout team lost; black = 1st half, white = 2nd half)

Looking at the kickout chart Ryan did not shirk from the difficult ones … but those “mid mid” kickouts just around the 45 are lethal. Kerry won all four but you have to imagine that Dublin will be looking to pounce on these come the replay. Compare where those four are compared to where Cluxton puts them when he goes past the 45

All Ireland preview; – 3 key areas (Examiner)

September 12, 2019

The below article was originally published in the Irish Examiner on August 31st (the day before the game)

Dublin’s Goal threat

From 2015 – 2018 teams have had a shot at goal once every 18.5 possessions. Dublin have averaged 13.5 in the same timeframe including once every 11.6 possessions in both the 2017 and 2018 campaigns.
In their three competitive games (ignoring the reserve’s run out up in Omagh) this year, from the Super8s onwards, they have recorded 20 goal attempts; 8 vs Cork, 5 vs Roscommon and 7 vs Mayo. That equates to one goal attempt every 8.2 possessions.

That big a jump in one year represents a clear change in strategy.

The catalyst for this change? Con O’Callaghan. He has been directly involved in 60% of these goal chances (6x shots and another 6 assists in the build-up). Not unconnected is the fact that Dublin have earned 0 – 06 from Rock frees after O’Callaghan was fouled. His ability to hold the ball up also enables Dublin’s marauding midfield duo to join the fray. Fenton & MacAuley have combined for 4 – 01 from five attempts.

Can Kerry contain this goal threat? They will have to. First impressions matter and our first Championship glimpse of this Peter Keane led Kerry team was that of Cork ripping the back line asunder for goal chance after goal chance in the Munster final.

There is hope, however. In the four games since then Kerry have allowed just nine shots at goal – or one every 23 possessions. That is immensely frugal and counter to the general view held of this Kerry backline.

If Dublin get their seven shots at goal, then Kerry will concede in the region of 3 – 02. If the Kerry defence can maintain their current form, they will allow two shots at goal conceding 1 – 00/0 – 02.
Incredibly small differentials – but it is in these margins that All Ireland finals are won.

The Big3

Both teams have a Big3 up front. For Dublin they are O’Callaghan, Mannion & Kilkenny. Kerry’s are Geaney, Clifford & O’Brien. Both sets are producing incredibly accurate displays – whichever trio prevails on Sunday will go a long way to deciding the outcome.

In the aforementioned three games Dublin’s Big3 have accounted for 45% (33 of 74) of all their attempts from play combining for an exceptional Conversion Rate of 70% (3 – 20 from the 33 shots). The average intercounty Conversion Rate for shots from play is 48%.

A quick word on Mannion. Over the years Dublin have had an obvious target of moving their shots in closer to goal. Every Dublin player’s shot map will be much tighter in 2019 when compared to 2016. Except for Mannion. He is their designated “outside” shooter (if such a thing exists). And he is fulfilling that role to perfection. In the three games under review he is 81% (0 – 09 from 11) on point attempts and 0 – 05 from 6 on the wider, longer attempts. If Kerry do drop to protect the goal, they cannot allow Mannion to pick them off from long range.

What of Kerry’s Big3? They are even more central to Kerry’s game plan being responsible for 51% (49 of 97) of Kerry’s attempts from play. This despite Clifford missing the Meath game and O’Brien running into black card trouble. Combined they are running at a barely creditable 76% (3 – 34 from 49).

The fear from a Kerry perspective is just how reliant they are on these three. If Dublin shut them down the back up is O’Shea, the two Spillanes, Moran, Murphy, Tom O’Sullivan. All capable but not “shooters” of the quality to replace the output of the Big3. The rest of the panel have produced a Conversion Rate of 50%. Dublin’s Conversion Rate outside the Big3 is 61%.

Kickouts

It is impossible to preview a big game without considering primary possession. And thus kickouts. Kickouts account for 52.7% of all possessions. To win the game you must have the ball. To have enough ball you must get your hands on kickouts.

There has been quite a bit of commentary on Dublin’s high press and the pressure it applies to the opposition’s goalkeepers. And it absolutely does. But in terms of kickouts retained the raw numbers have Dublin winning 31% of the opposition’s kickouts and 43% of those that travelled past the 45. Kerry have also won 43% of the opposition’s kickouts that travelled past the 45. So, whilst the Dublin press is exceptional it hasn’t produced the volume of raw possessions, in direct comparison to Kerry’s returns, that might be expected.

Dublin do have a distinct advantage in one area; short kickouts. Dublin have not lost possession off a Cluxton short one this year. In big games since 2017 (QF onwards) Cluxton has coughed up just 3 out of 162 short kickouts. Yes, teams drop off. And yes, Dublin possess a wonderful group of ball handlers at the back. But Dublin also have Cluxton. He always has been, and continues to be, the master of the quick restart. And, crucially, he doesn’t overcommit. There are no absolutes, but the numbers suggest he has learned not to press the short one.

Contrast that with Ryan. He is still on a steep learning curve in his maiden campaign. Kerry have gone short 60% of the time but have lost possession seven times. That includes three in one vs Donegal. Dublin have gotten their hands on three of the opposition’s short ones scoring off each (1 – 02). Ryan will come under immense pressure on Sunday. The default, when the pressure comes, must be long.

2019 All Ireland Preview

August 28, 2019

As in previous years we will do a preview of this year’s All Ireland final by reviewing previous games within the year.

The methodology is roughly the same. We have four competitive games for Kerry under Peter Keane – the three Super8 games against Mayo, Donegal and Meath plus the semi-final against Tyrone. We have a lot more for this Dublin team but so as to ensure like for like comparisons I have used Dublin’s semi-final against Mayo, the two competitive Super8 games against Cork and Roscommon (no sniggering down the back) and I have replaced the run out for the reserves up in Omagh with their Leinster semi-final v Kildare (see NOTE1).

When team or player numbers are referenced, they will relate to these eight games unless specifically stated otherwise.

The commentary has a “this is what Dublin do – how do Kerry measure up/defeat them” slant to it. This is the nature of the beast when you are going for 5 in a row.

Possession – the unseen edge

I reference “the unseen edge” above because in the previous four Championship campaigns every three possessions you gather is worth 0 – 01 on the scoreboard (teams scored 0.37 points per possession (ppp)).

In their four games under scrutiny Dublin managed to get their hands on the ball 27 times more often than their direct opponents. The differences ranged from 3 more possessions against Cork (in a game with 81 total possessions) to 11 more against Roscommon (in a game with 91 possessions). If they maintain this in the final it is akin to starting 0 – 02 up.

The makeup of their possessions is interesting. Given their dominant nature (NOTE2) in these games Dublin have had 20 less possessions directly from their own kickout despite having a much higher retention rate; Dublin have retained 81.5% of all their kickouts whilst the opposition retained 70.5%.

How have they made up the deficit then if they are starting from -20 on their own kickout? One area is the aforementioned retention rates on kickouts – Dublin have gotten their hands on 36 opposition kickouts whilst only giving up 15 of their own. Thus, on kickouts in their entirety Dublin are one possession up. We’ll go onto the details later but here is where the mere fact of counting can set you wrong. Yes, their opponents have essentially broken even on kickouts against them – which is surprising given Dublin’s perceived dominance. But it is the type and ratio of kickout that is won/lost that is of vital importance.

The remainder of Dublin’s possession edge is gained on turnovers (+22) and Other (NOTE3) (+4). Dublin’s turnover differential is nearly all achieved inside their own 45. On turnovers outside their own 45, which would be deemed as the most dangerous as the opposition is caught in an attacking mindset, they are only +2 (gained 20 turnovers outside their own 45 but gave up 18 such turnovers to the opposition).

It is somewhat surprising that they gave up the ball 18 times outside the opposition’s 45. Digging a bit deeper Mayo did the damage getting their hands on such ball ten times. The other eight were split evenly (Kildare x3, Cork x3 & Roscommon x2); so, it appears to be just small sample size noise.

What of Kerry?

Unlike Dublin their games have been closer which means that they have, proportionally, taken more of the kickouts (45% in total; Dublin have taken 40%). On the surface this should help Kerry in the possession battle. But Kerry have not been as clinical in their execution either on their own kickout (Retention Rate of 77%) or the oppositions (opposing teams have retained 80%). This in turn means that whilst Dublin came out with a possession total of +1 from all kickouts Kerry come out with a -20.

The good news is that they were aligned with Dublin in pure turnover terms (+19; 89 turnovers won in the four games v 70 conceded) however were slightly ahead of Dublin in where those turnovers were won. 28 were won outside their own 45 with 19 such turnovers conceded.

Revisiting that small sample size noise from the Dublin numbers. What if Mayo’s press identified a small chink? Mayo claimed ten (five of which occurred in the first half when the game was there to be won) turnovers outside their own 45. Kerry, with the oft quoted Donie Buckley link, are not only good here but have obviously worked on what they do when they win such ball. Of the 28 turnovers up the pitch they have produced 21 shots and scored 2 – 13. Of the 21 shots 14 had six or less player touches … they look to strike hard and fast off the turnover.

But for all their good work on turnovers that kickout number of -20 is very concerning. Especially when you consider that they will be up against (a) the best kickout press in the game and (b) the team with historically the best kickout in the game. More of that anon.

When Dublin have the ball

Once Dublin get their hands on the ball what do they do with it? The simple answer is they score. The 10-84 they amassed in the four games equates to 0.58ppp. As stated previously the average for games from 2015 – 2018 was 0.37ppp (NOTE4). And the scary thing is that they are actually getting better.

Last year’s preview touched on a lot of the themes as to how Dublin had increased their Conversion Rate. It is worth re-reading now as a lot of the principles still hold through.

Goals

Dublin are the goal Kings. From 2015 – 2018 inclusive (non-Dublin) teams went for goal every 17.8 possessions. As the above table shows Dublin have, apart from the blip in 2016, gone for goal at a much more frequent clip. But they have been relatively consistent on this going for goal every c11.5 possessions. In 2019 they have obliterated this mark going for goal once every c8.2 possessions. That is a huge change in emphasis.

It is worth noting that they have not been more efficient when going for goals (NOTE5). But they don’t need to be. They are coming away with 1.50 points per goal attempt which is better than can be achieved than going for points. Con O’Callaghan has been the catalyst here with six shots himself but also being directly involved (NOTE6) in the build up to another seven attempts (3x primary assists & 4x secondary assists).

You want to stop Dublin going for goals – nail down O’Callaghan. That’s not to say he’s the only threat. The two midfielders (Fenton & MacAuley) have combined for another six attempts getting a score from each attempt (4 – 02). Only Mannion, of the main strikers, has not been productive scoring 0 – 01 from his three attempts.

To increase your points per possessions you don’t necessarily need to get better at any one thing – if you tweak the ratios to go for the more productive shot more often then you’ll increase your returns.

Point attempts from play

That tweaking of shot types, to eke out more efficiency, leads us to Dublin’s point taking. The below shot chart is taken from 2016 and contains Dublin’s point attempts for the four games from the QF onwards

Every team will have a different shooting zone (as an example I used a completely different zone when previewing last year’s final). For illustrative purposes I use the red dotted line to denote “inside” and “outside”. I’m sure internally Dublin’s is different, but we can work with this. In 2016
• Dublin had an overall Conversion Rate of 45%
• 21% of all their point attempts came from “inside”
• They produced a 76% Conversion Rate “inside” and 37% “outside”

Now let us look at the same chart for 2019

Even visually you can see the change – the “inside” is so much more populated. There are no shots inside the 20m line from out wide. But to put some comparative meat on the bone
• Dublin now have a 62% Conversion Rate
• 46% of all their point attempts were from “inside”
• They have recorded a 74% Conversion Rate “inside” and 52% “outside”

Want to improve your points per possession? Go for goals, which are more productive per shot, more often whilst maintaining the Conversion Rate. Move more point attempts “inside”, again maintaining the consistency whilst also improving your “outside” shooting.

Kerry have their big three in Geaney, Clifford & O’Brien. For Dublin this year it has been Mannion, O’Callaghan & Kilkenny. Between them they have taken 49% of their point attempts with a whopping combined Conversion Rate of 71% (0 – 30 from 42; Expt Pts of +10.15). That is amazing consistency.

Con O’Callaghan again shows up well on the point taking tables with a 70% Conversion Rate (0 – 07 from 10; Expt Pts +1.82) and 11 primary assists. Combined with his involvement with the goals and he has become a central cog in what Dublin do.

But Paul Mannion has topped him in terms of accuracy with a Conversion Rate of 76% off a whopping 21 point attempts. That despite him being Dublin’s ostensible outside shooter.

Elsewhere Niall Scully has been the assist machine being directly involved in the build up to 25 point attempts and six goal attempts

Deadballs

And just to top it all off introduce a red hot Dean Rock during the Super8s. He is 95% (0-20 from 21) on deadballs with his only miss being deep in injury time against Mayo out wide left just to kill the clock.

On Rock. In the lead up (QFs, Super8 & SFs) to the AI final in the last three years he has been imperious recording a 92% conversion rate (0 – 36 from 39) on frees with an Expt Pts tally of +4.81. He has dropped off in the finals however returning just a 73% Conversion Rate with an Expt Pt of -0.20.

He is the best free taker bar none. He has shown his metal in 2017 when slotting the winning point deep into injury time. But he is human and has shown it previously when we enter the finals.

What of the Kerry defence?

Have we seen anything from Kerry to show that they can disrupt this process?

In the four games under scrutiny they have only allowed eight shots at goal including two penalties. That is an excellently frugal one attempt every c23 opposition possessions. If Kerry can keep Dublin to their pre 2019 standards of 1 goal attempt per every 11.5 possessions that should see Dublin at 4 shots at goal (assuming a c90 possession game). Meet somewhere in the middle of the 8.2 attempts from Dublin and 23.2 allowed by Kerry and you are at three attempts. Using Dublin’s conversation rates 3 attempts comes in at 1 – 01; four attempts and you are at 2 – 00. Any more than that and Kerry are staring down the barrel of a defeat.

Dublin have attempted 23 point attempts from frees or one every 8.6 possessions. Kerry have allowed the opposition to take 24 shots, or one every 7.7 possessions, at goal from frees. These 24 included three from outside the 45 (2x M Murphy, 1x C O’Connor). Whilst Rock is capable of slotting these over he knows his range and generally doesn’t take them from out there. Removing these three longer ones reduces the rate to one every 8.8.

All other things being equal you want to avoid giving Dublin, and Rock these easy points. Foley, Murphy & Crowley will need to be cognoscente of their tackling as they have given away four shots at goal, from fouling, apiece. On top of that O’Callaghan is the most fouled player for Dublin (he’s won 6 shots at goal from frees – the next best is 2).

Stop Dublin going for goal. Especially O’Callaghan. But don’t foul him. No problem!

That leaves us with Kerry defending point attempts. At a macro level this has been very poor this year. Opponents have converted 66% (0 – 45 from 68) of all point attempts from play scoring in excess of 0 – 11 more than what those 68 shots would be expected to record.

However, when we look at the shot graph for these 68 point attempts what is striking is just how good teams have been from “outside”. Between them Kerry’s four opponents have combined for a whopping 62% (0 – 24 from 39) Conversion Rate “outside” which, for context, is miles ahead of Dublin’s 52%. And I can find no good reason for it other than Kerry have been on the wrong end of some excellent shooting. Will this continue in the final? Anything is possible in a one-off game against Dublin. But what it does indicate is that the Kerry defence has not been as poor – or porous – as the final scoreboard(s) indicate.

You can begin to see the bones of an argument as to why Kerry’s defence can hold Dublin. Restrict Dublin to four goal attempts (Dublin have averaged six, Kerry have given up two) with them scoring 2 – 00. A point attempt from a free every 8/9 possessions should yield Dublin 0 – 04 to 0 – 05. Give them the “inside”/”outside” ratio that they have enjoyed to date but restrict them to 19 shots (Dublin have averaged 21.5; Kerry have allowed a lower). That equates to 0 – 11 from play. You are now at 2 – 15 … possibly 1 – 16. And assuming your attack shows up you are in the game for 80 minutes.

When Kerry have the ball

So what of Kerry? Whilst not as stellar as Dublin their attacking returns have been very positive

If we assume 50 possessions each then just using the baseline metrics above Dublin come away with 24.4 scores (50*83%*84%*70%) whilst Kerry come away with 21.9 (50*83%*80%*66%). Using the points per possession its Dublin 29 points and Kerry 25 points. That’s not to say that this is how the game will end (that calculation is as rough as a badger’s a*se) but it does show that the Kerry forward line are not a million miles behind perhaps the most accurate front line of all time.

Their goal attempts – perhaps surprising given an inside line that consists of Geaney and Clifford with O’Brien on the burst from the half forward line – has been an issue, however. Not so much the execution but the volume. They have only managed nine attempts at goal over the four games which contrasts starkly with Dublin’s 24. Again, their Conversion Rate is very good (56% Conversion Rate and 1.89 points per attempt) but the volume just isn’t there. Playing it safe when in front of goal? You feel this is something that Kerry will have to up in the final. Either they have to take the two chances they get, or they have to go for goal more often and come away with 2 – 00 from four attempts rather than 1 – 01 from two goal attempts and two point attempts.

Whilst not quite in the Dean Rock mould Séan O’Shea has been very good on deadballs returning 83% (0 – 20 from 24) and scoring about 1.5points above what would be expected from his attempts. Very solid. Just like Rock he will have to prove he can do it in the white heat of an All-Ireland final.

Kerry’s point taking has been a smidgen off Dublin’s with a combined 59% (0 – 52 from 88). That is still excellent returning about 8.5 points above what was expected. But that could be even better if they were more careful on their “inside” shooting.

They’re “outside” shooting at 56% (0 – 29 from 52) is better than Dublin’s – which, as we have noted, has taken a huge leap from where they were at in 2016. It is their “inside” shooting at 59% (0 – 23 from 39) that is hurting them. It is almost as if the mind wanders when they get inside thinking the job is down. They have the outside shooting to compete with Dublin – they need to pop those easier points or alternatively turn some of those closer in shots to less secure goal attempts.

Kerry’s big three (Geaney, Clifford & Stephen O’Brien) returns are eerily similar to Dublin’s big3 attempting 49% of all of their point attempts for a combined Conversion Rate of 70% (0 – 30 from 43; Expt Pts +9.01).

Like Mannion O’Brien has been on fire with a 90% Conversion Rate (0 – 09 from 10 Expt Pts of +3.62) whilst he has been very high up on the assist chart with 16 primary assists (1x goal attempt, 9x point attempt and 6 frees won).

Dublin’s defence

Dublin have only allowed nine goal attempts in the four games tightening as they’ve gone along (3 v Kildare and Cork, 2 v Roscommon and 1 v Mayo). Stephen Cluxton has again shown just how good he is by producing five saves from those nine shots with the only ones getting past him being an outrageous piece of skill from Lee Keegan and a penalty from Luke Connolly.

Dublin have only coughed up 13 shots from frees (John Small x3, MD MacAuley, B Fenton, C O’Sullivan with two apiece) in the four games which equates to one every 13.1 possessions.

On point attempts they have allowed more or less what is expected; 20 per game with a 51% Conversion Rate allowing an Expt Pts of +0.94

All very simple and concise compared to the in-depth detail above. But only because Dublin, like on offence, do the basics very, very well. Don’t offer up the goal attempts. When tackling do so properly – or at least if you need to foul don’t do so inside the scoring zone. Only give up what is expected from point attempts.

For Kerry’s attack let us assume things stay as they are. The Dublin defence do their thing whilst the Kerry offence does theirs. Kerry will get two goal attempts (Dublin have allowed nine in four games; Kerry have attempted nine) resulting in 1 – 00. Kerry win five shots at goal from frees (somewhere between the one every 7.5 possessions that they earned, and the one every 13 possessions Dublin have allowed) scoring 0 – 04. Kerry take 21 shots from play (Kerry have average 22 point attempts whilst Dublin have allowed 20) with a Conversion Rate somewhere in the mid 50s which comes in at 0 – 11/0 – 12.

All things being equal Kerry score 1 – 15/1 – 16. Their defence stands up as previously outlined allowing 2 – 15/1 – 16. Just saying ….

Kickouts

Attempting to show how Kerry can stay in, and even win, the game is conditional on a lot of things, plausibly, going their way. Contain Dublin to four attempts at goal. Foul at a “normal” rate. Allow point attempts at a slower rate than Dublin have taken to date. Up either the goal attempt volumes or the accuracy. Outside shooting efficiency against them to regress to the mean. Maintain their high attacking efficiency.

But that is all superseded by one larger condition that also needs to break Kerry’s way. We touched on it earlier when looking at the possession volumes – Kerry absolutely need to break even in terms of possession volumes on kickouts. [A gentle reminder that they were -20 on kickout possessions compared to Dublin’s +1. Despite having more kickouts in games than Dublin]

Dublin kickouts

The kickout details for both teams are in the Appendix. Unsurprisingly Dublin have not lost a short one. I say unsurprisingly as in the eight games that comprised the QFs onwards in 2017 and 2018 Dublin lost just three short kickouts – a combined retention rate of 97.5% (retained 118 of 121).

If they get their hands on one of your short ones lookout – they got one each against Cork, Roscommon and Mayo scoring off all three. Those three equated to 7% (3 of 46) of all short kickouts faced. This success rate is a step up on previous. In the aforementioned eight games in 2017 & 2018 they got their hands on 5% of the opposition’s short ones (6 out of 103) but only came away with 0 – 02.

In the four games there have been 116 kickouts past the 45 with Dublin gaining possession 50% of the time. That may seem poor enough, but they were 63% on their own kickout and 43% on the opposition’s. Dublin may have a fearsome press, but the opposition have been getting their hands on the ball

Kerry kickouts

Intriguingly enough Kerry have also won 50% (40 of 80) of kickouts that went past the 45. They had similar splits to Dublin in that they won 58% of their own kickouts and 43% of the opposition’s.

The problem, and the fear, is that they have lost seven short ones in the four games played. Seven. Compared to Dublin’s zero. And not in any one game where they had a systems malfunction either. They have lost at least one short kickout in every game. Indeed, they lost two vs Tyrone and three vs Donegal.

As stated at the very start I was worried for Kerry winning primary possession on kickouts. I still am but if they can force the majority to go past the 45, they can break even. But if they continue to press the shorter ones (60% of their kickouts have been short) then they have a propensity to cough up the ball which will be calamitous against this Dublin team.

Prediction

I have faith in the Kerry brains trust. Although under different management they came with a plan against both the Dublin kickout in 2016 and the Donegal kickout in 2014. I believe they will lose the possession battle here by two or three, as Dublin get a few short ones off quickly, but they will avoid any obvious calamitous errors.

They will break even in terms of turnovers. The game will be a relatively open 92 possession game (Dublin games averaged 91.75 possessions; Kerry’s 93.5) with Dublin winning that battle 47 – 45. Then the fun starts. On current point per possession trajectories that has Dublin at 27 points (47 possessions x 0.58). I don’t see that – as outlined I can see the Kerry defence being stouter than anticipated. If it “drops” (drops is a relative term here!) to the 2018 level of 0.52ppp that brings them into the 2 – 18/2 – 19 realm. To get down to the projected score I have for Kerry of 1 – 16 then Dublin’s ppp needs to drop to 0.40. Which I just can’t see.

Kerry to be closer than people think but Dublin to win 2 – 17 to 1 – 16

NOTE1 By right I should have used the Leinster final v Meath as a more “competitive” game however Meath’s shooting was so poor that it would affect the overall averages. Plus Kildare went in at half time only four down, so it was competitive enough to spark the familiar second half surge from Dublin.
NOTE2 Dublin’s opponents tend to have more kickouts due to the sheer volume of shots Dublin take. You retain your own kickout at a much higher rate therefore if the opposition has a lot more kickouts they should have a higher volume of possessions from same
NOTE3 Other is defined as Throw Ins at the start of halves or shots blocked, off the post etc. regained by the attacking team
NOTE4 Remove Dublin’s returns from the equation and that drops to 0.36ppp
NOTE5 Dublin can have a higher points per attempt in 2019 compared to 2018 with a lower Conversion Rate as points scored off goal attempts are not included in the Conversion Rates but are in the points per calculation
NOTE6 Assists here are still defined by being on the ball – actual passes. Runs off the ball are probably as important – especially for goal attempts – but we’re not quite there yet.

APPENDIX
Dublin kickout data

Kerry kickout data

Updated Raw Expt Pts post 2018 Championship

November 22, 2018

The last published Expected Points (Expt Pts) numbers are contained here. I would strongly recommend that everyone, whether you are currently using Expt Pts or not, (re)read this piece as it outlines the methodology used and more importantly the inherent weaknesses in the numbers.

Changes since last publication

Those numbers were produced in early 2018 but had not baked in the 2017 returns … so in effect were created off Championship data up to and including the 2016 season. Some 70 Championship games have been added to the database since then so it is time to update the numbers.

A quick review of some changes

a) Firstly all attempts, inside Section 8, have been coded as being with the hand or the foot. This does not get anywhere near representing the quality of goal chances but, as can be seen in the differences for both, is a worthwhile change.

b) Secondly the raw averages have been dispensed with and instead a weighting is now in effect; 30% of total outcomes are taken from the two most recent years with 20% each for the two years preceding this. What is happening in more recent years is more prevalent in the Expt Pts output but we spread the return across the four most recent years to ensure any one year change/blip does not completely overwhelm the model.

c) This is the case except for rarer shots (sideline attempts, 45s, penalties etc.). For these we take all the shots in the database rather than applying the weighting. This gives us more certainty on the numbers.

Outcomes
Yes. Yes. Yes. We understand – just give us the bloody numbers …

Caveats
As ever Expt Pts is not the be all and end all. It is another tool to use when honing in on shooting efficacy. One tool (albeit a better one than Conversion Rates). No more, no less.

Consider these numbers as “Raw Expt Pts”. No overlay. No subjectivity. They are the product of the 80:20 rule. A newer model, which overlays strength of competition and game state, is currently in production. The thought behind this updated version is expanded upon here.

That will undoubtedly produce better numbers but it is not necessarily something that can be transferred easily to club football. As such the numbers here are better in that respect.

Happy statting.

O’Connor & Rock from frees (Rd3 of league)

March 3, 2017

From an analysis and review standpoint I am forever railing against recency bias. This “railing” comes about however because of its pervasiveness. It’s an in-built near automatic response. And of course I fell into the trap myself.

Watching the Mayo – Roscommon game last week Cillian O’Connor missed a central free about 33metres out and I had immediate flashbacks to (a) a number of missed frees in the previous round against Kerry and (b) that missed free in last year’s All Ireland final.

Was this latest missed free a sign of some cliff having been reached? Was one of Mayo’s most consistent weapons beginning to malfunction? Of course not.

oconnor-post-rd3

In the three league games to date O’Connor has hit 79% of his frees. Well above the ~72% Championship average. On Expt Pts his tally is -0.39; he has basically scored what is expected. Now the argument could be made that someone with O’Connor’s reputation should be in positive Expt Pts territory. Fine. However we must always remember that the Expt Pts tally is based off Championship returns. Frees taken in (mainly) pristine weather on (mainly) pristine surfaces. O’Connor is fine. To be slightly off in the middle of the league is acceptable? For comparison Dean Rock is running at 75% conversion rate with an Expt Pts tally of -0.86.

rock-post-rd3

What I did argue however in last year’s All Ireland review is that O’Connor had an arc outside of which he was vulnerable (the missed free in the drawn All Ireland being right on this arc). Given weather, pitch conditions etc. it is fair to expect that arc to contract at this time of year and if we placed this contracted arc over O’Connor’s frees to date then I would suggest that arguement is still relevant. He has taken 6 frees on the edges of this constricted arc and converted 3 – 50% Success Rate. He has also missed his only 45.

So in conclusion – bloody recency bias!! But O’Connor is generally fine and still remains one of the most consistent free takers once within his range.

Early Conversion Rates are poor – why?

November 10, 2016

Early Conversion Rates

Whilst uploading the 2016 data into the database I was noodling around in the numbers and produced a simple chart for production on Twitter.

graph-1-overview

Something was quite obviously happening in the first 10 minutes that saw the cumulative Conversion Rates much lower than the average. There were two initial thoughts

1. a number of “lower level” teams were dragging the average down early in games (either through just poor shooting or an inability to get “quality” shots off against better teams early on when the scoreboard was close)
2. shooting types, and where shots were being taken from, were so different in the frantic opening periods of games that the early Conversion Rates were being skewed

Upon doing some more superficial digging it appears that neither were the case

1. Conversion Rates by teams

graph-2-by-team

The phenomenon (of Conversion Rates being lower early on) was observed in three of the four semi-finalists (NOTE1) whilst all other teams followed the overall trend to a tee. The only outliers – unsurprisingly – were Dublin.

2. Expected Points over time

graph-3-expt-pts

The above is a replica of the Conversion Rate chart but replacing Conversion Rates with Expected Points (Expt Pts). Although the shape of the chart is different than the original the occurrence of poor early returns is still evident. And by using Expt Pts we remove the shooting types as an issue as Expt Pts bakes in the difficulty of a shot (NOTE2). All shots are being converted at a lower rate than expected until around the 30th minute but teams are noticeably struggling in the first 15 minutes.

Conversion Rates by shot type

So the phenomenon is real but cannot be attributed to a specific team type nor to shot selection/execution. It is across the board except for Dublin. Three shots types – free kicks, point & goal attempts from play – make up ~97% of all shots. Is there anything we can determine from investigating these shot types independently to explain this poor shooting in those early exchanges? And is there anything therein that explains how Dublin are managing to avoid this poor shooting early on?

Free kicks

graph-4-by-free

This is probably the most surprising, and hardest to attribute, of all the results. When the very first chart was produced on Twitter I mischievously suggested that whatever all the back-up teams were doing to get teams warmed up they needed to change it. There were some good responses re the intensity of teams, especially in the pressure applied to shots, being higher early on. Or that teams were defensively more conservative early on leaving less space for clear shots. All plausible and probably have a grain of truth. However none applicable to free kicks – and the phenomenon of poor conversion rates early on is noticeable here too.

Now by slicing the volumes into the first 10 minutes of one season’s games we are running in to sample size issues. Specifically for this segment the volume is 47 so this comes with a rather large health warning.

Assuming games are now 80 minutes the first 10 minutes make up 12.5% of the game; the 47 frees in the first 10 minutes make up 13% of all frees. On top of that the two main free takers – D Rock & C O’Connor – make up 21% of all frees in the first 10 minutes whereas they make up 25% of all frees in the database for 2016. So the first 10 minutes, low sample size and all, are representative of the whole year. So what happens in those opening 10 minutes?

Shots Scores Expt Pts Conversion % v Expt Pts
All frees 47 29 32.8 62% -3.8
Rock & O’Connor 10 9 7.8 90% +1.2
Others 37 20 25.0 54% -5.0

What the above table shows is that Rock & O’Connor were on point from the get go. Overall for the year they combined for an 86% Conversion Rate and in the first 10 minutes they were 90%.

If the two main protagonists were on point the rest of the free takers must be dragging the averages down from 71% overall to 62% in the first 10 minutes. And as the table shows this is the case. Indeed they were very poor returning a paltry 54% (the 80 minute average for all free takers outside Rock & O’Connor was 66%).

And this somewhat negates the argument for lower Conversion Rates early on being affected by what the opposition’s defence is doing. The opposition can’t really affect free taking. Outside of Rock & O’Connor it looks like free takers were just not ready early on (NOTE3).

Points from play

graph-5-from-play

The Conversion Rate for 2016 was 44.2% and for the five years from 2012 was 45.8%. For the first 10 minutes of 2016 games the conversion rate was 36% and only rose to a cumulative 38% by 20 minutes. Again the Expt Pts was lower in the first 10 minutes (-15.70) as against the remainder of the game (+5.84).

I do track whether a shot was taken under pressure however have only used it anecdotally to date as it is a simple “Y/N” flag and is probably not nuanced enough for any concrete use. Having said that however there is only one person applying the flag so we would expect a certain degree of consistency of application across the ~1,000 shots tracked here.

In the first 10 minutes I charted 53.6% of all point attempts occurring whilst under pressure. The remainder of the time it was 54.2%. Near enough as makes no difference.

So the poor shooting for points from play is real, is not linked to poorer shot types (as evidenced by the Expt Pts return) and from the empirical data we have is not linked to greater pressure applied earlier on in the game. I am completely open to the intensity of the pressure being different early on (NOTE4) but if this was the case you would expect some uptick early on in the percentage of shots marked as taken under some/any pressure in this timeframe. There is none.

There may be other non measurable factors such as nerves (these are amateurs after all) but as of now I can’t come up with anything other than the aforementioned “mischievous” reason that players are just not at peak performance early on. Maybe this is to be expected?

So what of Dublin? We saw that their early conversion Rates outperformed everyone else. This is in part due to the fact that Dean Rock went 5 from 5 on his frees but how was their shooting from play?

Shots Scores Expt Pts Conversion % v Expt Pts
Dublin 23 9 10.2 39% -1.2
Mayo 28 8 12.0 29% -4.0
Tyrone 19 8 8.7 42% -0.7
Donegal 17 4 7.4 24% -3.4
Tipperary 13 5 6.8 38% -1.8
All first 10 179 65 80.7 36% -15.7

Again volumes are low (NOTE5) but Dublin were no great shakes early on. Yes they were above the average for the first 10 minutes but they still underperformed when compared to the whole game average and their Expt Pts – like all the teams above – was below 0.00.

Perhaps the most striking return here is Mayo. From the 10th minute onwards they were exactly in line with Dublin (Mayo 49% on 126 shots with an Expt Pts of +5.59; Dublin 49% on 132 shots with an Expt Pts of +5.54) but for those first 10 minutes they were much poorer.

Another theory for the poor start was not where teams were shooting from but who was shooting – less pressure on returns early on so midfielders/defenders were more inclined to “have a pop”. So I had a look at Mayo’s shot distribution. In the first 10 minutes 64% of their shots came from what I would state are obvious offensive players (A Moran, A O’Shea, J Doherty, A Dillon and the two O’Connor’s). From the 10th minute onwards, and adding E Regan, C O’Shea and A Freeman to this mix who didn’t have a shot in the first 10, these forwards accounted for 60% of point attempts (NOTE6).

It is difficult to attribute offensive/defensive tags to all players in today’s game but if there was a decisive split in who was shooting for teams you would expect it to show up in the team with perhaps the worst split. But it doesn’t.

Goal Attempts

graph-6-goal-attempts

To be honest I am just including the above for consistency and to help explain Dublin’s apparent ability to start faster than others. Whilst I have consistently cautioned against low sample sizes it is an overarching feature of this shot type and can explain a lot of the variance within the five minute groupings above. In total there were 137 goal attempts with just 15 in the first 10 minutes and 36 within the first 20.

Having said all that …. the Conversion Rate for goal attempts was 53% in 2016 and only crawled up to 40% after 15 minutes. With the evidence we have teams again were not converting on goal attempts early on in games.

Dublin? They had six goal attempts in the first 10 minutes scoring 3-00. 50%. And there is their apparent early start in a nutshell. They were 50% on goal attempts, 100% on deadballs (as well as Rock’s aforementioned frees he was 2 from 2 on 45s as well) and slightly below average at 39% on point attempts – giving them the aggregate of ~52% early doors.

Overview

This is based on one year’s data (NOTE7) but poor early conversion rates were definitley a “thing” that year

There is no evidence that shot selection (through Expt Pts), opposition pressure (through the simple “Y/N” flag) nor type of shooter (using Mayo as an example) is any different in the first 10 minutes to the rest of the game

It is also evident in early free taking, except for the very best in Rock & O’Connor who were on point from the very start, which somewhat nullifies the theory that it is something the opposition is doing to affect the shooting.

There are undoubtedly other factors at play. Some can be measured; first shot in the game, effect of new surroundings, debutants vs more experienced players, intensity of pressure. Some we may never be able to measure – nerves, mentality of players early on versus later in the game, etc.

But as of now, and taking all of the above into account, I cannot escape the initial gut reaction that players are just not ready – for whatever reason – early on

NOTE1 – we need to be careful with any segmentation. There are only 1,640 shots in total being reviewed here with 249 in the first 10 minutes. Segment that further by team and you get some ridiculous numbers; Kerry just have the 7 shots across two 2016 games; similarly Tipperary only have 16 shots in the same timeframe. You can’t make any judgements on those numbers. In truth I would not normally use a chart with such low volumes but I include it here as it was the chart that sparked me into looking deeper into the issue.

NOTE2 – for more on why this is so please see here

NOTE3 – I had a further look at the non Rock & O’Connor frees to see if any one player was having an effect. There was none really. 34 of the 37 were a player’s first attempt in the game which makes sense as it is uncommon for a team to have two shots at goal from a free in the opening 10 minutes.

This leads to a further corroboration that could be investigated – across the year’s how does a player’s very first free kick equate to the rest of their results?

NOTE4 – I started to grade pressure on a sliding 0 – 3 scale for the two All Ireland finals. It feels a lot more robust as having to apply a grade makes you stop and think. It will be very instructive from here on in but as of now I’m not inclined to go back over the entire season to retrospectively apply the grade(s)!

NOTE5 – This table lists all the teams with >10 shots from play in the first ten minutes. Again we are running into sample size issues.

NOTE6 – the non offensive players with a shot in the first 10 minutes were B Moran, D Vaughan, K McLoughlin, L Keegan, P Durcan & T Parsons. Other defensive players with shots post the 10th minute were C Boyle, K Higgins, S O’Shea, S Coen, B Harrison & K Keane

Note that whilst some of these could be moved into the “offensive” pot their individual shot volumes are such that it wouldn’t make a material difference to the overall point.

NOTE7 – why one year? Because for some unknown reason I didn’t track the time (outside of 1st half/2nd half) for previous years. Hell of an oversight in retrospect! The only reason I started in 2016 was I was so bored of looking at kickouts so decided to look at the rest of the game. I have one or two other pieces I newly gathered in 2016 so hoping to get another long form piece out on those

2016 Shooting review

November 2, 2016

Time for the annual review of how the season’s shooting went.

All shots Frees Point attempts Goal Attempts
2012 51.7% 70.6% 47.3% 39.8%
2013 50.5% 70.6% 44.7% 41.9%
2014 51.3% 76.8% 44.8% 47.9%
2015 53.8% 70.9% 48.5% 51.2%
2016 51.5% 71.1% 44.2% 52.9%

In truth 2016 was an average year. The three shot types listed above account for 96.4% of all shots and whilst there is some movement in each category there is nothing that really warrants further investigation.

Frees

This has been *the* most stable metric since the inception of the blog and 2016 was no different. Slight uptick but nothing exceptional. We looked at the 2014 increase here and, at the time, attributed it to better accuracy for closer in frees.

Point attempts

2015 saw an increase in accuracy for point attempts however this was a blip rather than the beginning of any trend as 2016 returns slipped back to 2013 & 2014 levels.

Goal attempts

The step up in accuracy observed in 2014 & 2015 was maintained in 2016. Teams have definitely become better at getting a return from their goal chances but not necessarily at their finishing. The above table includes any goal shot that returned a goal or a point. If we strip out the points then the goal conversion rate is 35%, 32%, 36%, 41% & 40% respectively. The step up in 2014 & 2015 is evidenced again however was maintained, rather than built upon, in 2016.

The best free taker?

June 17, 2016

This piece originally appeared in the Examiner’s Championship pullout. I had intended to link to it but it does not appear to be online so I have reproduced it below

The dearth of GAA data can lead to some curious problems. Take measuring the best free takers for example.

Normally all we get in any match report is a list of the scorers and how many of those scores were from frees, 45s etc. Rarely will their scores be put in the context of how many shots they had, how hard these shots were etc. Is the best deadball exponent (although frees make up well in excess of 85% of all deadball attempts we really should introduce penalties & 45s into the conversation) the player that scores the most? The one that converts the most? Neither?

Conversion Rates

The below table shows the Conversion Rates for any player with a minimum of 30 recorded deadball attempts over the last four Championships

Player Shots Scores Conversion Rate
D Rock (Dublin) 33 28 85%
C McManus (Monaghan) 48 39 81%
C O’Connor (Mayo) 112 90 80%
B Brogan (Dublin) 49 38 78%
C McFadden (Donegal) 54 41 76%
D McCurry (Tyrone) 39 27 69%
M Murphy (Donegal) 85 57 67%
M Newman (Meath) 39 26 67%
E O’Flaherty (Kildare) 36 24 67%
B Sheehan (Kerry) 41 25 61%
S Cluxton (Dublin) 56 31 55%

In and of itself this is noteworthy. Many would have placed the likes of McManus & O’Connor at the top of the charts but the long range experts such as Sheehan & Cluxton, who would also have had their proponents, are lower down the rankings.

This does highlight an issue with using Conversion Rates as shot difficulty (both in distance & angle to the goal) is not taken into account. Of Cluxton’s 56 attempts a remarkable 71% (29 x 45s & 11 x frees) were taken from the 45m line or further out. As a point of comparison only 10% (4 x frees & 1 x 45) of McManus’s 48 attempts were taken from the same range. How does McManus’s 81% Conversion Rate stack up against Cluxton’s 55%? Would we say that McManus is that much better of a deadball striker?

Expected Points

By dividing the pitch into segments, and using the results of well over 1,400 attempts, we are able to show what percentage of deadballs are scored per segment. We use this percentage to create an Expected Points (Exp Pts) return – along the lines of Expected Goals for soccer – for every attempt. So if a free from a specific area is converted 60% of the time the Exp Pts = 0.6pts. Doing this for every deadball attempt then allows us to compare players on a more equal footing.

Player Shots Scores Conversion Rate Conversion Rate Rank Total Pts above Expected
C O’Connor 112 90 80% 3 +7.4
C McFadden 54 41 76% 5 +6.1
M Murphy 85 57 67% 7 +4.2
C McManus 48 39 81% 2 +4.0
D Rock 33 28 85% 1 +3.7
S Cluxton 56 31 55% 11 +2.1
B Sheehan 41 25 61% 10 +0.9
M Newman 39 26 67% 8 +0.7
D McCurry 39 27 69% 6 -0.3
B Brogan 49 38 78% 4 -2.2
E O’Flaherty 36 24 67% 9 -4.1

This shuffles the ranking somewhat. The aforementioned Cluxton & Sheehan rise up the leaderboard as the difficulty of their respective attempts is filtered in. We also see the reverse as players with higher Conversion Rates drop down the ranking – Rock & Brogan noticeably.

Brogan is interesting. He only attempted three free kicks in 2015 meaning that the majority of his returns were pre the emergence of Dean Rock. Looking at the above it is easy to see why the free taking duty was passed to Rock. Although Brogan’s Conversion Rate was high at 78% – placing him 4th overall – the negative Exp Pts shows that he was missing too many easy chances. Of his 48 attempts 22 (46%) came from inside the 20m line; and he missed five of those.

Not that Rock is without his issues. In 2013 & 2014 he was an excellent 92% (11 from 12) on frees though this tally was racked up late on in games where the result was never in doubt. He started 2015 in similar form converting 93% of his first 14 however he then tailed off in the later rounds missing three of his last seven against Mayo & Kerry. Dublin have not looked to cultivate a free taker during the league campaign, so they have faith in Rock, however we won’t know if his late 2015 misses were just a small sample size or something else. If it occurs late on again when the pressure is at its most intense will Dublin be able to switch? Brogan, whilst an able deputy, is no better than average whilst Cluxton only hit one from seven in the semi-final onwards last year after coming in cold.

Cillian O’Connor

One of the more noticeable aspects of the Exp Pts table is how Cillian O’Connor & Michael Murphy rise to the top. The argument can be made that the more attempts you have the easier it is to build up an Exp Pts tally – that of course ignores that the opposite is also true. The more attempts you have the greater the opportunity to regress to the mean.

That O’Connor has maintained such standards across multiple Championships is a remarkable feat. Even more so when you consider that the methodology does not account for the majority of his attempts occurring in high pressure games (Provincial finals, All Ireland semi-finals & finals) whilst also being a load bearing totem. He has taken 76% of Mayo’s deadball attempts switching from the left to the right as well as taking high pressure penalties and the majority of Mayo’s 45s.

O’Connor’s consistency is beyond reproach and it is this, alloyed to his proven accuracy, that surely gives him the title of “the best free taker”.

NOTE: Due to space limitations I wasn’t able to expand on certain points in the article. One I wanted to address was E O’Flaherty’s returns. The above paints him as a very poor free taker which is incorrect. He is in fact a very good free taker but within his wheelhouse. By that I mean between the two 20m lines and to the left of the goals. The problem was that for years Kildare did not have a left footed free taker – or a long range one for that matter – so he was being forced to take shots that other designated free takers did not.

Frees from the Ground or the Hand; (’12 – ’15)

January 25, 2016

An article by Martin Breheny during the week had a pop at Mickey Newman for not taking a 35m free from the ground (it’s the O’Byrne cup. In January!).

Kevin Egan (@lonesharkoy on twitter and a great read in his betting columns for betswot) bemoaned the fact that the article was based on a sample size of one. One! And that maybe, just maybe, Newman might know what’s best for him when taking a free.

This is old ground. Conversion rates for frees from the hand and the ground were covered in two early pieces (see here and here). Just like now the catalyst for the original piece was commentators bemoaning the lack of a particular skill. The Breheny article, and discussion on Twitter in its aftermath, got me curious as to whether the results of the initial study had changed at all now that we had so much more data.

The short answer is it hasn’t. Overall players convert frees from the hand at a 20% rate better than from the ground.


Attempts Scores Success Rate
From the Hand 789 623 79%
From the Ground 405 239 59%


That 20% gap is a bit sensationalist. Where frees are taken from does have an impact on overall conversion rates. The majority of frees (78%) taken from outside the 45 are taken from the ground. Frees from outside the 45 are converted at a relatively paltry 38% so including these will automatically dampen the results for frees from the ground. If we exclude theme does it change anything?


Attempts Scores Success Rate
From the Hand 753 608 81%
From the Ground 281 193 69%


The answer is yes and no. Yes the difference between the two is narrowed significantly but the central tenet holds true – players are better at converting from the hand than they are from the ground. Indeed the gap has grown slightly from three years ago when similar splits saw results of 79% from the hand and 68% from the ground.

Shot attempts are further segmented by sector (see sector breakdown here) so we are able to take a more granular look.


Sector From Ground From Hand
4 58% 63%
5 81% 84%
6 51% 70%
7 72% 79%
8 96% 98%
9 78% 80%


Frees from the hand not only outperform those from the ground but do so in all sectors. Including, perhaps a touch surprisingly, the very central ones. I say surprisingly because with frees out wide I can understand how players taking them from the hands make it easier on themselves by stealing a few yards. That doesn’t really enter the equation with the more central ones.

As stated in 2013 I have no problem with people lamenting the loss of a skill but surely Mickey Newman, or any free taker, knows the best way to approach any particular free? The fact that the numbers back up using your hands is just a nice happenstance.

What’s the betting we will be revisiting this in 2017?