For those new to the blog, or who haven’t been here for a while, please find a refresher on the definitions and how the numbers are compiled here
Roscommon scoring 4-10 in the second half lends the game to the old “game of two halves” analysis. However whilst the scoreboard was lopsided in Sligo’s favour at half time (2 – 08 to 0 – 06) it was more a case of unsustainable Sligo accuracy – and no little profligacy from Roscommon – rather than anything in the game per se that created this gap.
1st Half
| Team | Possessions | Attacks | Shots | Scores | Exp Pts |
| Roscommon | 27 | 21 | 15 | 0 – 06 | 10.64 |
| Sligo | 24 | 19 | 14 | 2 – 08 | 9.27 |
Roscommon had more attacks, one more shot and essentially easier shots than Sligo in that first half. I say easier as Roscommon had an Expt Pts value of ~1.5pts greater than Sligo despite only having that one extra shot. Scoring 2-08 from 14 shots, including 0-08 from 11 point attempts with 3 of those coming from outside the 45, will put a rosy tint on any game plan. But as can be seen from the above table, and the shot charts below, the signs were there. Sligo’s shooting was long range leading to lower Expt Pts. Roscommon’s was closer with 10 attempts from inside the 20m line. In a prelude to what happened in the second half Roscommon had three goal attempts. Unlike the second half they returned nothing from them.
2nd Half
| Team | Possessions | Attacks | Shots | Scores | Exp Pts |
| Roscommon | 31 | 28 | 24 | 4 – 10 | 17.57 |
| Sligo | 21 | 14 | 11 | 0 – 05 | 5.71 |
Looking at the 2nd half numbers Sligo – shooting wise – did not fall off. They just returned slightly below what was expected. Where they did fall off was in ceding possession, and ultimately attacks, to Roscommon.
Roscommon had 10 more possessions in that second half and an incredible 14 more attacks. Sligo could not stop Roscommon coming at them in wave after wave. Sligo were at the very least co-authors in their own downfall through poor kick passing – I counted 8 kick passes (& 1 hand pass) going to a Roscommon man – and poor kickouts. Roscommon won seven of Sligo’s 18 kickouts in that second half. This was actually an improvement on the first half when Roscommon won six of Sligo’s nine kickouts. But again the signs were there.
Roscommon shooting
For all that Roscommon still had to use this possession. Their first half shooting was poor however in the second half they had a Dublin-esque seven shots on goal scoring 4-01. It was this that catapulted them ahead of Sligo as their point taking was average; 0-08 from 15 shots (53% Conversion Rate) with an Exp Pts tally of 7.14
We have been underestimating this Roscommon team all year but in the battles to come it is doubtful that they will have such a numerical advantage in terms of possessions & attacks. Can they continue to create this volume of goal attempts (10!! here)? If not can they up their point taking percentages which were average here (Conversion Rate of 48% and a total Exp Pts of -0.25)?
Kickouts
After the league semi final against Kerry I wrote the below paragraph
“One final point to note on Roscommon is their short kickout routine. Short kickouts going astray is an occupational hazard for teams that employ the tactic but it was a short kickout that effectively cost them the game late on versus Monaghan and here again they found a Kerry man wiiiide open inside their own 45 on a short one (different keepers on both occasions). This doesn’t count the numerous instances that I visibly winced as a defender received the ball with the attackers bearing down on him.
Short kickouts are fine – and will go astray – but Roscommon seem to flirt with danger more than most.”
I was visibly wincing again here. Roscommon won 86% of their own kickouts however this was entirely due to the nature of those kickouts. The 18 they won all went short. They went past the 45 on three occasions and lost all three. Worse again all three went directly to a wiiiide open Sligo man who was immediately on the attack.
Those three losses happened in the first half in the midst of six shorts ones – two of which landed on Roscommon players under immense pressure. So when the battle was raging Roscommon lost three of their opening nine kickouts in alarming circumstances and won two in an incredibly dangerous fashion.
The flip side of this is that the remaining 12 passed off without any major incident helping them build the possession & attack momentum mentioned earlier. Roscommon scored 1-06 directly from those 12 possessions.
It is the eternal short kickout risk/reward conundrum. We have seen numerous instances of late where short kickouts have gone disastrously wrong. Roscommon play with the tiger’s tail more than most but yesterday it worked out once those early glitches were ironed out. But in games to come what happens when they get a full court press from the opposition? Will they continue to go short under pressure? Sligo got 0-02 here – will an early goal rattle them enough to change?
Roscommon’s kickouts, and what they do when they are confronted with a full press, is definitely one of those moments I am looking forward to in this year’s Championship.
Appendix
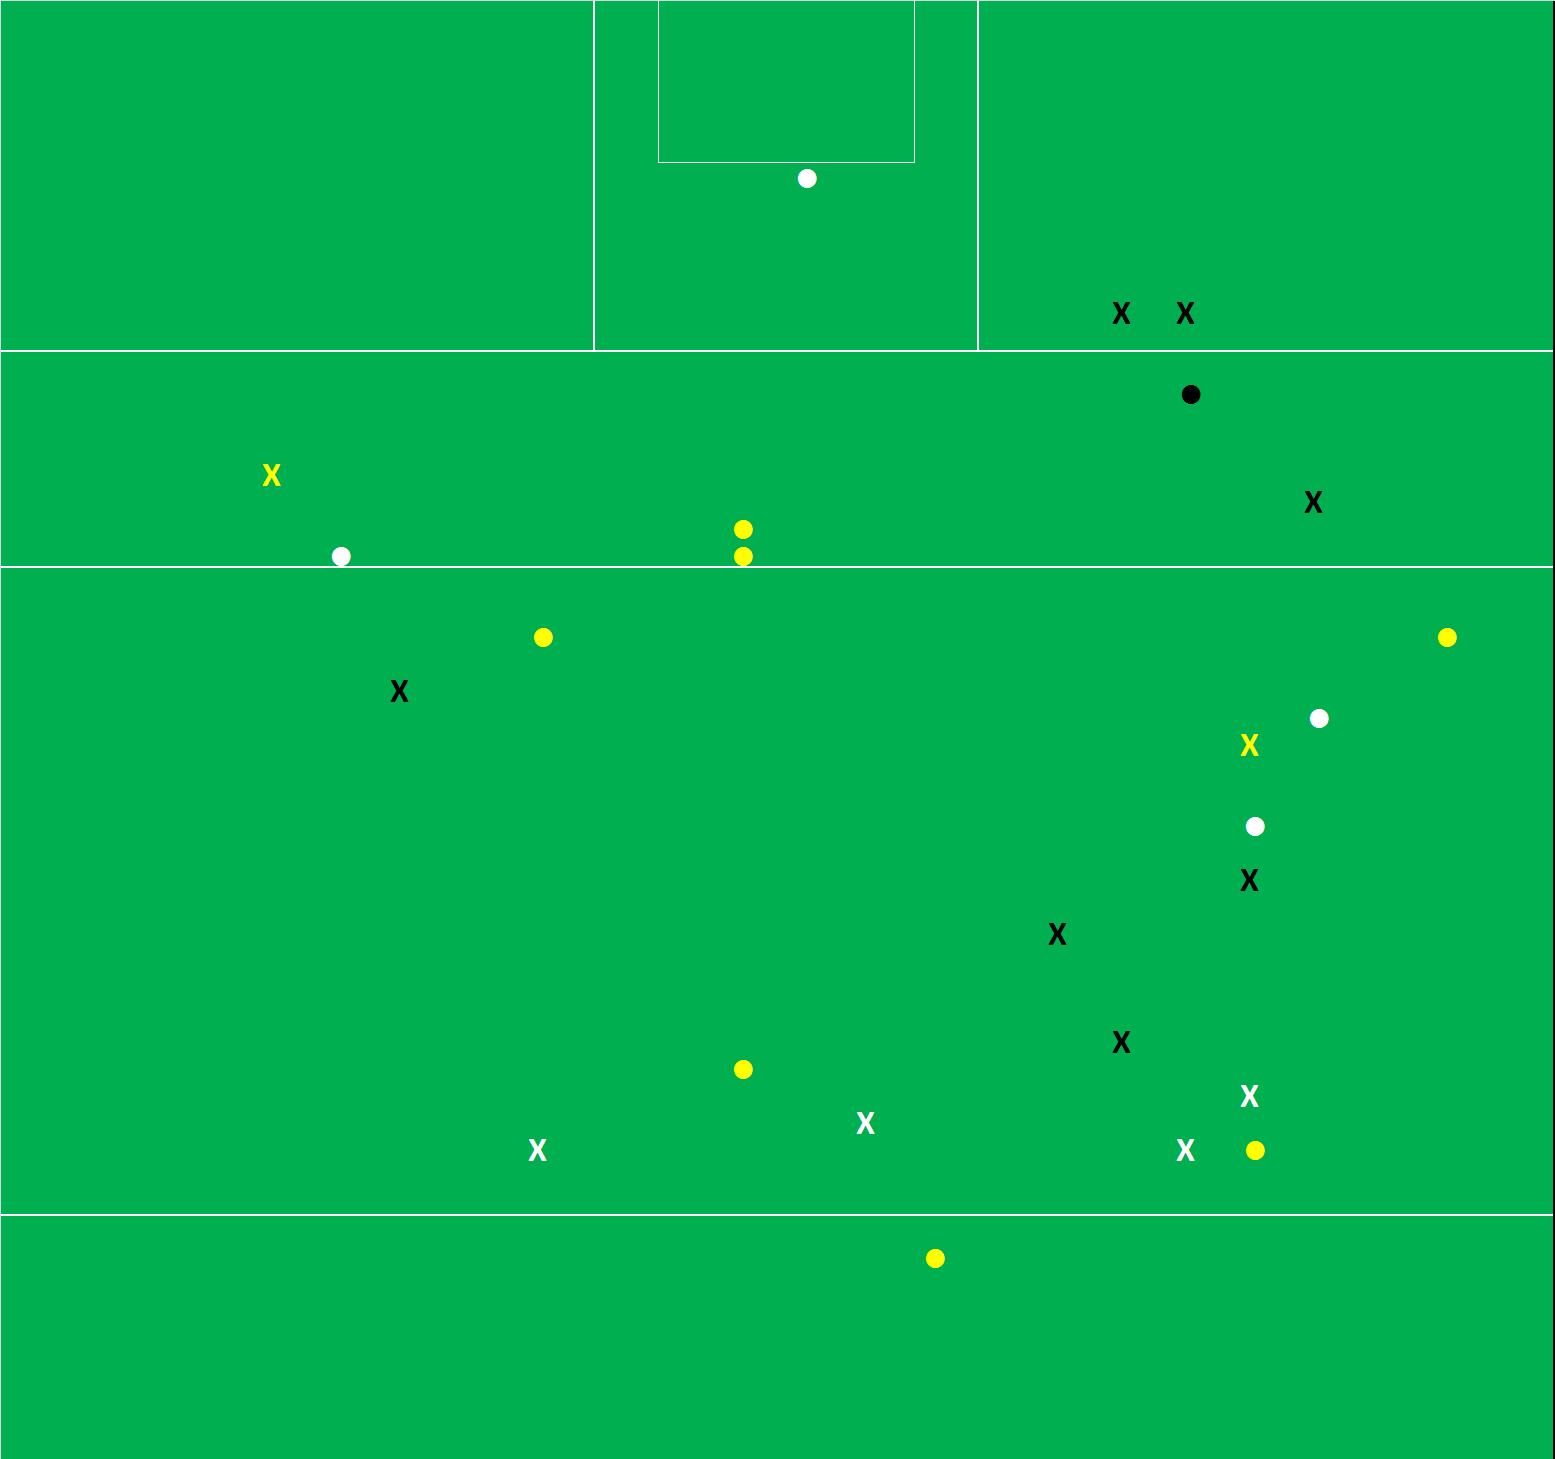
Shot Charts
Roscommon’s shooting

Sligo’s shooting

x = missed, disc = score, yellow = deadball, black = 1st half from play, white = 2nd half, red = goal attempt
Players with >= 3 shots from play
| Shots | Scores | Success Rate | Exp Pts | |
| C Devaney (Roscommon) | 7 | 0 – 03 | 43% | 3.86 |
| P Hughes (Sligo) | 6 | 0 – 05 | 83% | 2.28 |
| D Shine (Roscommon) | 5 | 0 – 02 | 40% | 3.61 |
| D Keenan (Roscommon) | 4 | 0 – 03 | 75% | 3.03 |
| C Cregg (Roscommon) | 4 | 0 – 00 | 0% | 2.34 |
| D Smith (Roscommon) | 3 | 0 – 02 | 67% | 2.63 |
| N Murphy (Sligo) | 3 | 0 – 02 | 67% | 1.22 |