Archive for the ‘2018’ Category

Corofin’s attack

March 27, 2019

Corofin produced an absolutely scintillating performance in the first half of the recent club final against Dr. Crokes. I threw up a few pieces on twitter (@dontfoul) around that performance and what follows is an amalgamation of those pieces with a bit more context.

It is important to note what this is not. It is not is a critique of how Corofin play. It is a review of how they played in one half of one game.
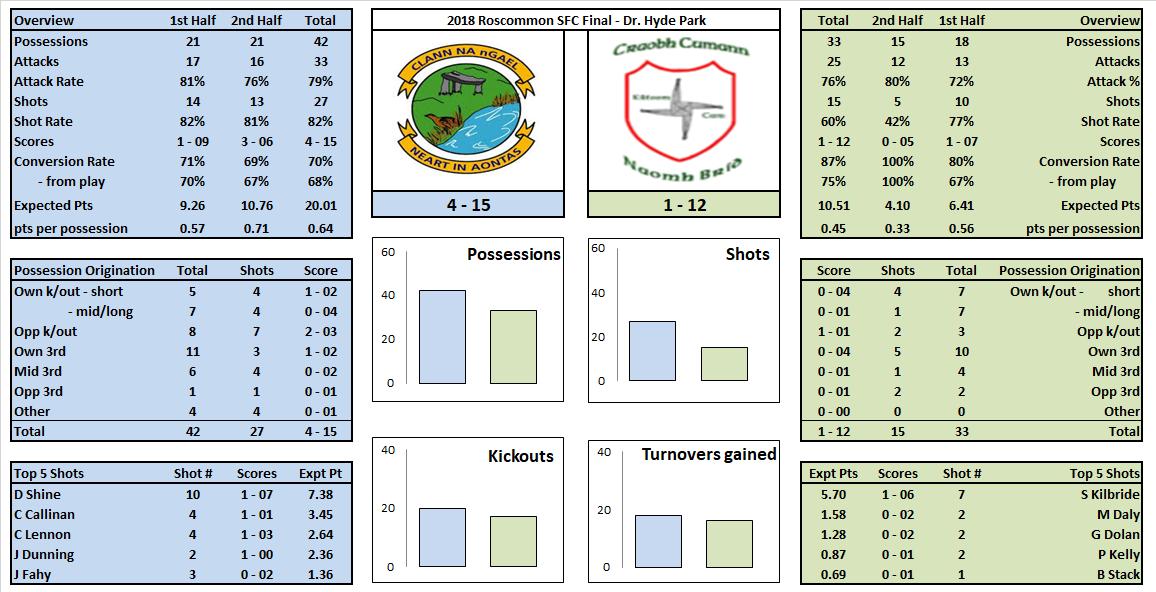
Corofin’s shooting

The first thing that jumped out when watching the game “live” was their shooting. In that first half against Dr. Crokes they attempted 15 shots with none coming from further out than ~23m.

Corfin 1st half shooting v Dr. Crokes

That is an incredibly neat and tight shot chart. I tend to use an ad hoc arc around the D to give a visualisation of “inside”/”outside” shooting which I have overlaid on Corofin’s shots. In the Super 8s last year 45% of shots were taken inside that arc. 45%! Corofin were at 87% (13 of 15) with the two “outside” being on the edge of the arc.

Passing sequences

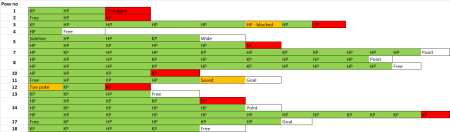
Taking a step back the next question is how Corofin managed to create such a neat shot chart. Below is the passing sequence for all 18 of their first half possessions and the result for same (excluding the very last move when the referee blew for half time just after the kickout was gathered).

Corofin passing sequence 1st half v Dr. Crokes

Green is a successful pass, orange is where the pass did not go where anticipated but Corofin gathered/controlled the ball and red is a turnover from a pass.

There is probably a thesis there for someone in comparing that table to other teams, be they club or county. Passes per possession, hand pass to kick pass ratio, avg. length of kick pass, quantum of attacking passes to possession retention passes etc. But from a cursory review there are a few things that jump out

• Just how much green there is and the implication of assuredness whilst in control of the ball;
• Only one turnover in the tackle
• Only four, out of 128 passes, led to a turnover

That is not to say that the other 124 passes were perfect – far from it. There is quite a bit of oIrange in there but that in and of itself was a feature. Twice shots were blocked and regathered, at least five times unorthodox passes (fist through, toe pokes, kick through – you don’t always need to “go down on it”) successfully found a Corofin player. Corofin were alert to all possibilities at all times.

Visually Corofin were in utter control and the above table is just another way to show it. And that control was achieved with a variation in both tempo and style. The first three possessions took six passes apiece, contained two outfield solos and averaged ~20 seconds on the ball. The last point was a 20 pass string with five outfield solos and consumed 72seconds on the clock.

That control was evident even with a heightened volume of kick passes. More work is (definitely) needed here but it is important to stress that it is the type of kick that is emphasised here rather than the volume.

(As an aside ….. Patricia Lynch, the current senior performance analyst for Kerry, did a notational study of passing (https://www.tandfonline.com/doi/full/10.1080/24748668.2017.1416526) showing that from 2014 – 2016 the ratio of kick passes to hand passes was 2.5:1 (~ 72% to 28%). Eamon Donoghue (https://www.irishtimes.com/sport/gaelic-games/gaelic-football/gaa-statistics-how-much-has-gaelic-football-changed-in-the-last-decade-1.3619732) in his piece in the Irish Times post last year’s all Ireland final showed a kick pass/hand pass ratio of 75%/25%)

Corofin, at a 30% kick pass ratio, were just above these norms but their attacking kick passes were immense and it is phenomenal that they only had a 3% turnover rate on all passes when we overlay the (subjective) nature of their kick passing.

Front 6 touches

So stepping away from the passing sequences (as I said you could create a thesis on this alone) the question becomes how they create this control. They are generally on point with their passing allowing them to attack the goal and almost point-blank refuse to take unnecessary shots. Joe Brolly eulogised on their understanding of movement and space in the Sunday Game and that got me thinking re how Corofin use their front six.

Corofin front6 touches v Dr. Crokes

The above chart outlines the passing and movement on the ball of Corofin’s front six. In doing so you can see a few things that work into their game plan

• expanding it out to the full pitch it is rare for any of them to be on the ball in their own half – 5 touches between them (with Michael Lundy having four of them)
• Gary Sice (#10) is the main architect of the attacking kick; the front six had four kick passes combined from outside the 45 with all of them coming from him
• Michael Lundy (#11) preferred the right-hand side
• Michael Farragher’s (#14) natural habitat is a small rectangular box between the 13m & 20m lines in front of goal however if he collects the ball out the field he is carrying the ball directly towards the danger zone

But all that pales into insignificance when we see what the front six didn’t do. They stayed away from the No. 6 channel (yellow coloured rectangle in the above chart) altogether. Compare that to how other teams view the concept of space and where they try to get their playmakers on the ball.

Could we have seen it coming?

That first half display against Dr. Crokes was outstanding. Unfortunately (despite my endless invocations to people on Twitter to back up their data) I have lost my copy of the 2018 final v Nemo Rangers but commentary points to how they blitzed both Nemo in that final and Slaughtneil in 2016.

What I do have however is the semi-final v Gaoth Dobhair. And the comparison of the two first halves is as scary as it is striking.

Dr. Crokes v Gaoth Dobhair comparison

Part of the narrative around Corofin’s displays in the finals is that Croke Park suits them. The wide open space allows their forwards to run all sorts of angles whilst the outfield players can find space to pick a pass. Scarily Corofin were even more clinical in the first half of the Gaoth Dobhair game, down in Seán Mac Diarmada Park, than they were up in Croke Park. I mean … 2 – 07 from 11 shots in an AI semi-final.

Once again the shooting was very considered with only three shots coming from outside the aforementioned artificial zone (I wonder did Jason Leonard have to do punishment laps the next night at training for that shot out to the right ….).

Across the two halves analysed that’s 81% (21 of 26) of shots coming from “inside” with only one shot that could be considered in any way away from the arc with 35% of all attempts from play being goal attempts.

Again, a reminder that the 2018 Super8s saw 45% of shots from “inside” with 10.4% of attempts from play being goal attempts.

Passing sequences v Gaoth Dobhair

Corofin passing sequence 1st half v Gaoth Dobhair

The passing was not as slick as against Dr. Crokes in that seven passes led to a turnover but the avoidance of turnovers in the tackle is evident with just the one ball dislodged early on.

All the main ingredients for that first half performance v Dr Crokes were evident in their first half display v Gaoth Dobhair.

Comparison of League & Championship returns

January 20, 2019

Comparing league and Championship

I have only ever used Championship games when creating specific averages or metrics. In the main this was due to laziness on my part as I wasn’t really tracking League games but there was also a part of me that viewed League & Championship as sufficiently different to be treated individually. Separate entities. Different games on different pitches in different weather.

But then I got notions and tracked the 2018 league. Was the league data sufficiently similar to that of recent Championships allowing us to augment existing datasets and produce more robust outcomes? Or did the “gut feeling” that the two should be kept separate stand up to even the most rudimentary of reviews?

In the end 22 League, and 32 Championship, games were tagged (a fancy way of saying “noted a lot of different things within a game”) throughout the year. A nice, healthy, robust possession count of just under 5,000.

Given the size of the dataset, and the fact that the games reviewed were within the same calendar year, any differences should really be due to the competition, and its peculiarities, rather than any observed changes in styles throughout the years. (And as a nice aside we’ll also have a clean, comparable, dataset to test the effects, if there are any, of the new rules being introduced in 2019).

Game flow

At the outset it became obvious, despite the best intentions of curtailing the review to one season, that we were not comparing apples with apples. Within the 32 Championship games there were quite a few where the disparity between the two teams’ quality was very evident (somewhat expanded upon here). So the 2018 Championship returns were subdivided further into (a) all Championship games and (b) those games between Division1 teams only (Dublin, Tyrone, Galway, Monaghan, Donegal, Kerry, Kildare & Mayo) of which we had a healthy number – 15 in total – thanks to the introduction of the Super8s.

And we have our first surprise. There were as many possessions per game in the league as there were in the Championship; and the differences between the two Championship subdivisions were small enough to be deemed immaterial. I say “surprise” as, based on nothing more than intuition, I fully expected there to be more possessions during the League as a result of increased turnovers through weather, heavy pitches and teams not being quite at their peak.

Now there were more turnovers during the league – five a game – but this was counter balanced by how teams used the ball. There is an appreciable step up in attacking production across the Championship with higher Attack and Shot Rates. Both these then lead to noticeably more shots (~8.5%) per game. More shots equal more kickouts.

Those turnover possessions “lost” from the League to the Championship were regained through extra kickouts resulting in the immaterial movement in the total number of possessions.

Kickouts

Viewing kickouts in isolation that point is further evidenced; kickouts account for 49% of all possessions in the League but 54% in the Championship.

Teams were much more on point on kickouts throughout the Championship retaining possession at a much higher rate than they did during the League (77% v 70%).Teams won more short ones (95% v 91% during the league) as well as more of the longer ones (61% v 56% during the league).

One of the contributing factors here could be the well-worn training cycle within GAA where teams work on kickout routines coming into the Championship as the winter months are used to lay down a fitness block.

Interestingly this is the first time we see a break in how the two Championship subdivisions perform. During the league the kickout team won 56% of their own kickouts that went past the 45; this stepped up to 61% in the Championship and again to 66% when we segment just the Div1 teams.

A jump in retention rates from 56% to 65% on kickouts past the 45 is quite noticeable – especially on those kickouts that should be the most contestable. The teams, and the quality of the opponent, haven’t changed. Instead teams have just improved.

This stepped increase in retention rates, both from league to Championship and within the Championship subdivisions, lends credence to the above supposition that teams “work on” their kickouts more in the lead up to Championship than they do in the League with the better teams, i.e. Div1, being more successful at implementing their plans.

Shooting

As noted above there are more shots attempted during the Championship. But that alone does not account for the higher scoring rates observed during the summer. Teams are more efficient with that extra shooting. And not just in one particular phase but across all three – point attempts, both from play and deadballs, as well as goal attempts.

Point attempt Conversion Rates (from play) during the League were lower than those in the Championship. But not massively so. They are probably within any margin of error so further work is required to confirm if this a League v Championship, early season v late season, bad weather and heavy pitches v good weather and “proper” pitches thing or just one season noise.

Deadball returns have improved the last two Championships (2018 – 74.0%, 2017 – 73.5%, 2016 – 69.0%, 2015 – 68.9%) so the 72.2% achieved within the 2018 League feels like a lag. Again though it is within any margin of error so it is probably wise to err on the side of caution and say that the differences are inconclusive.

Goal shots are probably the most eye catching numbers with just 32% of shots converted during the League and 39% during the Championship. Again those Championship games involving the Div1 teams saw another slight bump to 41%. The volume of goal attempts in those Championship games was less at 4.2 per game (as against 4.7 during the league) yet they were converted at a much higher rate. Why? More work done on finishing moves? Random one year fluctuations on small sample sizes? Effect of must win games in the Championship ensuring players take points off less clear cut chances? That most unsatisfactory of answers … to be determined.

Instinctively the Conversion Rates for all three elements, deadballs, point attempts and goal attempts, being lower in the League feels right. As stated I have never been a fan of mixing data from the two competitions and whilst the disparities are probably small enough for some the differences just reinforce my original belief that, without further analysis, we shouldn’t just lump the two competitions together to get bigger volumes.

So there you have it. At a macro level League games are similar to Championship games with the same number of possessions and comparable Conversion Rates. But get under the hood and the makeup of each component differs just enough to warrant (for me anyway) keeping all metrics for the two separate.

One final quick note

Defence

Unfortunately there are no great defensive metrics per se. The sign of a good defensive performance is usually evidenced by the absence of good offensive metrics for the opposition. But that doesn’t really work here when we are looking at averages in the round as everything just becomes an aggregate blob with no real decipherable differences.

Some specific defensive metrics we can look at are turnover rates (though the assumption that all turnovers are induced by the defence doesn’t hold much water), how often teams get in for an attempt at goal and the pressure faced by teams when shooting.

Focussing on the Div1 teams we can see a tightening up on the defensive front with a ~10% increase, from the league to the Championship, in the number of shots taken under strong pressure. There is also a ~10% increase in the number of possessions it takes to get a shot on goal.

As well as getting more clinical on their use of possessions and kickouts the Div1 teams also tightened up defensively (balanced by more efficient shooting). Everything trends towards the Championship just being that step ahead of the League. Sometimes what you see really is what you get.

Kilmacud Crokes v Mullinalaghta Leinster Club Final 2018

December 11, 2018

Rian Brady scored a lucky point in the 17th minute when his long ball into the full forward line evaded everyone and bounced over the bar. But Mullinalaghta were far from lucky in this game. Yes they trailed for much of the second half but over the entirety of the game they had more shots, as well as a much higher Expt Pts return, than Kilmacud. On top of that they dominated the contested (and contestable) kickouts whilst also restricting one of the country’s foremost club teams to one shot at goal. On numbers alone Mullinalaghta deserved this victory.

If and when they ever get to review this game what will be gnaw away at Mullinalaghta is where they gave up the ball. Kilmacud got their hands on 17 possessions from their 65 upwards from which they scored 1 -04 of their 1-06. That is insanely high with the returns from the other six club games covered on the blog this year being 6, 6, 4, 9, 9, 9, 9, 0, 5, 6, 7 & 6. You sense that they will not get away with that against Dr. Crokes in the semi-final. But that’s for another day …

When Kilmacud had the ball

Kilmacud’s numbers are slightly squirrely what with a relatively low Conversion Rate (47%) but an Expt Pts of +1.21.

The dichotomy between the Conversion Rate and the Expt Pts can be explained through their goal and free attempts. Pat Burke’s effort was their only shot on goal, producing an Expt Pts of +1.19, whilst Paul Mannion scored 0 – 02 from 3 (Expt Pts of +0.13) on frees. That’s 75% (1 – 02 from 4) combined with Expt Pts of +1.32. Quite good from an accuracy perspective.

What let them down was their point attempts which returned a very low 36% (0 – 04 from 11). This was somewhat surprising as they had produced a combined 59% (0 – 22 from 37; Expt Pts of +4.43) in their two games against St. Judes and Portlaoise. As stated in the Portlaoise review we always have the small sample size caveat but Kilmacud had looked like an accurate, tidy, shooting team. It is difficult to attribute this poor shooting display to Mullinalaghta defending as seven of the eleven point attempts were taken under little or no pressure. It was just an off day.

What we can give the Mullinalaghta defence credit for is shutting down Kilmacud’s avenue to goal. In the aforementioned two games Kilmacud had ten shots at goal producing 4 – 01. It looked like we might be in for a repeat here when Pat Burke tucked away Williams’s pass in the 4th minute. But Mullinalaghta shut that forward line down thereafter and indeed were excellently set for Kilmacud’s build up play. Kilmacud had 22 possessions originating inside their own 45 (9 from kickouts, 13 from turnovers) off which Kilmacud only manufactured six shots returning 0 – 02.

When Mullinalaghta had the ball

Up until the 55th minute Mullinalaghta’s shooting was letting them down. They had 13 attempts returning 38% (0 – 05 from 13) with an Expt Pts of -2.78*. That included their only goal attempt which Brady lifted over the bar under huge David Nestor pressure.

*they were 0 – 06 in the 55th minute but Brady’s long punt into the full forward line that bounced over the bar does not count as a shot.

And then begins a sequence that will go down in club lore as Mullinalaghta scored 1 – 02 off three shots in four minutes to open up a two point lead that they never relinquished.

The turning point was the Gary Rogers penalty in the 58th minute. Penalties are relatively sparse (31 in 126 intercounty Championship games from ’15 – ‘18) in football but have a high Conversion Rate (74%; 23 from 31). What made this one slightly different was that it occurred right after Nestor had saved a last gasp penalty in the semi-final against Portlaoise (@ 14:30 here). Did that save play on either of the protagonists in this instance? Against Portlaoise Nestor saved to his right; he dived to his left this time … any reason why? Did he think his post-game comments (paraphrasing here but he said “I went to my right as at my age that’s the only way I can go”) that day would play on Roger’s mind? Did Rogers hear them?

Postscript; in the end that wondering was for nought. Rogers gave an interview to Second Captains in which he says that he did see the save against Portlaoise but took no heed of it as he is not the normal penalty taker (McGivney is but has a knee issue that prevents him from shooting off the ground) and was just concentrating on a clean contact!

Roger’s impact on the game was not solely based on the penalty. He managed six primary assists as Mullinalaghta’s link man. No other player, across either team, managed more than three primary assists.

Kickout overview

As stated Mullinalaghta stymied Kilmacud’s short kickouts allowing just one shot off the nine they won and also scoring a point off the one that went awry.

Mullinalaghta weren’t interested in short kickouts (case in point being the one they did try ending up in a throw in as the ball didn’t travel the required distance) and instead went long(er) with 6 of their 13 going past the 65m line.

Mullinalaghta were very strong here winning five of their six that went past the 65 and 68% (13 of 19) of all kickouts that went past the 45.

Appendix

Shot charts; disc = score, X = miss, yellow = deadball, red = goal attempt, black = point attempt from play 1st half; white = point attempt from play 2nd half

Kickout charts; disc = kickout team won, X = kickout team lost, black = 1st half, white = 2nd half

Mullinalaghta shot chart

Kilmacud Shot chart

Mullinalaghta kickouts

Kilmacud kickouts

Gaoth Dobhair v Scotstown 2018 Ulster Club final

December 4, 2018

In the normal course of events a review starts with a table summarising the game. That is to follow. For this game however there is a slight detour as we start out with a picture instead.

Darren Hughes had turned the ball over in the 61st minute when the game was all square. He was leading a counter attack down the right wing and receives the ball back from Heaphey who has just come on. Turning inside he sends a kick pass across the defence to Morgan who is in space (just out of frame). Instead of setting up the winning score the ball doesn’t rise off the pitch at all instead skidding away from what can only be described as a square metre of mud.

Quite obviously it is an important moment in the game but it also illustrates the conditions the game was played in. The pitch was heavy with quite a few mud patches. There were frequent bursts of quite torrential rain both before and during the game. The ball was greasy, the pitch a quagmire and the day a wet, dark, miserable Irish winter day.

This is in complete contrast to both the usual summer weather the averages for games are built upon and even the club games that have been covered on the blog this year. When reviewing the game this context must always be at the forefront.

Game Overview

The pitch took the speed out of the game.

The weather layered on top of this by forcing shots from closer in than is the norm; between the two teams there was maybe one shot from play that could be considered long range and that came in extra time (see the shot charts in the Appendix).

And to top it all off the teams were relatively conservatively set up. Add all three together and you get a grand total of 65 possessions in normal time. Compare that to the 87 in Gaoth Dobhair’s previous game with Crossmaglen or indeed the 97 possessions in the Kilmacud v Portlaoise game. The ball was hard won and it wasn’t easily given up.

Gaoth Dobhair had eight more possessions, eight more shots and a tally of just under 4.0 Expt Pts more than Scotstown in the opening 60 minutes. They lost just one of their own 13 kickouts whilst winning 75% (6 of 8) of Scotstown’s kickouts that travelled past the 45. By all known measures they really should have been out of sight … but to Scotstown’s immense credit it was Gaoth Dobhair who had to stage a comeback in the second half when they went three points down after 38 minutes.

So how can all these things (Gaoth Dobhair’s apparent dominance and Scotstown’s lead) be true? Shooting accuracy. In normal time Gaoth Dobhair returned a relatively poor 48% (0 – 11 from 23; Expt Pts of -1.62) whilst Scotstown, given the conditions, produced a quite remarkable 73% (0 – 11 from 15; Expt Pts of +2.19).

There was a trend apparent in normal time which was to prove crucial during extra time. As can be seen from the shot charts Scotstown’s shooting during normal time was from much further out than Gaoth Dobhair’s. “Much” might be a stretch but in the conditions every metre mattered.

Of Scotstown’s point attempts from play 80% (8 of 10) came from “outside” (as denoted by the dotted red line) whereas only 47% (9 of 19) of Gaoth Dobhair’s shooting was from “outside”.

When we get to extra time we see that Gath Dobhair scored 0 – 02 from their four attempts with the two points coming from right in front of goal whereas Scotstown missed their four attempts with none coming from close range. Gaoth Dobhair were able to get inside, as they had done all game, during extra time when everyone was exhausted, both mentally and physically, from the day, the pitch, the enormity of the occasion, whereas Scotstown were never able to break down the Gaoth Dobhair defence.

Details of both teams’ shooting and assists can be found below but once again it is worth highlighting Odhran Mac Niallais. He has produced excellent numbers for a putative midfielder. He topped the assists chart the last day with five primary assists against Crossmaglen and does so again here, in conjunction with M Ó Cearbhaill, on four. He also tops the shooting tables across the two games with eight point attempts combined (50% conversion; Expt Pts of +0.427). And just to top it off he is Gaoth Dobhair’s main free taker (taken 14 of 19 attempted across the three games covered).

Kickouts

Given the nature of the game what the teams did after winning the kickout is of less importance here than just winning the kickout. And Gaoth Dobhair controlled this section of the game winning 67% (12 of 18) of all kickouts that went past the 45 including 11 of 14 in normal time.

Their supremacy in this area fed in to Scotstown changing tack. Seven of Scotstown’s eleven kickouts went past the 45 with Gaoth Dobhair getting hold of six of those seven. Thereafter five of their next six went short

Appendix

Gaoth Dobhair shot chart

Yellow = deadball, black = from play in normal time, white = from play in extra time; X = missed, disc = score

Scotstown shot chart

Yellow = deadball, black = from play in normal time, white = from play in extra time; X = missed, disc = score

Gaoth Dobhair shooting table

Gaoth Dobhair assists

Scotstown shooting table

Scotstown assists

Portlaoise v Kilmacud Crokes Leinster Club SF 2018

November 30, 2018

As ever goals win games … or not. Portlaoise had two more shots than Kilmacud and also took shots that were expected, all other things being equal, to return a scoreline ~3pts more than Kilmacud. But Kilmacud ended up with 18 scores off a 64% Conversion Rate whilst Portlaoise returned 11 scores off a 37% Conversion Rate.

This was an incredibly open game with 12 goal attempts returning 4 – 04 and a phenomenal 40 shots in the first half. I think I called it “brilliantly bonkers” on twitter.

I mentioned the frantic pace at the start of Gaoth Dobhair v Crossmaglen as being unprecedented but we may need to review what the baseline for these upper echelon club games are. This game was every bit as frenetic; the first ten minutes produced 17 possessions with fifteen shots of which five were attempts at goal.

When Kilmacud had the ball


yellow = from deadballs; red = goal attempts; black = from play in 1st half; white = from play 2nd half

The most striking aspect of Kilmacud’s shooting was how close in to goal it was. 28 shots in the game with only maybe one coming from outside the optimal shooting zone … and that was from Paul Mannion who, given his form, is allowed shoot from anywhere!

They were 58% (0 – 11 from 19; Expt pts of +1.72) on point attempts from play which is very good. The Conversion Rate was undoubtedly aided by their shot selection however the positive Expt Pts shows that they were still more accurate than the norm.

At a macro level it looks like they are a very accurate team. We have the usual caveat of small sample size but this is the second recent game we have following the county final against St. Judes (didn’t do a write up but did cover the game) and they were 61% (0 – 11 from 18; Expt Pts of +2.71) on point attempts in that game.

Kilmacud had five shots at goal returning 1 – 03 which is about average. In the aforementioned game against St. Jude’s they also had five goal attempts returning 2 – 00.
Indicative of their attacking play those ten attempts at goal have been spread across five different forwards (Mullin x3, Mannion, Burke & Pearson x2 each and one from Horan)

There was nothing especially noteworthy about their free taking (0 – 03 from 4; Expt Pts of –0.65 as the one that Mannion missed was quite easy from the top of the D). Maybe Kilmacud might have a quibble at the dearth of frees as they’ve only had the five shots across the two games (four here and one against St. Jude’s) but Portlaoise and Jude’s combined for eight so there wouldn’t appear to be anything in that.

A quick note on Cunningham who was excellent as the link man. He had six primary assists in all; five for point attempts and one for a saved Mullin goal attempt.

When Portlaoise had the ball

Portlaoise had seven shots at goal one of which was the last minute penalty. Overall they come out with positive returns on these goal attempts (Expt Pts of +0.53) which is
remarkable considering the penalty save. I have penalties being converted ~80% of the time which means that a miss/save takes -2.35 off a team’s Expt Pts.

Overall Portlaoise recorded an Expt Pts of -4.66 so if their goal attempts came out more or less even then everything else must have fallen apart.

They had five point attempts from deadballs returning just 0 – 01 (Expt Pts of -2.36). Whilst two of these were 45s you would expect, in the normal course of things, Brody to have slotted one of them. Cahillane’s sole score was on the 13m line from in front of goal It was effectively a gimme (they are converted in excess of 99% of the time) so whilst one of his misses was from quite a tight angle he basically doesn’t get any benefit from the score to balance this out.

Then there was the point attempts. Portlaoise had 18 point attempts from play scoring just 0 – 06 (33%; Expt Pts of -2.83). Lillis and McCormack were the main culprits combining for 0 – 01 from 10. But more than individuals it was Portlaoise’s almost shoot on sight policy that hurt them. Below is a comparison of the two teams’ point attempts with Kilmacud in white and Portlaoise in black.

There is nothing to say you cannot convert from further out, or indeed that you cannot win by shooting over a team. But there is much greater variance in the returns from where Portlaoise attempted their points from as opposed to Kilmacud’s attempts

Kickouts

Very crudely Kilmacud followed the Dublin template with 73% (16 of 22) of their kickouts going short. They weren’t overly efficient on these however letting Portlaoise get their hands on two, scoring a goal off one and only scoring 0 – 04 from the 14 they did win.

Portlaoise were the inverse with 86% (19 of 22) of their kickouts crossing the 45. That made 25 kickouts in total crossing the 45 with Portlaoise coming out on top 14 – 11. Their poor conversion rates were evident again her however as they scored 1 – 02 from the eight shots off these kickouts whilst Kilmacud scored 0 – 06 off the 8 shots they manufactured.

Ballintubber v Corofin Connacht Club Final 2018

November 27, 2018

Over the 60 minutes of this game the headline numbers – possessions, attacks, shots, number of kickouts won, number of turnovers – are all very close. Yet the game never felt that close as the clock ran down.

When Corofin had the ball

Part of Corofin’s ease in the last third was due to their excellent shooting. 71% overall including 2 – 00 from their only two goal attempts and 0 – 03 from their three frees. Their point taking stood up as well with a Conversion Rate of 58% (0 – 07 from 12; Expt Pts of +1.09).

One unique aspect of their point taking was the spread of shooters. Ten different players in total contributed to their 12 point attempts with only Kieron Molloy and Mike Farragher having more than one attempt.

Similarly their assists were well spread with nine different players providing primary assists and only two players (Gary Sice & Dylan Wall) having more than two. That is one of Corofin’s greatest strengths – you never know where the attacking threat is going to come from.

But the main reason for their easy third was due to a devastating 15 minute spell from the 33rd minute onwards. In that period Corofin had 16 possessions taking eleven shots … and scoring 1 – 08 (Conversion Rate of 82% with an Expt Pts +3.06). They rounded that period off by winning three Ballintubber kickouts in a row, including a short one that went awry, scoring 0 – 02 from them.

During that same period Ballintubber had 11 possessions with just four shots scoring 0 – 02. The effect on the game was quite dramatic.

When Ballintubber had the ball

We have touched on how Corofin dominated Ballintubber at the start of the second half but Ballintubber’s paucity in attack continued on with their only two remaining shots in that half coming at the death in the 58th & 60th minutes.

Ballintubber’s point attempts over the 60 minutes were on a par with Corofin (54% Conversion Rate with 0 – 07 from 13; Expt Pts +0.99) although, unlike Corofin, they leaned heavily on their big two up front with Cillian O’Connor and Alan Dillon combining for 0 – 04 from 7 (57% Conversion Rate; Expt Pts of +1.09)

Ballintubber didn’t just rely on O’Connor & Dillon in terms of shooting. They, along with Jason Gibbons and Diarmuid O’Connor, were heavily involved in Ballintubber’s attack with the four providing the primary assist on 14 of their 17 shots.

With a quick nod to the last few intercounty seasons O’Connor’s frees were below average. He had four longer range efforts scoring 0 – 02 for an Expt Pts of -0.96. In 2017 and 2018 he was 0 – 53 from 70 for Mayo (on the games reviewed). A Conversion Rate of 76% is bang on average but those frees returned an Expt Pts of -2.87. His free taking is just a notch below where it was and also below the other big free takers (Rock was 88% with an Expt Pts of +4.41 and McManus 77% with an Expt Pts of +1.63 in the same period)

Kickouts

The kickout flow followed the game flow. Overall the two teams come out more or less even; 22 kickouts past the 45 with both teams winning 11 each. Indeed it didn’t matter who kicked out the ball … Corofin won half (4 apiece) of Ballintubber’s non-short kickouts with Corofin also winning half (7 apiece) of Ballintubber’s.

But Ballintubber only had three kickouts in the first half with Corofin having six in the second. Ballintubber were able to get a grip on the game in that first half winning six of Corofin’s nine kickouts that went past the 45 including back to back Marks on Corofin’s first two kickouts. Corofin were much better in the second half winning five of their six.

Appendix

Corofin shot chart

Ballintubber shot chart

Updated Raw Expt Pts post 2018 Championship

November 22, 2018

The last published Expected Points (Expt Pts) numbers are contained here. I would strongly recommend that everyone, whether you are currently using Expt Pts or not, (re)read this piece as it outlines the methodology used and more importantly the inherent weaknesses in the numbers.

Changes since last publication

Those numbers were produced in early 2018 but had not baked in the 2017 returns … so in effect were created off Championship data up to and including the 2016 season. Some 70 Championship games have been added to the database since then so it is time to update the numbers.

A quick review of some changes

a) Firstly all attempts, inside Section 8, have been coded as being with the hand or the foot. This does not get anywhere near representing the quality of goal chances but, as can be seen in the differences for both, is a worthwhile change.

b) Secondly the raw averages have been dispensed with and instead a weighting is now in effect; 30% of total outcomes are taken from the two most recent years with 20% each for the two years preceding this. What is happening in more recent years is more prevalent in the Expt Pts output but we spread the return across the four most recent years to ensure any one year change/blip does not completely overwhelm the model.

c) This is the case except for rarer shots (sideline attempts, 45s, penalties etc.). For these we take all the shots in the database rather than applying the weighting. This gives us more certainty on the numbers.

Outcomes
Yes. Yes. Yes. We understand – just give us the bloody numbers …

Caveats
As ever Expt Pts is not the be all and end all. It is another tool to use when honing in on shooting efficacy. One tool (albeit a better one than Conversion Rates). No more, no less.

Consider these numbers as “Raw Expt Pts”. No overlay. No subjectivity. They are the product of the 80:20 rule. A newer model, which overlays strength of competition and game state, is currently in production. The thought behind this updated version is expanded upon here.

That will undoubtedly produce better numbers but it is not necessarily something that can be transferred easily to club football. As such the numbers here are better in that respect.

Happy statting.

Gaoth Dobhair v Crossmaglen Ulster Club SF 2018

November 20, 2018

Crossmaglen had one possession, and one shot, more than Gaoth Dobhair. The kickouts were almost the mirror image of each other with both winning 13 of their own and 8 of the opposition’s. Crossmaglen didn’t give up the ball outside Gaoth Dobhair’s 45. Yet despite the closeness of the main metrics the game petered out to a comfortable seven point win for Gaoth Dobhair.

Not for the first time we end up writing that goals win games.

Before we move on; a quick note on the relentless nature of the opening period in this game. Up until the 2nd goal at the end of the 12th minute there were 21 possessions. Convert that to a typical intercounty game (~76 minutes) and it put the game on pace for 120-125 possessions which is genuinely unheard of. The highest I have, in an intercounty Championship game, since 2015 is 116. And that start wasn’t a mistaken ridden turnover fest either. There were 17 shots in those 21 resulting in 14 kickouts which really should have slowed the game down. The game just opened up at a phenomenally (unsustainable) pace.

When Gaoth Dobhair had the ball

Gaoth Dobhair produced 0.53 points per possession which eclipsed their excellent 0.47 from when we last saw them in the county final against Naomh Conaill. The way they achieved it was very different however.

In the county final they relied on excellent accuracy on point attempts; 69% from play (0 – 09 from 13 & Expt Pts of +2.48) and 80% from deadballs (0 – 08 from 10 & Expt Pts -0.01). They didn’t produce a shot on goal. As can be seen from the shot chart above their radar was off on point taking (0 – 10 from 22 for 45% on all point attempts; Expt Pt of -1.59) however that didn’t matter – their running game pulled Crossmaglen apart producing 4-01 from just five shots at goal.

On the day that’s all that mattered. Going forward the positives they will undoubtedly take are the fact that they produced and finished goal chances, created very good point opportunities – in that there were no wild swings from the wings – and showed in the county final that they can convert. Goal chances. Good point attempts. High Conversion Rate. Put even two of those three together and they are a formidable attacking unit. All three and …

Dara Ó Baoill had a day of days. Undoubtedly the highlight was scoring 3 – 00 from his only three shots but he also plucked two Marks off Crossmaglen kickouts that led to two shots as well as providing the vital block to deflect McKenna’s goal chance early in the 2nd half.

Ó Baoill was ably supported by Mac Niallais & Ó Casaide up front as they combined for 1 – 05 from 8 shots from play (Expt Pts +3.12). This follows on from the 0 – 04 from 7 (Expt Pts +0.51) they produced in the county final.

Mac Niallais was also very busy around the park topping the assists chart with five.

When Crossmaglen had the ball

Nothing in the numbers will do justice to the way Crossmaglen play but you can see glimpses of what they look to do therein. Not once did they turn the ball over outside Gaoth Dobhair’s 45 which is very unusual. As a counterpoint Crossmaglen got their hands on nine turnovers outside their own 45. They managed to do this by judicial use of the kick pass through the lines before looking to move the ball inside.

On top of ball control their shooting was very good; 0 – 09 from 17 (Expt Pts +1.78) from play and 0 – 07 from 9 (Expt Pts +0.17) on deadballs. It was their lack of goal chances that hurt them. Just the two in total, both in the second half, with the second coming in the 61st minute when the game was done.

That’s not to say they did not threaten Gaoth Dobhair. Despite the gut punches of two early goals, followed by a third from the penalty spot and then another punch with the red card just after half time they were still standing after 40 minutes having reduced the deficit from 0 – 09 to 0 – 04. Aaron Kernan came through unmarked, just to the left of the D no more than 25m out, with what is a readily scoreable chance to reduce it further to 0 – 03 but instead dropped it into the goalkeeper’s hands. Gaoth Dobhair launched an attack and 30seconds later C Ó Casaide popped over a point after a fortuitous bounce placed a Crossmaglen interception in his lap. From a possible gap of 0 – 03 they were 0 – 05 behind 30seconds later via a lucky bounce and Crossmaglen never got as close again.

A quick note before we leave Crossmaglen. This is the 3rd club game that has been covered on the blog (aforementioned Donegal county final as well as the Roscommon County final) this year and in all three the losing team has had a man sent off just after half time. Now in all three cases the team were chasing (either on the scoreboard or in general play) but the cause was made immeasurably more difficult by being reduced to 14.

Kickouts

On the surface things were very even with both teams having the same returns; winning 13 of their own and 8 of the opposition’s. In terms of a contest however Crossmaglen came out on top winning possession 63% (15 – 9) of the time when the ball crossed the 45 and claiming five marks to Gaoth Dobhair’s three.

They were able, somewhat, to press this advantage producing three more shots and scoring 0-03 more than Gaoth Dobhair from these kickouts. It wasn’t enough however. Gaoth Dobhair were able to get half (11 of 21) of their kickouts away short and in doing so produced seven shot scoring 2 – 02.

Gaoth Dobhair v Naomh Conaill Donegal SFC Final 2018

October 23, 2018

In many ways the Donegal final was very similar to the Roscommon final from the previous weekend (review here). The losing team had a man sent off just after half time but the winning team was already imposing themselves (Clann na nGael were ahead through the main metrics if not the scoreboard). In both games the losing team had excellent shooting metrics up until the red card but then things fell apart thereafter (whether that’s due to the red card or scoreboard pressure is a moot point).

One other point that struck me when doing this game was the pace of it. There were a total of just 69 possessions throughout the game. The Roscommon final had 75. The average for Championship intercounty games over the last four years is 96. Now we need to be cognoscente of the fact that the intercounty game is 10 minutes longer and that our club sample is a grand total of two! But it is interesting nonetheless.

When Gaoth Dobhair had the ball

Generally when Gaoth Dobhair moved the ball they did so efficiently with a 78% Attack Rate and an 82% Shot Rate. (Comparing like with like Clann na nGael manufactured remarkably similar returns; a 79% Attack Rate and 82% Shot Rate).

What really stood to them however was their shooting. They produced a 74% Conversion Rate to return 0.47 points per possession. They are both very good numbers.

How this was produced is interesting. They didn’t manufacture a shot at goal and were reliant on deadballs to a large degree with 43% (10 of 23) of their shots coming from here. They converted 80% (0 – 08 from the 10) of these but that was more or less bang on average (Expt pts of -0.05) for where the frees were taken from.

I say “reliant” but that is over egging it a bit as their point taking was very good. They were 69% on 13 attempts scoring ~2.5pts more than expected (yes yes I know you can’t score half a point ….).

As can be seen from the below chart their shot selection was very good – or conservative depending on your point of view – with everything being within ~30metres and nothing wild from the wings.

Also noteworthy that all 13 shots came from just five players with no defensive player (or at least those with a defensive number on their back!) taking a shot.

When Naomh Conaill had the ball

Though only two points behind at the break Naomh Conaill were only chugging along in the first half. They managed to stay in the game through frees (0 – 04 from 4; Expt Pts +1.07) with their half being bookended by two points in the 1st and 32nd minute. That left 30 minutes in between where they recorded just the two attempts from play and didn’t score off either.

Gaoth Dobhair’s defence tightened up in the second half giving up just the one shot from a free meaning that, with 14 men, Naomh Conaill had to produce from play. And unfortunately they were unable to do so scoring 1 – 01 from 9 attempts with an Expt Pts of -2.47. Part of that negative Expt Pts was the two missed goal attempts from E O’Donnell and J O’Malley however they were also 0 – 01 from 6 on point attempts.

Kickouts

By the numbers the kickout battle was relatively even with Gaoth Dobhair coming out 19 – 17 on top. However Naomh Conaill were only able to keep on Gaoth Dobhair’s coat tails through their short ones. When the ball went past the 45 Gaoth Dobhair came out 17 – 11 on top and manufactured four more shots from those kickouts won (10 shots scoring 0 – 06 as against six shots scoring 0 – 01).

Clann na nGael v St. Brigids; Roscommon SFC Final 2018

October 17, 2018

The above table is split by halves however it can also be taken as a proxy for before/after the red card (in the 40th minute)

It highlights two aspects; firstly how utterly dominant Clann na nGael were post the red card but also, and probably more importantly, how this was no fluke as the platform had been laid in that opening 40 minutes when it was 15v15.

In those opening 40 minutes Clann na NGael had five more possessions and four more shots. Yes at the time of the red card there was only one point in it but that was due to excellent St. Brigids’ accuracy (83% Conversion Rate at that point with an Expt Pts of +3.57) more than anything else. Once the red card came the dam burst.

When Clann na nGael had the ball


Shot charts; disc = successful & “x” = unsuccessful. Yellow = deadball, red = attempt on goal, black = point attempt from play in the 1st half and white = point attempt from play in the 2nd half

… they were pretty devastating. 70% Conversion Rate and 0.68 points per possession are both excellent metrics. Every part of their attacking play was functioning but the game was cracked open with two goals in the 44th minute just after Brigids had levelled the game.

In total Clann had six shots at goal, with five different players having an attempt, returning 4 – 00 including the type of quick thinking from their sub Callinan for the 3rd goal (if anyone hasn’t seen it the clip is embedded here) which epitomised their all-round sharp display.

Scoring four goals means that to lose you either need to have a calamity on your remaining shooting or the opposition need to have an absolute worldly of a game. Neither happened here. Indeed the remainder of Clann’s shooting was as good as their shots at goal returning 69% (0 – 09 from 13; Expt pts +2.7) on point attempts which included two monsters from the two Shines. Donie Shine was also exemplary from deadballs scoring 0 – 06 from 8 on point attempts (including 0 – 02 from three 45s) as well as slotting a penalty. Indeed one of those misses was from the apex of the 20m line and sideline on the right with the right. Still not entirely convinced he was even going for a point with that looking at the angle!

Donie scoring 1 – 07 will rightly get the plaudits but he was ably supported on the attacking front by both Lennon & Fahy who combined for 1 – 05 from just 7 shots (86%; Expt Pts of +4.0). Apart from his shooting Fahy also had a quietly effective game as the link man providing three primary assists, setting up Dunning for the pivotal 2nd goal and winning a free for Shine to convert.

One aspect Clann may look at as they enter into the Connacht campaign was the fact that they got turned over six times outside the opposition’s 45. Brigids manufactured three shots and 0 – 02 from these six possessions but other teams will be more clinical.

When St. Brigids had the ball

In fairness to Brigids’ attacking unit they were also on point converting 87% (Expt Pts of +4.5). Their points per possession, in isolation, at 0.45 is very good. But the chasm between that and Clann’s 0.64, and the fact that they produced a lower return off an excellent Conversion Rate points to their deficiency; (a) they only scored one goal and (b) they just didn’t manufacture enough shots.

On the shot count; Brigids produced 12 fewer shots than Clann through a combination of having less possessions (33 to Clann’s 42) and a poorer Shot Rate (60% to Clann’s 82%).
They were in a hole to start with by having less possessions … they then dug further by not being able to convert those possessions they progressed into an attacking position into a shot.

Once they did pull the trigger they were every bit Clann’s equal with 71% (0 – 05 from 7; Expt Pts of +1.5) on point attempts, 1 – 01 from their two shots at goal and 100% (0 – 06 from 6) on their frees.

There just wasn’t enough shots

Senan Kilbride was very good early doors scoring 1 – 03 from 4 shots (including one free) in the first 15 minutes however the Clann defence got on top thereafter and he didn’t have another shot from play for the entire game.

A combination of the red card and Kilbride being marshalled saw Brigids attack being stifled to such an extent that they only produced two shots from play in the 2nd half

Kickouts

Clann na nGael absolutely destroyed Brigids on kickouts. The overall numbers show Clann na nGael gaining possession on 20 to Brigids 17 with the count being 12-10 on those that travelled past the 45. Nothing untoward there you might say but it was what came off the kickouts that was decisive.

Of the 20 kickouts they won Clann na Gael progressed 15 (75%) to a shot … Brigids manufactured seven shots off the 17 (41%) kickouts they won. Clann scored a barely creditable 3 – 09 directly off kickouts whilst only conceding 1 – 06.