In 2015 we introduced the idea of Expected Wins (“Expt Wins”) which reviews a team’s season, on a game by game basis, versus what they were expected to do using bookmaker’s odds. There are undoubtedly drawbacks to this which are expanded upon in the original article (here) however it is an interesting prism to view the season through rather than just looking at those that had a “good Championship”
2016 Top Performers
| Team | Games played | Wins | Win % | Expt Wins | above/below Expt Pts | Win % rank | Expt Wins rank |
| Clare | 14 | 9 | 64% | 5.465 | +3.535 | 5 | 1 |
| Dublin | 16 | 15 | 94% | 12.218 | +2.782 | 1 | 2 |
| Longford | 10 | 5 | 50% | 3.430 | +1.570 | =11 | 3 |
| Louth | 11 | 7 | 64% | 5.483 | +1.517 | 6 | 4 |
| Carlow | 10 | 4 | 40% | 2.750 | +1.250 | =18 | 5 |
As can be expected those teams that have a good winning percentage are also high up on the Expt Wins ranking. Keep winning and you’ll consistently outperform your odds and thus your Expected Wins. Dublin, despite their very short odds at times and thus very high Expt Win total, being the poster child for this.
The two teams that had the most unexpected run in the Championship – Clare and Tipperary – are both comfortably in the top10 (Tipperary are joint 6th with an Expt Win total of +0.889) as they made a mockery of their odds at times. Indeed Clare also had an excellent league campaign, winning five of their eight games and picking up the Division 3 title, which helped them climb to first in the table.
Longford had a lesser league campaign winning three of their seven games but completed one of the shocks of the Championship beating Monaghan away in the qualifiers at odds of 15/2 which accounted for nearly all their positive Expt Win total. Removing the bookmaker’s margin they were expected to win that game ~8% of the time.
Perhaps the biggest surprise is Carlow. They won three games in the league for the first time since 2012 (when there was an extra game as Kilkenny played boosting everyone’s win volume in Division4!) whilst also recording only their second Championship win since the end of the 2011 campaign. You won’t read about Carlow having a good season anywhere … but the fact they outperformed expectations to such an extent should ensure it is considered as such.
Versus the Handicap
Another way to review a team is through the prism of the handicap. Bookmakers will tell you that they set the handicap line according to what they think their customers will back, thus giving them an even book, rather than the respective merits of the teams. Public perception, along with the strengths of the team, thus feeds into the handicap line. Even still it is quite a good barometer of how teams are expected to perform. So how did teams fare against the handicap and also the two rankings above?
| Team | Games played | Games covered | Cover % | Cover Rank | Win % rank | Expt Wins rank |
| Kerry | 13 | 10 | 76.9% | 1 | =2 | =6 |
| Louth | 11 | 8 | 72.7% | =2 | 6 | 4 |
| Fermanagh | 11 | 8 | 72.7% | =2 | =20 | 11 |
| Tyrone | 13 | 8 | 61.5% | =4 | =2 | =8 |
| Cavan | 13 | 8 | 61.5% | =4 | =10 | 9 |
Only Louth appear in the Top5 of both the Expt Win and Handicap rankings though in truth all 5 that covered the handicaps most often were also high up in the Expt Wins Ranking.
Fermanagh may have only won four of their 11 games in 2016 (two at home in the league, the home win versus Antrim in the Ulster Championship and then away to Wexford in the qualifiers) however they were a tough nut to crack with only 3 teams managing to beat them on the handicap (Cavan winning by 6 in Brewster Park, Derry in the opening round of the league and Donegal in the Ulster championship). Indeed that Cavan game was the only one of the five that Fermanagh played at home where they failed to cover the handicap. We saw something similar in 2015 when they covered in five of the six games played at home. Fortress Brewster!
But this all buries the lead. Kerry were excellent against the handicap (see Note1) where they only failed to cover in the opening two rounds of the league, against Dublin and Roscommon, and again in the league final. We have seen a phenomenon of double digit favourites tending not to cover (see Note2) but when a big favourite in 2016 (11 + 10 versus Clare in their two games and 9 versus Tipperary in the Munster final) Kerry covered each time. They don’t get dragged down by “lesser” opposition – they play to their own level.
2016 Worst Performers
| Team | Games played | Wins | Win % | Expt Wins | above/below Expt Pts | Win % rank | Expt Wins rank |
| Cork | 11 | 5 | 45% | 6.617 | -1.617 | 15 | 28 |
| Limerick | 10 | 1 | 10% | 2.799 | -1.799 | 31 | 29 |
| Monaghan | 14 | 4 | 36% | 5.829 | -1.829 | =20 | 30 |
| Down | 9 | 0 | 0% | 1.960 | -1.960 | 32 | 31 |
| Armagh | 10 | 2 | 20% | 3.963 | -1.963 | 29 | 32 |
It is no surprise, given that league games can make up 60% to 70% of a poor team’s season that relegated teams feature heavily here. Between them Cork, Down, Armagh & Limerick mustered five wins from their 28 league games.
Down didn’t register a win in 2016 however Armagh, despite winning two games, came out slightly worse on Expt Wins. This is due to the fact that they were expected to be competitive in Division2. Outside of the Round6 game away to Tyrone, when the reality of their form was beginning to catch up with their odds, the largest price they were in any league game was 7/4. They also played three (see Note3) Championship games where they were given a good chance of winning each (2/1, 11/10 & 9/4) but came away with three losses.
Down on the other hand started slowly and continued to plummet. They may have lost all nine games but were only ever expected to win ~1.96 of those. Armagh were expected to win ~3.96 of theirs.
Monaghan had an average league campaign winning three of their seven games when they were expected to win ~3.1 games. Their issues were in the Championship where they had two 50:50 games with Donegal but won neither and then lost as 1/12 favourites at home to Longford. That loss alone equates to -0.893 Expt Wins.
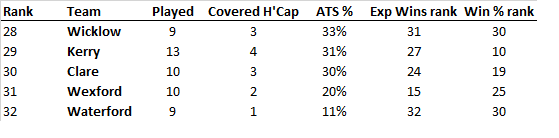
Versus the handicap
| Team | Games played | Games covered | Cover % | Cover Rank | Win % rank | Expt Wins rank |
| Laois | 12 | 4 | 33.3% | =28 | =24 | =23 |
| Derry | 12 | 4 | 33.3% | =28 | 17 | 25 |
| Waterford | 9 | 3 | 33.3% | =28 | 28 | 27 |
| Down | 9 | 3 | 33.3% | =28 | 32 | 31 |
| Wicklow | 9 | 2 | 22.2% | 32 | =24 | 21 |
This is the “hope you weren’t relying on these guys throughout the year” listing.
Similar to the positive performers table there is only one team – Down – that appears in the worst list for both Expt Wins and handicap rankings. Again like the top performers those at the bottom of the handicap ranking are also in the bottom third of the Expt Wins ranking.
Waterford & Wicklow appear in the bottom 5 for the second year running. Combining 2015 & 2016 they are running at a 28% cover rate (9 games from 32).
We have already seen one of the teams relegated from Division2 – Armagh – appear in the “worst performing” category so it’s no surprise to see the other two teams that filled out the bottom three of that division make an appearance here. Division2 was seen as ultra-competitive at the start of the year and this was followed through with a high volume of games with a close handicap (see Note4). Once teams started to underperform they were going to struggle against the handicap.
Notes
Note1; what is more remarkable, and a cautionary tale re taking trends at face value, is that Kerry were in the bottom two in this metric in 2015. Then they covered in 31% (4 out of 13) of their games. We must always remember that we are dealing with very small sample sizes (and margins) here where a point or two can have a huge effect.
Note2; twenty teams since the start of the 2015 league campaign have started as double digit favourites. Only 7 (35%) have managed to cover this.
Note3; Although the first Laois game was declared null and void it was played as if it was a Championship game and we have odds & a result for it so it is included overall.
Note4; 86% (25 games out of 29) had a handicap of 2 or less in Division2. This was 52% for Division1, 83% for Division3 and 48% for Division4
Thinking out loud; In GAA betting the handicap is intrinsically linked to the match price. If those with high Expt Wins (essentially odds on shots) generally cover at a better rate, and the corollary is true for those with low Expt Wins are the linkages between match price and handicap line “out”?