Posts Tagged ‘Derry’

Derry v Down 1994 Ulster

April 23, 2020

This is the third game in the historic series (the 1985 All Ireland final between Kerry & Dublin can be found here whilst game4 of the 1991 Leinster series between Dublin and Meath can be found here) and a few observations highlighted in those games still hold true.

The game was different. The component parts – kickouts, fielding, shooting – were the same, and the current metrics we have for measuring them are probably a fair comparison, but the overarching principles that underlined how teams approached the game were different. Very different. Possession was not as important as it is now – clearing your lines was the first thought. This led to a lot more contested balls which in turn nullifies some of the metrics (points per possession, Attack Rates) we now view a game through (see note1).

In this game there were 113 team possessions with 31% of those possessions having just one player control the ball. 60% had no more than two players control the ball. No team possession had more than seven individual player possessions. This was very similar to that aforementioned 1991 game where there were 114 total possessions with 32% having one player possession, 63% having two player possessions and only one possession in the whole game having more than six individual player possessions (incidentally that was Kevin Foley’s goal!).

Compared to recent years? The four finals in the last three years have averaged 91 total possessions with 7% involving one player, 21% involving no more than two players and a whopping 35% with seven or more players controlling the ball. The game was different.

When Down had the ball

Overall Down had three fewer possessions throughout the game but managed to produce three more shots. (Incidentally that is now a clean sweep in these historic games for the team losing the possession count but winning the game). In and of itself this tells us something about that Down forward line; when they got the ball they were able to manufacture a shot. Again for the four finals in the last three years the Shot Rate (getting a shot off from possessions inside the 45) was 79.5%. Down produced a Shot Rate of 89% here.


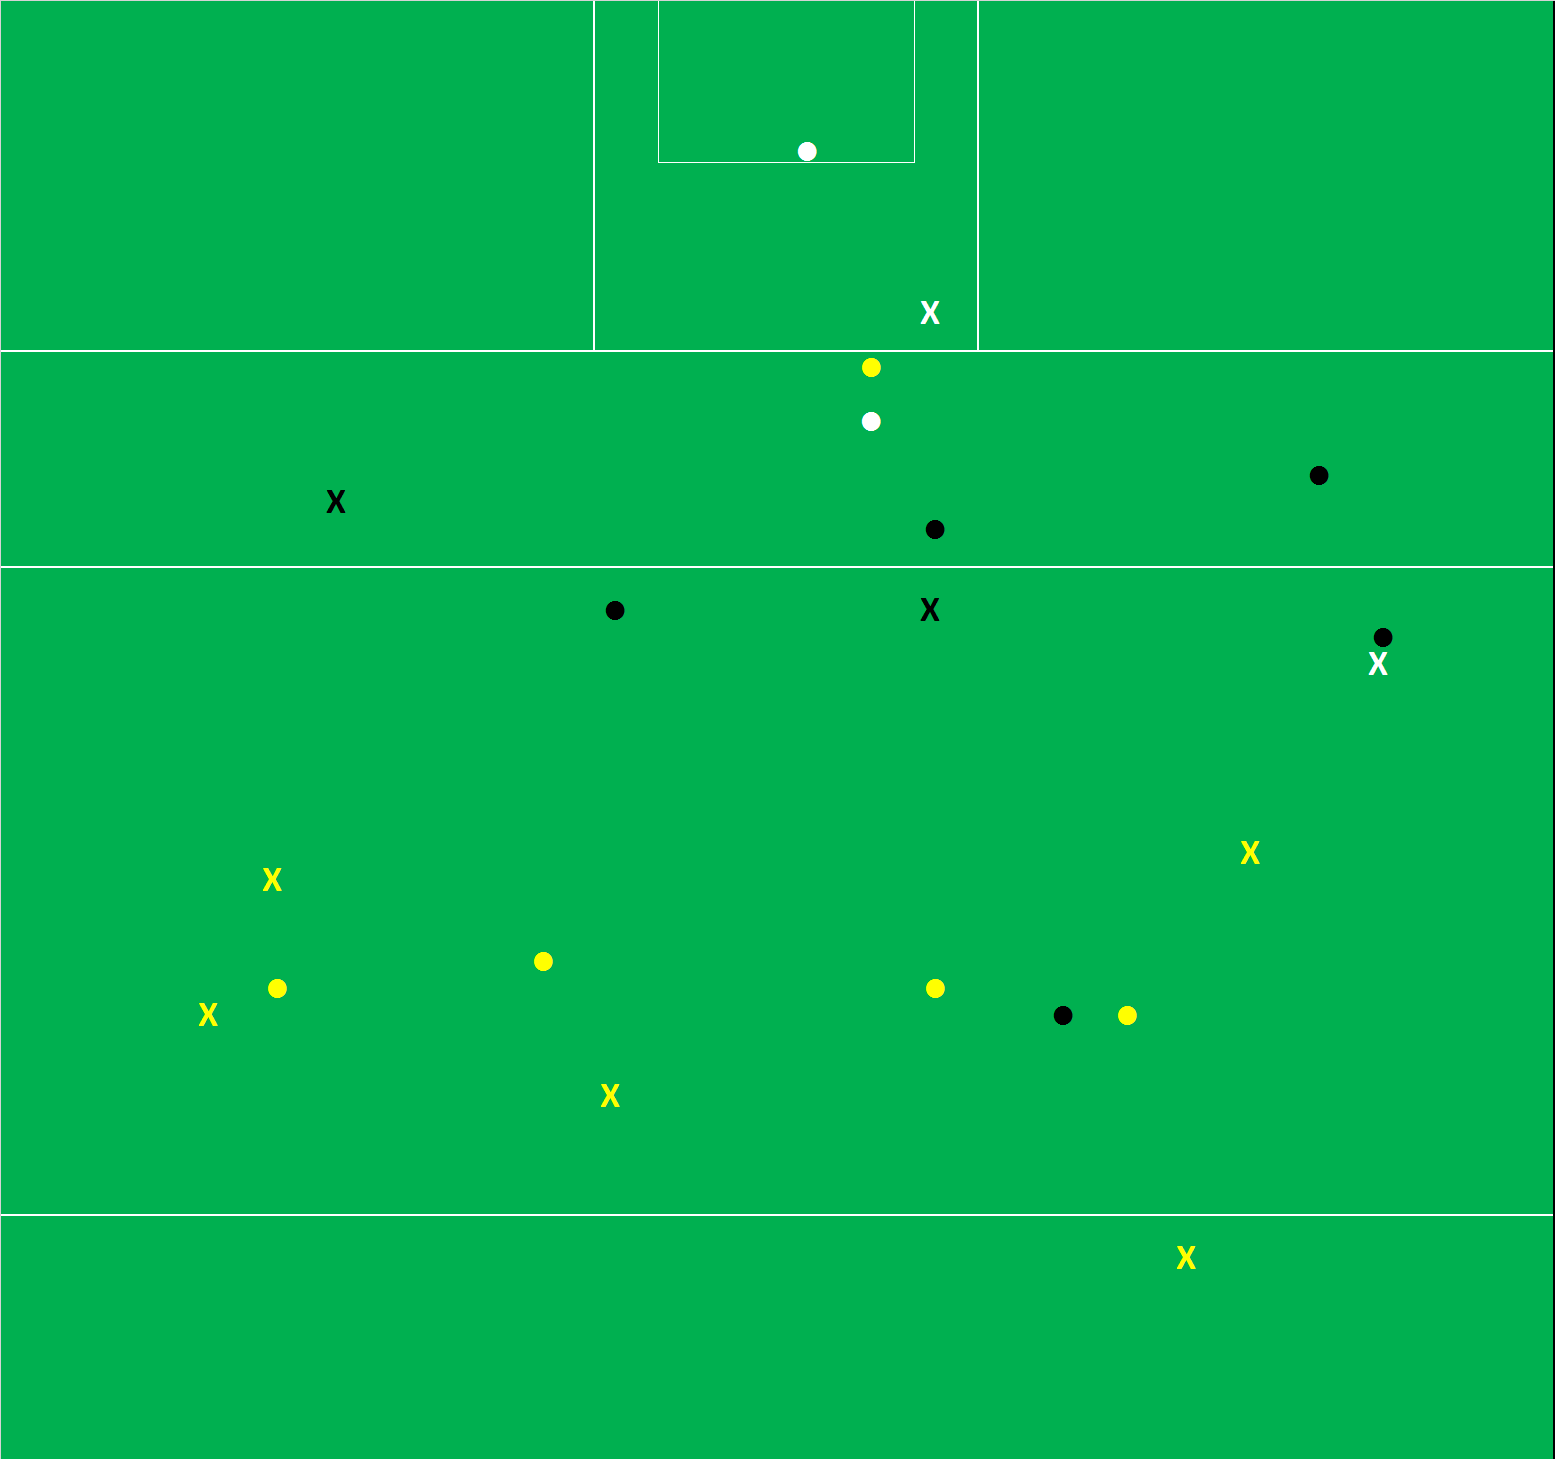
Disc = score, X= miss; yellow = deadball, red = attempt on goal, black = point attempt from play 1st half, white = 2nd half

That Shot Rate was somewhat inflated by the sheer volume of deadball attempts – eleven in total (10x frees and 1x 45). Eleven is high both when compared to current trends (last two years have seen an average of 6.4 deadballs per team per game) and historically. The four teams in the previously mentioned historic games averaged 8.0 shots from deadballs per team. Greg McCartan had an off day from the ground returning 0-04 from 10 which is about 0-03 below (Expt pts -2.96) what the modern free takers would be expected to return (see note 2)

Given the shots they attempted Down were expected to score 1-18 (Expt pts of 21.5). We have touched on the poor returns from deadballs above but their shooting from play was more or less in line with modern returns (1-10 from 21; 52% Conversion Rate & Expt pts -0.74). They had three clear cut goal chances, which, incidentally, were their last three attempt from play, returning 1-00 leaving a stat line of 56% (0-10 from 18) and Expt Pts of -0.23 for point attempts from play. This is good shooting in an All-Ireland final (point attempts from play were 53% for the four finals from 2017) and, as we will touch upon below, was greatly aided by their decision making.

Mickey Linden was exceptional scoring 0-06 from 8 (Expt pts +1.41). Three with the right, two with the left and one fisted effort … all after missing a very simple fisted point with his first attempt. In the first half he was 0-05 from 7 whilst also being directly involved in the build up to two further shots. Derry got to grips with him in the second half, ostensibly by moving McKeever across to pick him up, however he was still pivotal getting out in front and shifting the ball with quick hands for McCabe’s goal and also letting the ball into the forward line for the Whitnall attempt that was pulled wide.

Part of Linden’s success was his link play with Aidan Farrell. Farrell, as the starting target man, “only” came away with 0-01, however he was the primary assist on six Down shots in the first half including 0-03 of Mickey Linden’s haul. In a nod to his flexibility, and ability, he was then brought further out to field to try and stymie the influence Gilligan & Tohill were having there.

McCabe must go down as one of the most impactful substitutes. He was only on the pitch for 10 minutes but was centrally involved in all three of Down’s goal attempts, which were condensed into a four minute period from the 63rd minute, whilst also shifting the ball to Whitnall who was then fouled for the last score of the game. Incidentally there is a great interview with him from 2019 here

When Derry had the ball

Derry were not as efficient as Down, either in terms of manufacturing shots from attacks (a shot rate of 78% versus 89% for Down), nor in converting those shots (a Conversion Rate of 45% versus 53% for Down).

Derry’s deadball returns were below what was expected (50%; 0-04 from 8 Expt pts -1.60) but not as poor as Down. Their goal attempts (1-01 from 2) also returned more than Down’s did. Which all leads to a very poor day on their point attempts.


Disc = score, X= miss; black = point attempt from play 1st half, white= 2nd half

Derry’s point attempts are outlined above. The majority of them came from “outside” where their accuracy fell apart in the second half; they missed all seven after going 0-03 from 5 in the first half. In fact when we compare the Down shots from play, versus the Derry ones, we can see a clear distinction.


Disc = score, X= miss; black = Derry point attempt from play, white = Down

A lot of Down’s comparative accuracy can be attributed to where the shots came from. The aforementioned decision making. Expanding the inside/outside zone (granted I have made this fit the argument but still …) Derry had 10 shots from outside the bulk of Down’s shots and scored just 0-02 from those 10 attempts. Inside both teams were more or less as accurate as each other; both returned 56% (Derry 0-05 from 9 and Down 0-09 from 15). Down’s chances were just heavily weighted to the more favourable scoring opportunities.

No one had a “Mickey Linden” day for Derry but Joe Brolly was very good. Not only did he convert both his attempts but he was also the primary assist in seven more shots including winning three frees and setting up McCusker for the goal

Kickouts

Generally speaking Derry dominated the kickouts. They gained 11 extra possessions (27 won versus 16 for Down) on the 43 kickouts without the volume being skewed towards them. They won 64% of their own kickouts (14 of 22) but also 62% of Down’s (13 of 21). They were dominant. Using current rules I had them claiming seven Marks, to Down’s three, with Gilligan & Tohill bagging three apiece (hence why Farrell was moved out)

But they didn’t turn this dominance into a scoreboard effect. Derry scored 0-05 directly off the kickout possessions won, which results in 0.19 points per possession (ppp). Down scored 1-05 from the 16 kickouts they won for 0.50 ppp

Unlike the modern game short kickouts were not really a “thing” with only five (12%) of the 43 kickouts dropping short of the 45. For context in the last four All-Ireland finals 58% of kickouts went short.

The kickout rules were different back in 1994. If a kickout was taken after a score it was taken from the 20m line. Otherwise it was taken from the edge of the small square. This had a huge variance on the length of the kickout and from Derry’s perspective the outcome. Below is their kickout chart with those kickouts post a score in white.


Disc = Derry gained possession, X= Down gained possession; white = after a score, black= after a wide

You can see that all bar three taken post a score made it past the 65 – basically onto Gilligan & Tohill – with two dropping just short of the 65. Derry dominated around the middle winning 10 of 14. But when the kickout was taken from the edge of the square Down managed to win 4 of 7 … three of these seven, circled in red, came in the last six minutes two of which led to the McCabe goal chances. Looking at the length of these three kickouts compared to the other four is it possible that the sheer volume of long kickouts emptied McCusker’s leg?

Note1
As an example of the differing emphasis there were 29 possessions started outside both team’s 65s in this game compared to an average of 7.75 over the past four All Ireland finals

Note2
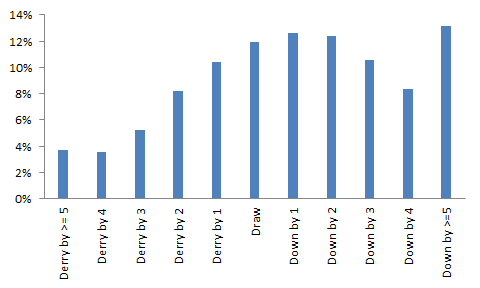
This is another area, along with the possession count, that the modern day game distances itself from these historic games. And puts the accuracy of modern day free takers, such as Dean Rock and Séan O’Shea, into context. In the three historic games reviewed so far the teams combined for a deadball return of 49% (0-25 from 51). The average from the past five Championships was 72.6%. Rock, in the most pressurised of games, is running at 73% in All Ireland finals.

The three historic games’ deadballs are below. Now they have taken more long range pot shots than you are likely to see today but as a rule of thumb the target for current free takers is 85-90% “inside” and 50% “outside”. These historic returns are below expected on the “inside” (82%; 0-18 from 22) but well behind on the “outside” (24%; 0-07 from 29)

Derry v Tyrone 2017 Ulster

May 30, 2017

For those new to the blog, or who haven’t been here for a while, please find a refresher on the definitions and how the numbers are compiled here

Team Possessions Attacks Shots Scores Exp Pts
Derry 44 38 26 0 – 11 13.81
Tyrone 53 49 42 0 – 22 23.59

That is as comfortable a game as a team is likely to have. Tyrone had 9 more possessions, 11 more attacks and a whopping 16 more shots than Derry. There are examples of such disparities where teams begin to rack up numbers towards the back end of a game, as the competitive edge has gone out of the encounter, but (sadly) this was not the case here. When the game was – notionally – at its most competitive in the first half Tyrone had six more attacks and eight more shots.

Derry shooting
Although each game takes on a life of its own there are some stark similarities to the 2016 meeting (see here) . Then the gap in Expt Pts was ~8.5pts. Here it was just under 10pts. Below is a straight lift from the 2016 game review …

Derry had 18 attempts for a point from play throughout the game; only two of those came from inside the prime scoring zone (extending from the D in towards the goal) with none at all in the 2nd half. Outside of this only one other point attempt came from inside the 20m line. Derry’s fundamental lack of attacking speed allowed Tyrone to set defensively which in turn aided them in repelling Derry away from the most productive shooting zones. Derry were then forced to try less productive long range efforts.

Below are the Derry point attempts from play in the first half. Their whole game shot chart is in the Appendix. You can’t keep doing the same thing over and over and expect different results.

Tyrone shooting
Tyrone had their way with the Derry defence returning a 92% Attack Rate & an 86% Shot Rate. This was off an already enlarged possession total. What will (should!) concern them however is – as ever – their shooting. A score of 0 – 22 looks very impressive but with the chances they had they should have scored more (total Ext Pts of -1.59) – the high score was as a result of volume rather than accuracy.

It could be argued that this view – that they had a poor shooting outing – is on the harsh end as the negative Expt Pts return includes their two goal attempts being blocked/saved as well as some simple frees being missed (Harte’s left footed effort in the first minute being a prime example). When we only review point attempts from play the view is somewhat rosier; 0 – 13 from 27 attempts (an average. conversion rate of 48% but a positive Expt Pts of +1.11 indicating harder shots were converted).

Dig a little deeper though and 21 of those 27 shots were taken under no – or very little – pressure (another indictment of the Derry defence). Yes the next day their frees, or goal chances, might compensate for more pressurised point attempts. But what happens in August when they don’t get a goal, get five frees instead of 11 in a game and their shooting comes under a lot more pressure?

Tyrone free taking
Free taking has been a problem for Tyrone. Over the last 3 Championships they have returned a poor 61% (0 – 39 from 64; Expt Pts -4.00).

Shots Scores Conversion % Expt Pts Vs Expt Pts
D McCurry 17 0 – 10 59% 11.24 -1.24
N Morgan 14 0 – 06 43% 7.05 -1.05
C McAlliskey 11 0 – 09 82% 7.84 1.16
R O’Neill 10 0 – 05 50% 8.15 -3.15
S Cavanagh 7 0 – 06 86% 5.22 0.78
P Harte 5 0 – 03 60% 3.50 -0.50

This 61% is in stark contrast to a combined 84% from Rock & C O’Connor over the last two years.

Against Derry they were 73% (0 – 08 from 11; Expt Pts -0.50). Again – in a game with little or no pressure – their shooting was below average. The one bright spark was Séan Cavanagh who hit 0 – 06 from7 (86%; Expt Pts +0.38). As the above table shows he hasn’t taken many frees of late but when he did he was accurate. That flowed through to this game.

As a designated starter, and given Tyrone’s travails of late, it may be best for Tyrone’s to leave him on the frees. If he does nothing more than hit average then this will be an improvement.

Appendix

Derry’s shot chart

Tyrone’s shot chart

x = missed, disc = score, yellow = deadball, black = 1st half from play, white = 2nd half, red = goal attempt

Derry v Tipperary 2016 AI Qualifiers

July 28, 2016

For those new to the blog, or who haven’t been here for a while, please find a refresher on the definitions and how the numbers are compiled here

Team Possessions Attacks Shots Scores Exp Pts
Derry 45 34 30 2 – 17 19.91
Tipperary 52 47 37 1 – 21 23.86

Tipperary controlled this game in many respects recording seven more possessions and 13 more attacks which culminated in seven extra shots. The drop from 13 additional attacks to just the seven extra shots can be attributed to Derry being more proficient at getting their shots off once inside the 45. The main reason Tipperary were within a whisker of going out of the Championship was Derry’s shooting.

Derry produced an Expt Pts tally of +6.09 which was bettered only by Tyrone’s +10.17 in the drawn game against Cavan when they smashed in 5-18 (as an aside the best Expt Pts games will always be those with a high volume of goals as you’re getting ~+1.8 Expt Pts for any that you convert).

Derry were aided by scoring 2-01 from their three goal chances (Expt Pts of +3.43) as well as converting all four frees (Expt Pts of +0.97) but their point taking really stood up converting 52% with an Expt Pts of +1.69.

It is hard to be critical given their overall returns but if you were to pick anything to review from their shooting display it would be the shot selection in the first half when playing in to the wind. Then they were 45% (0 – 05 from 11) with an Expt Pts return of -0.29. This is particularly harsh as it is viewed against the prism of their second half display (58%; 0 – 07 from 12 and +1.98) but in a one point game it is the small things that can be the making or breaking of a day.

Tipperary’s high score was not the product of excellent shooting but that of volume. 37 shots is an excellent return and ranks up there with the highest this year (Monaghan had 39 in their drubbing of Down). Their shooting was bang on average with a total Expt Pts of +0.14 recording Expt Pts tallies of -0.57 on goal attempts (1 – 00 from 3), -0.29 on deadballs (0 – 09 from 13) and +1.00 (0 – 12 from 21) on point attempts.

Sweeney & Quinlivan, working as an inside tandem, were extremely effective when shooting for points scoring a combined 0 – 07 from just eight shots (Expt Pts +2.53)

Derry’s defending late on

For all the excellent shooting above what stood out most was Derry’s defensive frailties in injury time. Below is a sequence of images from the 71st minute which shows any amount of space for the Tipperary forwards to roam into in the period

Equalising point

Derry Pic1 v Tipp

Tipperary attacked down the left but got stopped. Derry’s whole defence got sucked towards the ball however which meant that two quick passes to the right bye passed six Derry defenders and left an ocean of space for Sweeney to run in to for the equalising point. There is no Derry defender down the right or even covering in front

Leahy shot

Derry pic2 v Tipp

Tipperary won the subsequent kickout and attacked down the right which culminated in a blocked Leahy shot. Just before Leahy pulled the trigger however there was a moment when a simple popped hand pass (which came but was just out of reach of Leahy forcing him towards the by-line) would have created a three on one down Derry’s right.

Winning point

Derry pic3 v Tipp

Keane won a free after tackling Derry high up the pitch (as Derry were trying to exit following the Leahy blocked shot) and had a choice of players to choose from all of whom were in prime attacking position. He chose the right option in Sweeney but really could have given the ball to three players. In this instance Derry were trying to break with the ball, and win the game themselves, after winning a free to stop Tipperary but in doing so left their defence completely exposed.

And yet despite all this Derry still had a chance to draw level with the last shot of the game. In many ways it was a shame that the shot fell to Rogers as although he has the skill to convert that shot, and given his positioning he had to take the shot on, it was he that burst out of defence to create the chance. This after 75 minutes when there were players wilting all around and this was his first shot of the game. As mentioned he had to take it but I’ve no doubt the Derry sideline would have wished for someone else to be on the ball given the circumstances.

Kickouts

2 – 22 of the 3 – 38 scored on the day emanated from kickouts. With their quarter final against Galway on the horizon Tipperary will want to tighten up in this aspect. They lost 9 of their 22 kickouts but that total includes eight that went short. So of those that passed the 45m line they lost 64% (9 of 14) and managed to concede 2 – 04 from those nine losses. It is a rare day that your kickouts can be such a millstone and yet you come out the right side.

Derry v Tyrone 2016 Ulster

May 23, 2016

For those new to the blog, or who haven’t been here for a while, please find a refresher on the definitions and how the numbers are compiled here

Team Possessions Attacks Shots Scores Exp Pts
Derry 46 35 27 0 – 12 12.74
Tyrone 47 36 30 3 – 14 21.36

Despite Derry being down to at least 14 men for the last 20 minutes both teams produced similar total possession, attack and shot volumes. Unfortunately for Derry that was where the similarities ended.

Over the 70 minutes Derry amassed 289 individual player possessions (instances where a Derry player controlled the ball). That equates to 6.3 players on the ball per team possession with 93, or 32%, of those touches occurring inside Tyrone’s 45. Tyrone’s 47 team possessions included, in relative terms, a mere 201 player possessions (4.3 player possessions per team possession) with 56, or 28%, occurring inside Derry’s 45.

Tyrone were much more decisive and incisive, moving the ball at speed whilst Derry were ponderous eking out the metres in a series of hand passing necklaces around the main scoring zone. Yes they had 37 (93 to Tyrone’s 56) more player possessions inside the opposition’s 45 but the quality of those possessions is borne out in the Expected Points (Expt Pts) gap. Derry manufactured three less shots than Tyrone but more tellingly the shots they did produce were expected to score in the region of 8.5 points less than Tyrone’s. For all Derry’s possession there was no bite, no incisiveness and a lack of an end product.

Scoring Zone

One of the major factors in the margin of victory (and thus the Expected Points gap) was the type of shot attempted. As a unit both teams scored close to what was expected yet Tyrone dished out an eleven point beating with only three more shots. How so?

As stated previously Derry’s attacking play was ponderous allowing Tyrone to filter back and protect the D. Derry had 18 attempts for a point from play throughout the game; only two of those came from inside the prime scoring zone (extending from the D in towards the goal) with none at all in the 2nd half. Outside of this only one other point attempt came from inside the 20m line. Derry’s fundamental lack of attacking speed allowed Tyrone to set defensively which in turn aided them in repelling Derry away from the most productive shooting zones. Derry were then forced to try less productive long range efforts. Indeed in a testament to Tyrone’s defensive solidity one of the two point attempts that came from inside the scoring zone was blocked (McFaul’s effort just outside the 20m line in the 23rd minute).

Derry shooting from play
Derry shots from play

Derry’s shooting from these long range efforts was almost exactly what was expected; 0–05 scored from 15 attempts with an Exp Pts return of 5.11 for those 15 shots, but even with elevated shooting those chances are never going to keep pace with a team scoring at the rate Tyrone were.

Tyrone

Tyrone had 19 attempts at a point from play with five of these coming from inside the scoring zone. Another seven were attempted inside the 20m line. Not every shot inside the 20m line is the best option – Kevin Johnston’s attempt in the first minute being a prime example – but they are an indicator of a team getting in behind a defense. After being drawn up the field in an attempt to work their way through the Tyrone defensive shield Derry were unable to counter Tyrone’s attacking speed. This was best illustrated for Ronan O’Neill’s first goal when Brendan Rodgers was dispossessed inside Tyrone’s 45. Richard Donnelly chipped the loose ball off the ground to Mark Bradley and set out in support. Seven seconds and two hand passes later Donnelly launched a pinpoint pass, from outside the 45, to O’Neill on the edge of the square. Simple, direct, accurate and with no little degree of skill involved.

Goal attempts

In addition to the more advantageous point attempts Tyrone had six shots at goal converting three whilst Derry, again despite all the possession they had inside Tyrone’s 45, only manufactured two with both coming in the goal mouth scramble at the start of the 2nd half. In total 60% of Tyrone’s shots came from attempts from play either inside the main scoring zone or in close to goal. Only 19% of Derry’s came from similar positions.

Ultimately Tyrone moved with speed and purpose and despite having so much less of the ball (in terms of player possessions), and less of that ball inside Derry’s 45, their accuracy produced easier point taking opportunities and more goal chances.

Appendix

Shot Charts

Derry’s shooting
Derry shooting (V Tyrone 16)

Tyrone’s shooting
Tyrone shooting (V Derry 16)
x = missed, disc = score, yellow = deadball, black = 1st half from play, white = 2nd half, red = goal attempt


Players with >= 3 shots from play

Shots Scores Success Rate Exp Pts
R O’Neill (Tyrone) 4 2 – 01 75% 3.72
D McCurry (Tyrone) 4 0 – 03 75% 1.93
D Heavron (Derry) 4 0 – 02 50% 1.41
M Lynch (Derry) 4 0 – 01 25% 1.22
S Cavanagh (Tyrone) 3 0 – 01 33% 2.50

Derry V Donegal 2015 Ulster Championship

June 29, 2015

For those new to the blog, or who haven’t been here for a while, please find a refresher on the definitions and how the numbers are compiled here

Overall

Team Possessions Attacks Attack % Shots Shot % Scores Success % Weighting
Derry 43 35 81% 26 74% 10 38% -1.995
Donegal 51 40 78% 29 73% 10 34% -2.797
Avg 37.0 28.7 77.7% 14.7 51.2%

Pretty poor returns all round.

Under McGuinness Donegal were capable of these *stinkers* (Armagh QF in ’14 to name one) so in many ways I’m sure Donegal will take the win and move on. Still there will be areas that will be of concern. The first picture is taken 5 minutes in – Lynn has acres of space in the D. The defensive system completely disintegrated very early on.

20150627_211210

Below is with five minutes to go. Donegal fell asleep as Lynch stood over a free with the game in the melting pot. They switched off expecting him to take the shot at goal but he astutely shipped it across and Derry had free men over.

PhotoGrid_1435445010407

Derry? In many ways they shouldn’t have been in the game as normally – given Donegal’s accuracy – if you have 8 possessions less than Donegal you’re toast. However the fact that they were in the game with ten to go will make the ending galling. Niall Holly took a shot at 65:32 that dropped short. Derry didn’t touch the ball again until 69:44 after two reckless frees allowed Donegal to chew up the clock. The clock is your enemy two points down with five to go – don’t aid the opposition in its winding down!

Shots from Play

Team Shots Scores Success % Weighting
Derry 21 7 33% -2.054
Donegal 25 9 36% -1.478
Avgs 21.4 9.7 45.3%

Poor shooting from both teams. Donegal seemed to take poor options early on with three shots being blocked (McElhinney, Macniallais & McFadden) and it never picked up thereafter. In the first half when going for a point they scored 0 – 04 from 15 attempts (27% Success Rate) for a combined weighting of -2.497. Although the volume reduced the accuracy increased in the second half; 0 – 04 from 8 shots (50%) with a combined weighting of 0.695.

Derry in many ways were the exact opposite. 0 – 03 from 7 attempts (43% Success Rate) at a point in the first half but only 0 – 04 from 12 (33%) in the second with a combined weighting of -1.471. What might have aided that negative weighting was who was shooting – the last 8 Derry shots from play came from Johnston, Heron, McKaigue, Bradley, McFaul, Holly, Johnston & MacAtamney. You give credit to players for stepping up but I’m sure Derry management would have liked to have seen Lynch, Lynn & O’Boyle chip in.

One thing that did separate the two teams was the goal. Derry had two chances – one at either end of the game and got nothing from either. Donegal also had two chances but got the goal. That goal was a beautifully measured hand pass from Gallagher to O’Reilly, which meant that he didn’t have to check his stride, *but* he was only free due to a split second decision by Duffy. As you can see below Duffy has O’Reilly but as Gallagher breaks through the centre he moves across to cover the space. Derry had a man coming in to fill that gap; had Duffy held his run with O’Reilly it is likely that Gallagher would have checked the run or popped a point.

PhotoGrid_1435432321147

As I say that is a split second decision that Donegal were good enough to exploit. There are hundreds of them in a game that all feed in to the result – it is just that those in the build up to a goal are magnified.

Shots from deadballs

Player Shots Scores Success % Weighting
M Murphy (Donegal) 2 0 0% -1.077
P McBrearty (Donegal) 2 1 50% -0.242
E Bradley (Derry) 3 2 67% -0.178
M Lynch (Derry) 1 1 100% +0.731
C O’Boyle (Derry) 1 0 0% -0.494
team avgs 7.2 4.9 68.7%

I guess it is kind of surprising to only have nine shots at goal from deadballs in an Ulster game. In the Ulster Championship games covered so far this year there have been 19, 21 and 10.

That number gets whittles down again when you consider that 2 of the attempts were from outside the 45, one was a 45 and one was stuck out on the sideline. Five shots from deadballs in scoreable positions is testament to the discipline of both defences.

As to the quality of the strikes? Murphy’s weighting does not do justice to the difficulty of his strikes – having said that neither were struck with any quality. The same could be said of O’Boyle’s 45 whilst Bradley’s miss from the right was poor.

Apart from Lynch’s boomer it was a poor day all round

Kickouts

Derry’s kickouts Won % Turned into an attack % Shot %
Derry 10 50% 7 70% 6 60%
Donegal 10 50% 6 60% 4 40%
Donegal’s kickouts Won % Turned into an attack % Shot %
Derry 6 29% 5 83% 4 67%
Donegal 15 71% 13 87% 9 60%

Donegal absolutely lorded the kickouts – in many ways it was Derry’s good fortune that there weren’t more of them! In the first half Donegal won nine of the first ten kickouts with six of those wins coming off Derry kickouts. Derry kicked their first four long but lost three. This seemed to panic them and they lost the next two very poorly; one was short and the second was mid length straight to a Donegal man. Donegal really should have been further ahead given the volume of primary possession they had.

In the second half Derry had nine kickouts. They won five but all those went short – of the four that went long Donegal won all four and scored 1 – 01.

Donegal were relatively comfortable and in the main played it safe. 13 of their 21 kickouts landed short of the 65 with Donegal scooping up the ball on 12 occasions. When they went past the 65 they lost the possession battle 3 – 5.

Turnovers

Team giving up the ball Pass In the Tackle from a Shot Other
Derry 11 5 4 1
Donegal 17 3 8 1

One of the problems with just reporting the turnovers is that there is no context for the negative returns (as all turnovers are viewed negatively!). Donegal had 17 missed passes but five of these were boomers onto the square – how many of those stuck? Five turnovers from five attempts is obviously poor – but was it five from five? Or five from 10?

Bearing the above point in mind Neil Gallagher was involved in seven of those passing turnovers – misplacing a kicked pass three times and losing a contested ball on four occasions. That is not to say he had a poor day but rather to highlight how central he was to what Donegal were doing.

The eight turnovers from shots is poor – and probably not something that will be oft repeated. As commented upon above Donegal had a particularly poor shooting day and you would expect this to get better as the Summer progresses.

Derry were neater though Eoin Bradley had a tough day. As well as the four shots that were missed he was involved in another four turnovers.

Shot Charts

Derrys’s shooting
Derry shooting (V Donegal 15)
Donegal’s shooting
Donegal shooting (v Derry 15)
x = missed, disc = score, yellow = deadball, black = 1st half from play, white = 2nd half from play,

Players with >= 3 shots from play

Colm McFadden was given man of the match after converting two beauties however it seems to be forgotten that his four shots previous to that were poor with 1 being blocked, two landing in the goalkeeper’s hands and one going wide. Yes his two points were impressive but after 2014 I will need more than that to be convinced he is back.

Shots Scores Success % Weighting
C McFadden (Donegal) 6 2 33% -0.203
M Lynch (Derry) 4 1 25% -0.537
M McElhinney (Donegal) 4 1 25% -0.664
O MacNiallais (Donegal) 4 1 25% -0.717
E Bradley (Derry) 4 0 0% -1.742
M Murphy (Donegal) 3 2 67% +0.768

Derry V Down 2015 Ulster Championship

June 10, 2015

For those new to the blog, or who haven’t been here for a while, please find a refresher on the definitions and how the numbers are compiled here

Overall

Team Possessions Attacks Attack % Shots Shot % Scores Success % Weighting
Derry 45 35 78% 21 60% 12 57% -0.736
Down 44 33 75% 24 76% 11 44% -2.819
Avg 37.0 28.7 77.7% 14.7 51.2%

Despite being reduced to 14 men for 35 minutes this will surely be a game that Down will bitterly regret. They had ample opportunity to win – manufacturing four more shots – but their shooting boots were just not on. Especially from play.

Below are the outcomes from running the two team’s shots through 20000 simulations.

Outcome simulation

Down win the game 57% of the time with Derry winning 31%. It is not so much that Derry were “lucky” – this is after all why the games are played on the pitch and not on a spreadsheet – but Down will be kicking themselves. Yes being down to 14 men for the entire second half probably fed into mental & physical fatigue – reflected in poor shooting options – but even with the poor options Down should have scored 0 – 14. They *should* have won.

What of Derry? In that second half they had 8 shots from 21 possessions. Down’s 14 men had 14 shots from 22 possessions. There really is no way you should be that far behind in terms of the headline metrics playing a full half with an extra man. Just a very poor second half outing from them.

Shots from Play

Team Shots Scores Success % Weighting
Derry 11 7 64% +1.180
Down 16 4 25% -3.285
Avgs 21.4 9.7 45.3%

Neither team had a shot at goal – nor looked like manufacturing one.

As mentioned Down’s shooting from play was very poor. Kevin McKernan hit two superb points in the first half but outside of that Down were 14% (2 from 14) with a combined weighting of -4.439 including some horrendous shot selection and execution.

Lynch’s shooting was wonderful (3 from 4; weighting of +0.996) for Derry – especially those two points late in the first half that opened up the gap coming up to half time. What should be of great concern however is the fact that Derry only managed 4 shots from play in that second half. Yes they were fouled on their way through but even accounting for frees Derry only managed 8 shots in the entire second half. Against 14 men. The average is 14.

Speaking of frees … let me preface the following by stating I am not an advocate of cynical play. I’m not. It is just that I am very sensitive to last minute scores following Kildare’s collapse at home to Tyrone in the ’14 league. If you are going to attempt to stop a winning score in the final minute then Down went about it in a way designed to inflict most damage on themselves.

The first picture below shows the pitch opening up after Bradley shrugged off the trailing Down player. Given that Down were willing to take a black card later in this move anyway then it was most advantageous to take it here – out the pitch where they still have a chance to regroup. That Down player just had to get Bradley to the ground when you see the wide open spaces in front of him.

Derry 1

Derry2

The second picture is taken a split second before the foul that led to the black card and ultimately the winning point. You couldn’t do it at a worse moment. You are beaten – by taking the player down you actually increase the chance of Derry scoring as they have a free that is converted at ~94%. Also, and almost more importantly, you waste a precious minute as the ref issues the black card and the opposition settles over the free. Just let the Derry man shoot – there’s less probability of a score plus you get an extra minute to get the equaliser.

Exhausted players making split second decisions at the death I know but that’s when you have to be at your sharpest mentally.

Shots from deadballs

Player Shots Scores Success % Weighting
M Lynch (Derry) 5 2 40% -1.501
E Bradley (Derry) 4 3 75% -0.015
B Heron (Derry) 1 0 0% -0.400
P Devlin (Down) 8 6 75% 0.069
D O’Hare (Down) 1 1 100% +0.397
team avgs 7.2 4.9 68.7%

Watching the game it felt that every other shot was a free and up until ~53 minute it was. At that stage there had been 19 shots from play and 16 from frees. The volume of shots did not exceed those from play until the 33rd minute.
Still that relative lull in the last 20 minutes only places this game on a par with Cavan – Monaghan this year for the second most shots from frees in a game – the *honour* of that title still lies with Meath – Tyrone in 2013.

As noted above Lynch as excellent from play but his deadball shooting was poor missing one from the middle in two “gettable” shots from the wing in either half.

On paper Devlin had a good day getting 0 – 06 from frees however his weighting shows that given where the attempts originated he was bang on average. His high tally had more to do with volume of shots rather than deadly accuracy on his part.

Kickouts

Derry’s kickouts Won % Turned into an attack % Shot %
Derry 17 74% 14 82% 9 53%
Down 6 26% 3 50% 3 100%
Down’s kickouts Won % Turned into an attack % Shot %
Derry 7 37% 7 100% 4 57%
Down 12 63% 10 83% 7 58%

As with other Ulster games we missed a number of instances where the ball landed so I’m loathe to read too deeply into how teams went about securing possession. I’m sure my need to see the kickout battle is not the producer’s target audience but man I really don’t need to see any more lingering shots of managers prowling the sideline – or the subs bench – when the game is on. Anyway ….

Pretty even all told. Derry won six more possessions but that is because they had four more kickouts. When you look at the percentage of kickouts converted to shots all 4 instances have a return in the mid 50 percentile

Shot Charts

Derry’s shooting
Derry shooting (v Down ) 15

Down’s shooting
Down shooting (V Down) 15

x = missed, disc = score, yellow = deadball, black = 1st half from play, white = 2nd half from play,

Players with >= 3 shots from play

Shots Scores Success % Weighting
M Lynch (Derry) 4 3 75% 0.996
K McKernan (Down) 3 2 67% +0.782

Derry V Donegal 2014 Championship

May 27, 2014

For those new to the blog, or who haven’t been here for a while, please find a refresher on the definitions and how the numbers are compiled here

Overall

Team Possessions Shots Shot Rate Scores Success Rate Weighting
Derry 31 22 71% 11 50% +0.977
Donegal 33 22 67% 12 55% +0.339
Champ avg (’12 & ’13) 35.8 27.6 77.2% 14.1 51.0%

In 2012 when Donegal were at their pomp they averaged a stat line of 34.4 attacking possessions with a shot Rate of 74% and a Success Rate of a truly remarkable 59%. Essentially they squeezed as much as possible out of average attacking possessions. They did much the same in this game – yes their Shot Rate of 67% was poor but a Success Rate of 55% is hugely impressive especially considering the fact that their big three did not fire (see below).

On the flip side in 2012 Donegal allowed 35.3 attacking possessions with a Shot Rate of 72% and a meagre Success Rate of 45%. You had your chances against Donegal but for the most part they dictated, usually successfully, where those chances were allowed to be taken from. Derry too had their chances. Their deadball accuracy was excellent (6 from 6) but their shooting from play was not up to scratch.

Shots from Play

Team Shots Scores Success Rate Weighting
Derry 16 5 31% -1.290
Donegal 18 9 50% +0.598
Champ avg (’12 & ’13) 20.3 9.2 45.4%

Donegal’s returns are a curate’s egg. Their big three up front (McBrearty, Murphy & McFadden) combined for a stat line of two scores from eight shots (25% Success Rate) with a combined weighting of -1.734. Of course the corollary of that is the rest of the team had an excellent shooting game with a combined stat line of seven from ten (70% Success Rate) with a combined weighting of +2.332. Going forward it is hard to believe that their full forward line will continue to perform so poorly – if the rest of the team can maintain anything like those Success Rates they are in business.

Derry’s shooting from play was very poor. In 2012 Donegal “allowed” teams to have shots from outside the defensive shield on the outside of Sectors 4 & 6 and on the edge of the 45 in Sector 5. Derry could be said to have had seven attempts (see shot charts below) from these less pressurised zones converting three – McGoldrick, Holly & Heron. Normally this would be quite a good return however when this constitutes 44% of all your shots from play you need to be more accurate to (a) keep the scoreboard ticking over and (b) entice Donegal out.

Again in the shooting charts below it is quite noticeable how clean the Donegal defenders kept the scoring zone – Johnson’s blocked goal attempt was the only shot from play that could be considered close to goal.

Shots from deadballs

Player Shots Scores Success Rate Weighting
M Murphy (Donegal) 4 3 75% -0.259
M Lynch (Derry) 3 3 100% +1.082
E Bradley (Derry) 2 2 100% +0.685
B Heron (Derry) 1 1 100% +0.500
team avgs (’12 & ’13 Champ) 7.3 4.9 66.7%

Excellent deadball striking with nine from ten attempts converted including a ridiculously sublime sideline ball at the start of the second half in the middle of a 1-05 scoring block for Donegal.

Unfortunately we do not have enough sidelines in the database to give an accurate weighting thus that point was treated as a “normal” free from Sector 4 – harsh on Murphy but just one of those quirks that appear with incomplete data.

The overall volume of deadball attempts is low – 6.4 attempts per attacking possession versus an average of 4.9. This includes a sideline attempt from which a shot would not normally be taken. This low level can be attributed to excellent tackling but also a pre eminence on holding the ball across the 45 as both defensive shields were set.

Kickouts

Derry’s kickouts Won % Turned into a possession % Shot %
Derry 11 61% 11 100% 7 64%
Donegal 7 39% 5 71% 4 57%
Donegal’s kickouts Won % Turned into a possession % Shot %
Derry 7 39% 6 86% 5 71%
Donegal 11 61% 9 82% 6 55%

The most remarkable thing about the kickouts – apart from the symmetry of both teams winning 11 out of their own 18 kickouts – is the sheer volume that were converted into attacking possessions.

No matter who won the kickout 86% (31 out of 36) were converted into an attacking possession. It was not a case of kicking short and walking the ball up to the opposition’s defensive shield either; of the 34 where the cameras picked up where the ball landed only two were kicked short and one of those went directly out over the sideline!

A case of competing for the kickout but if you lose it then retreat and only press the opposition when they meet your defensive line.

Turnovers

Turned Over Shots from Turnovers %
Derry 23 9 39%
Donegal 22 11 50%


Misplaced Pass Tackled Shots not going dead Mishandled possession/Fouled Ball Other
Derry 7 7 4 4 1
Down 6 6 4 5 1

One of the side effects of a slow, probing approach in trying to break down a defensive shield is the relative lack of turnovers. Possession is key – and king. In the two games where we have tracked turnovers the volume has been 58 (Dublin V Derry) and 56 (Tyrone V Down). In this game there was a total of 45 turnovers with 18% (8 total) coming from shots that did not go dead. So in a 70 minute game there was a non-shot turnover only every two minutes.

Perhaps the most remarkable point on the turnovers is that not one of those turnovers happened inside the opposition’s 65m line and the receiving team got the ball inside their own 45 78% of the time(35 in total). No score was easily given away.

Shot Charts

Derry’s shooting
Derry shooting (V Donegal )
Donegal’s shooting
Donegal shooting (V Derry)
x = missed, disc = score, yellow = deadball, black = 1st half from play, white = 2nd half from play

Players with >= 2 shots from play

Shots Scores Success Rate Weighting
P McBrearty (Donegal) 5 1 20% -1.311
C McFaul (Derry) 3 1 33% -0.217
L McLoone (Donegal) 2 2 100% +1.176
E Bradley (Derry) 2 1 50% +0.282
N Holly (Derry) 2 1 50% +0.263
M Lynch (Derry) 2 1 50% +0.142
M Murphy (Donegal) 2 1 50% +0.076
A thompson (Donegal) 2 1 50% -0.068
R Bell (Derry) 2 0 0% -0.719

Dublin V Derry 2014 league final

April 28, 2014

For those new to the blog, or who haven’t been here for a while, please find a refresher on the definitions and how the numbers are compiled here

Overall

Team Possessions Shots Shot Rate Scores Success Rate Weighting
Dublin 57 47 82% 23 49% -0.290
Derry 29 20 69% 11 55% +0.931
Champ avg (’12 & ’13) 35.8 27.6 77.2% 14.1 51.0%

The numbers just prove that Dublin were as dominant as they looked to be in real-time.

For the second game in a row Dublin’s shooting was below average, recording a Success Rate of 49%, but like in the Cork game that doesn’t really matter a damn if you can have 27 more shots than your opponent (it was 17 more shots in the Cork game).

In last year’s Championship the highest number of attacking possessions was 49 for, coincidentally, Dublin against Westmeath. This is now the second game in a row where they have smashed through that with 57 possessions here and 54 against Cork. In both games their Shot Rate was in the low 80 percentile. Dublin’s huge scoring is not down to their shooting prowess but rather the relentless nature of their attacking play. In the last two games they have overcome below average shooting with a phenomenal volume of shots.

Shots from Play

Team Shots Scores Success Rate Weighting
Dublin 42 19 45% -0.301
Derry 16 10 63% +2.366
Champ avg (’12 & ’13) 20.3 9.2 45.4%

Again not much to be said here except to once again underline Dublin’s dominance. B Brogan & E O’Gara had as many shots from play (10 fro Brogan, 6 for O’Gara) as the entire Derry team.

Once again Dublin were goal hungry. The percentages may not be as gaudy as the Tyrone game – where 40% of Dublin’s shots from play were shots at goal – but it did return a healthy 24% this time around. That’s 10 shots at goal in the one game. Converting three is about par for this team.

Derry did have 6 goal attempts themselves getting 1-03 from those 6 shots but it was the 20th minute before they had an attempt for a point from play. Dublin had already taken 15 shots at that stage.

Shots from deadballs

Player Shots Scores Success Rate Weighting
B Brogan (Dublin) 3 3 100% +0.333
S Cluxton (Dublin) 2 1 50% -0.322
M Lynch (Derry) 2 0 0% -1.119
E Bradley (Derry) 1 1 100% +0.232
B Heron (Derry) 1 0 0% -0.547
team avgs (’12 & ’13 Champ) 7.3 4.9 66.7%

The intensity was long gone from the game and this can be viewed by the fact that not one shot in the second half was from a dead ball.

One of the weaknesses of the weighting is exposed here as although Lynch’s two attempts were from scorable sectors, (Sectors 4 & 6 respectively), both frees were more or less on the touchline.

Not that it mattered but I thought it a strange decision from McIver to take off Heron just as they had received a free, in Sector 4, favouring his left foot. Take him off after the free? Or let Bradley, who took a subsequent free from the same side, take it? Yes it would have been Bradley’s first touch but would that have been any worse than asking Lynch to convert from the right sideline with his right foot? As I said not a decision of any great consequence but I just thought it odd.

Kickouts

Dublin’s kickouts Won % Turned into a possession % Shot %
Dublin 14 100% 12 86% 7 50%
Derry 0 0% 0 0
Derry’s kickouts Won % Turned into a possession % Shot %
Dublin 14 37% 13 93% 11 79%
Derry 24 63% 15 63% 11 46%

Dublin’s dominance was all encompassing. They had 14 kickouts and won all 14; we didn’t see where two landed (but given the flow of the game, and the time from the kickout, it was obvious that Dublin had garnered possession) and seven of the remaining twelve went short, so Dublin would be expected to win the majority but still; to gather all 14 is some accomplishment.

For all the problems that they had Derry did ok on their own kickouts. In total they had 38 but won possession on 63% of those (24 to Dublin’s 14). It was what happened next that hampered them – from the 24 that they won they only managed 11 shots from that possession; Dublin also managed 11 shots but from the relatively meagre 14 Derry kickouts that they won.

Of the 24 kickouts that Derry won only 6 were kicked short. Whereas Dublin kicked 7 short and managed to convert 6 into attacking possessions and three into shots Derry didn’t get one shot from their 6 short kickouts and only managed one attacking possession. Winning primary ball from their own kickouts was not the issue – it was the second phase and moving it through to Dublin’s 45 that stopped them in their tracks.

Turnovers

Turned Over Shots from Turnovers %
Dublin 33 24 73%
Derry 25 9 36%


Misplaced Pass Tackled Shots not going dead Mishandled possession Fouled ball
Dublin 18 4 6 4 1
Derry 13 3 6 2 1

After adding kickouts to the data last year the plan is to record turnovers this year. At a high level shots that go dead, either through going wide or being a score, will not be covered here as they are either covered in the shooting stats or the kickout stats (or both).

Dublin had 32% more turnovers than Derry (33 to Derry’s 25) however it is what Dublin did with that turnover ball that is so striking. They managed to get a shot from 73% of those turnovers compared to just 36% from Derry. We have no reference points for either of these two numbers but the gap in returns would appear huge!

Dublin managed to score 1-09 from their 33 turnovers (30% conversion rate) whilst Derry scored 0-05 from their 25 (20% conversion rate).

The spread of turnover types are very similar though Derry did misplace 5 more passes whilst also mishandling twice as many balls as Dublin (granted at very small volumes).

Shot Charts

Dublin’s shooting
Dublin (v Derry) shooting
Derry’s shooting
Derry shooting
x = missed, disc = score, yellow = deadball, white = play

Players with >= 2 shots from play

B Brogan scored 1-06, which is an excellent return, but he took 13 shots to achieve it. His combined weighting for those 13 shots was -0.007 i.e. for the type of shots he undertook his returns were bang on average.

Flynn & Connolly had very good games with a combined 1-05 from 10 shots (60% Success Rate & a weighting of 1.592) whilst after a poor shooting performance against Cork ( 1 from 6) A Brogan pulled the horns in and chipped in with two points from two shots.

A quick note for O’Kane who tried valiantly to raise the team from centre half back. He managed three shots with his only “miss” being a quick spectacular volley that ricocheted off a Dublin player standing on the line.

Shots Scores Success Rate Weighting
B Brogan (Dublin) 10 4 40% -0.34
E O’Gara (Dublin) 6 3 50% -0.041
D Connolly (Dublin) 5 3 60% +0.877
P Flynn (Dublin) 5 3 60% +0.715
K McManamon (Dublin) 4 1 25% -0.930
M Lynch (Derry) 3 2 67% +0.778
G O’Kane (Derry) 3 2 67% +0.525
E McGuckin (Derry) 3 2 67% +0.459
A Brogan (Dublin) 2 2 100% +1.281
C O’Boyle (Derry) 2 2 100% +1.094
C Reddin (Dublin) 2 1 50% +0.142
D Byrne (Dublin) 2 0 0% -1.207
E Lynn (Derry) 2 0 0% -1.207

Derry V Mayo 2014 League

April 15, 2014

For those new to the blog, or who haven’t been here for a while, please find a refresher on the definitions and how the numbers are compiled here

Overall

Team Possessions Shots Shot Rate Scores Success Rate Weighting
Derry 40 33 83% 17 52% +0.467
Mayo 41 29 71% 17 59% +1.107
Champ (’12 & ’13 avg) 35.8 27.6 77.2% 14.1 51.0%

That old chestnut – goals win games. The outputs are pretty evenly matched. There was only one possession in the difference with Derry being more efficient with their Shot Rate whilst Mayo were more accurate with their shots.

Shots from Play

Team Shots Scores Success Rate Weighting
Derry 24 12 50% +1.683
Mayo 21 10 48% +0.538
Champ avgs (’12 & ’13) 20.3 9.2 45.4%

Considering they were down to 14 men for the majority of the game that is an excellent effort from Derry to outperform Mayo. The main protagonist for Derry was Mark Lynch who hit an excellent 4 scores from 6 shots with a weighting of +1.495.

Of course the corollary of this is that against 14 men Mayo will be disappointed to only produce an average number of shots from play. Doherty stepped up to the mark for them, taking 5 shots, but he only connected with 2 of them; no one was able to replicate Lynch’s performance for Mayo.

Shots from deadballs

Player Shots Scores Success Rate Weighting
M Lynch (Derry) 8 5 63% -0.670
B Heron (Derry) 1 0 0% -0.547
A Freeman (Mayo) 8 6 75% +0.482
A Moran (Mayo) 1 1 100% +0.087
team avgs (’12 & ’13 Champ) 7.3 4.9 66.7%

Much of the post match discussion was around the volume and type of frees. Both teams had 9 shots at goal from deadballs; all Derry’s attempts were from frees whilst Mayo had seven frees and two 45s.

Over the two semi finals Mayo gave away a shot from a free on every 4.44 of the opposition’s possessions; for the same metric Derry gave away 5.85 frees per opposition possession, Cork 7.71 and Dublin 17.5

Lynch had a wonderful game but his place kicking was below average. Now those returns might be on the harsh side as two of his misses were from outside the 45. The volume of frees from outside the 45 is low, so the averages from these sectors may be weaker than the other sectors but the evidence we have to date suggests that he should have done better (or not taken the shot on at all from that far out).

A quick note for Lynn who won four of Derry’s shots from frees; it is a small statistic that will not show up anywhere but vitally important to any team.

Kickouts
Mayo won 60% of all kickouts (29 versus 19) and managed 5 more shots from those wins (19 shots to Derry’s 14). As ever those bare numbers don’t tell the whole story.

Mayo won a disproportionate 79% of their own kickouts (19 to Derry’s 5) however this is padded by the volume of short kickouts that Mayo employed. All bar one of those short kickouts occurred post the Fergal Doherty red card as Derry funneled back trying to set up with 14 men.

Rob Hennelly was too quick for TG4’s cameras on three occasions so of the 21 kickouts that we could fully chart 9 were taken short. Mayo won all 9 attempting 5 shots. Of the remaining 12 Mayo won 7 getting 5 shots whilst Derry won 5 getting 3 shots. So that is a shot differential of +7 for Mayo on their own kickouts.

Derry won possession on 58% of their own kickouts (14 to Mayo’s 10). Unlike Mayo Derry only went short once. Of the remaining 23 kickouts Derry won 13 getting 10 shots whilst Mayo won 10 getting 8 shots. A shot differential of +2.

A case of Mayo winning the kickout battle but Derry ultimately winning the war.

Players with >= 2 shots

Shots Scores Success Rate Weighting
M Lynch (Derry) 6 4 67% +1.459
J Doherty (Mayo) 5 2 40% +0.156
C O’Boyle (Derry) 4 2 50% +0.515
L Keegan (Mayo) 4 1 25% -0.485
M Sweeney (Mayo) 3 2 67% +0.224
A Moran (Mayo) 3 1 33% -0.192
E Varley (Mayo) 2 1 50% +0.215
S McGoldrick (Derry) 2 1 50% +0.003
C McFaul (Derry) 2 1 50% -0.417

Derry V Down 2013

June 6, 2013

For those new to the blog, or who haven’t been here for a while, please find a refresher on the definitions and how the numbers are compiled here

Overall

Team Possessions Shots Shot Rate Scores Success Rate Weighting
Derry 42 32 76% 17 53% +2.3639
Down 46 33 72% 19 58% +3.7934
2012 avg 35.28 27.02 76.6% 13.96 51.67%

A very open game with high volume returns for the main attacking metrics. Derry’s Shot & Success Rates were in line with the average; to return as high a weighting as they did shows that the shots they took were more difficult than would normally be expected.

Down’s shooting overall was excellent with a high Success Rate and a high weighting. If they were going to be harsh in their analysis, after an excellent victory, then they may be concerned with their Shot Rate, especially with Donegal on the horizon. For all the possession they had they really should have managed to get another 2 or 3 shots off.

Down will not have as much possession the next day and a similar low Shot Rate will inevitably feed into a low score.

Shots from play

Team Shots Scores Success Rate Weighting
Derry 24 15 63% +5.142
Down 31 17 55% +2.899
2012 avg 20.14 9.36 46.47%

Derry’s shooting from play was scintillating. That performance is as good as we are likely to see in the Championship. Between them Eoin Bradley & James Kielt scored 0-08 from 11 shots (73% return with a combined weighting of +3.418) however Bradley’s hidden value was immense. He was involved in all 3 of Derry’s shots for goal; taking one and setting up the other two – including Lynch’s goal; he was fouled for two of the four frees Derry took a shot from and also “won” two of Derry’s three 45s. He was immense.

The issue with Derry however was the Jeckyll & Hyde nature of their shooting strategy (see shot chart below). In the first half they took 14 shots from play with 9 (64%) coming from Sectors 5 & 8, the two most productive sectors. In the second half only one of their 10 shots from play came from these sectors. Their second half returns were still about above but they moved away (or were moved depending on your viewpoint) from what got them the lead at half time.

Team Half Shots Scores Weighting
Derry 1st 14 10 +3.764
2nd 10 5 +1.378
Down 1st 15 8 +1.448
2nd 16 9 +1.452

Although overshadowed by Derry’s returns Down’s shooting was also very good. On top of being more consistent, with both halves being quite similar, they were also a lot more clinical. Down had 3 shots at goal and only the base of the post stopped them converting all 3.

Shots from deadballs

Player Shots Scores Success Rate Weighting
O’Hare (Down) 2 2 100% +0.894
Heron (Derry) 3 1 33% -0.28
Bell (Derry) 2 0 0% -1.667
J Kielt (Derry) 1 1 100% +0.452
Lynch (Derry) 1 0 0% -0.558
E Bradley (Derry) 1 0 0% -0.726
2012 team avgs 6.88 4.6 66.9%

Both teams did very well to only concede five frees between them within scoreable range.

Derry, and Bell in particular, are slightly hard done by here. Due to the fact that the volumes of shots from sidelines is so low we cannot give them an accurate weighting (yet!). As such they are considered free kicks – and Bell gets crucified for missing two free kicks in Sector 9 rather than one of them being a sideline.

Shot Charts
You can see how Derry’s shooting changed after half time. Their first half shots from play are in white whilst the second half are in black. They obviously have great strikers of the ball, as shown by their returns in this game, but too many times it was the wrong player (P Bradley, Quinn, O’kane) taking the shots from the wrong sections.

Derry’s shooting

Derry shooting

Down’s shooting

Down shooting

x = missed, disc = score, yellow = deadball, white = play
Kickouts
Kickout

The normal kickout data is included above but perhaps of more interest was what was happening on Down’s kickouts. Derry ‘let’ Down have the short kickout which, as discussed in the Dublin-Westmeath game, is a strategy that has merit. However on the first 7 kickouts that Down took (all short) they managed to get a shot from each and bagged 0-04 points.

Down Won Shots Scores
First 7 short 7/7 7 4
Remainder short 6/7 4 3
Mid/Long 7/9 2 1

The strategy itself is fine but what were Derry doing? If they were dropping back from Down’s kickouts where was the pressure when Down crossed the half way line. To implement this strategy is fine but you must follow up by blocking the route to shooting in your 45.

When Down did go long Derry were much more effective at stopping the shot coming. After witnessing the outcome of those first 7 short kickouts the Derry management really should have sold out and stopped anymore short kickouts.

Players with >= 2 shots from play

Shots Scores Success Rate Weighting
McKernan (Down) 7 4 57% +0.823
E Bradley (Derry) 6 4 67% +1.294
J Kielt (Derry) 5 4 80% +2.124
Poland (Down) 5 3 60% +0.837
Madine (Down) 5 3 60% +0.616
O’Hare (Down) 4 3 75% +1.038
Lynch (Derry) 2 2 100% +1.286
Lynn (Derry) 2 2 100% +1.168
McCallion (Derry) 2 0 0% -0.645
Heron (Derry) 2 1 50% +0.239
O’Kane (Derry) 2 0 0% -0.842
Quinn (Down) 2 0 0% -0.842
Laverty (Down) 2 0 0% -0.866