Posts Tagged ‘Tipperary’

Mayo v Tipperary 2016 AI Semi Final

August 23, 2016

For those new to the blog, or who haven’t been here for a while, please find a refresher on the definitions and how the numbers are compiled here

Team Possessions Attacks Shots Scores Exp Pts
Mayo 57 41 33 2 – 13 21.34
Tipperary 52 39 29 0 – 14 16.36

Goals. They win games and set the tone for how a game unfolds. Mayo had three attempts scoring 2-00 whilst Tipperary, chasing the game for much of the afternoon and after carving out 13 goal chances combined (scoring 4-02) against Derry & Galway, didn’t have one attempt.
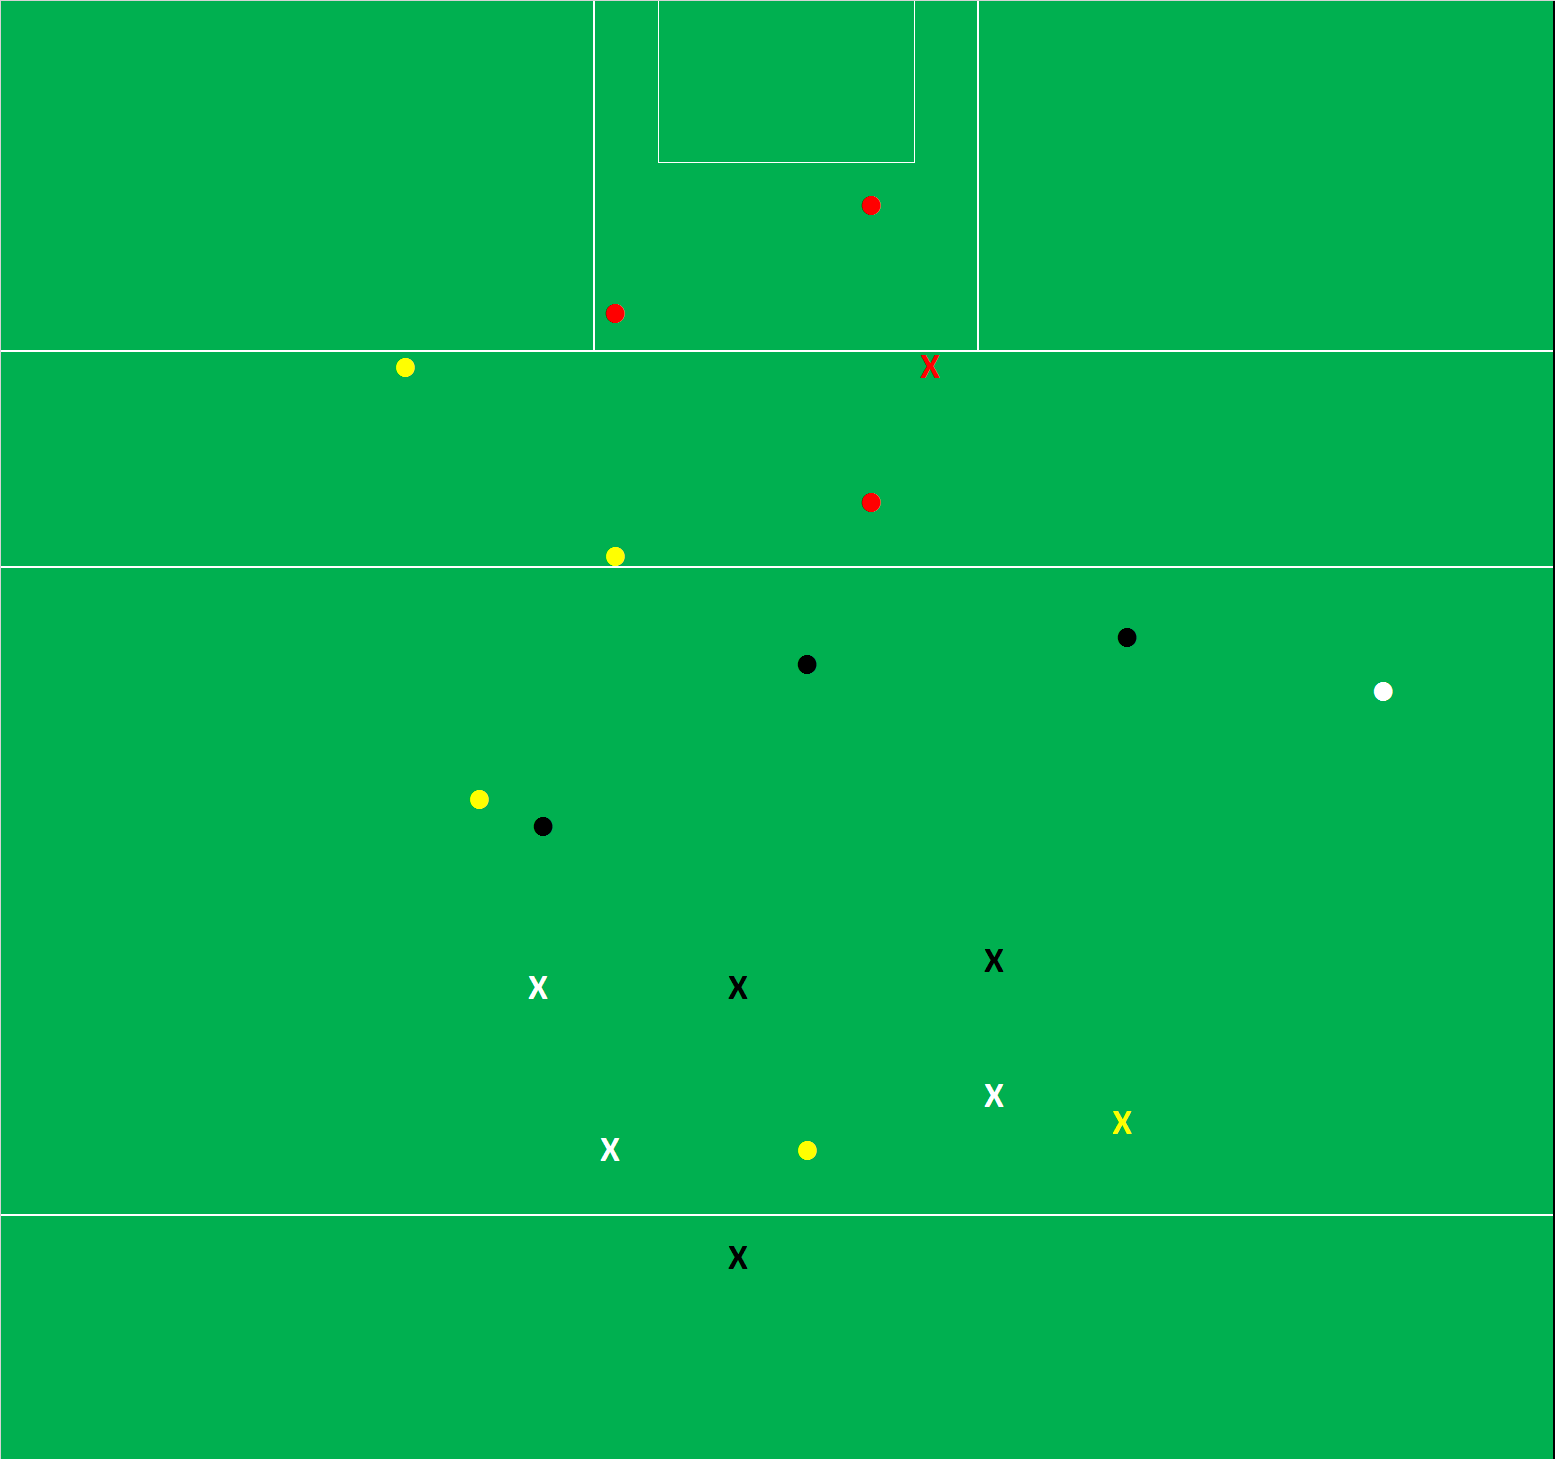
Tipperary shooting

First up the positive. Tipperary’s deadball accuracy was excellent hitting 0 – 09 from ten attempts and nine on the trot – especially when they needed them – after O’Halloran missed their first one from outside the 45. The Expt Pts for these ten attempts was 8.25 giving a return of +0.75. With a conversion rate of 90% an Expt Pts of +0.75 does not appear overly generous however this, as the chart below shows, is an indicator that the frees were of the easier variety and also ties in to the fact that they didn’t have any goal attempts.

Mayo were on notice and were not going to let them through.

Tipp deadballs

An overall Expt pts of -2.36 incorporating no goal shots and good accuracy on frees leads to some very poor shooting from play. Tipperary were just 26% (5 from 19) on point attempts from play with an Expt Pts tally of -3.11. These weren’t some collection of long range “shoot and hope” efforts either as only two came from outside the 45.

Tipp from play

As the chart above shows there were some very poor efforts contributing to that 26%. Tipperary had nine efforts from the most central zones but only scored 0 – 03 (Expt Pts -1.73). From wider angles they were 0 – 02 from eight (Expt Pts -0.62)

This is the second consecutive game whereby a team has underperformed when shooting from play against Mayo (Tyrone were 27% on 22 shots with an Expt Pts of -3.36). At some stage we are going to have to give the Mayo defence some credit for these poor returns!

Looking at Tyrone & Tipperary’s 41 shots from play Mayo applied pressure to 66% of them. We don’t use pressure in the numbers but for the last four years 51% of all shots tracked were recorded as being taken under pressure. Accepting that everyone’s definition of pressure will be different we can say that Mayo’s defence has applied pressure at a greater level than is the norm – and their opponents shooting has suffered, at least in part, as a consequence.
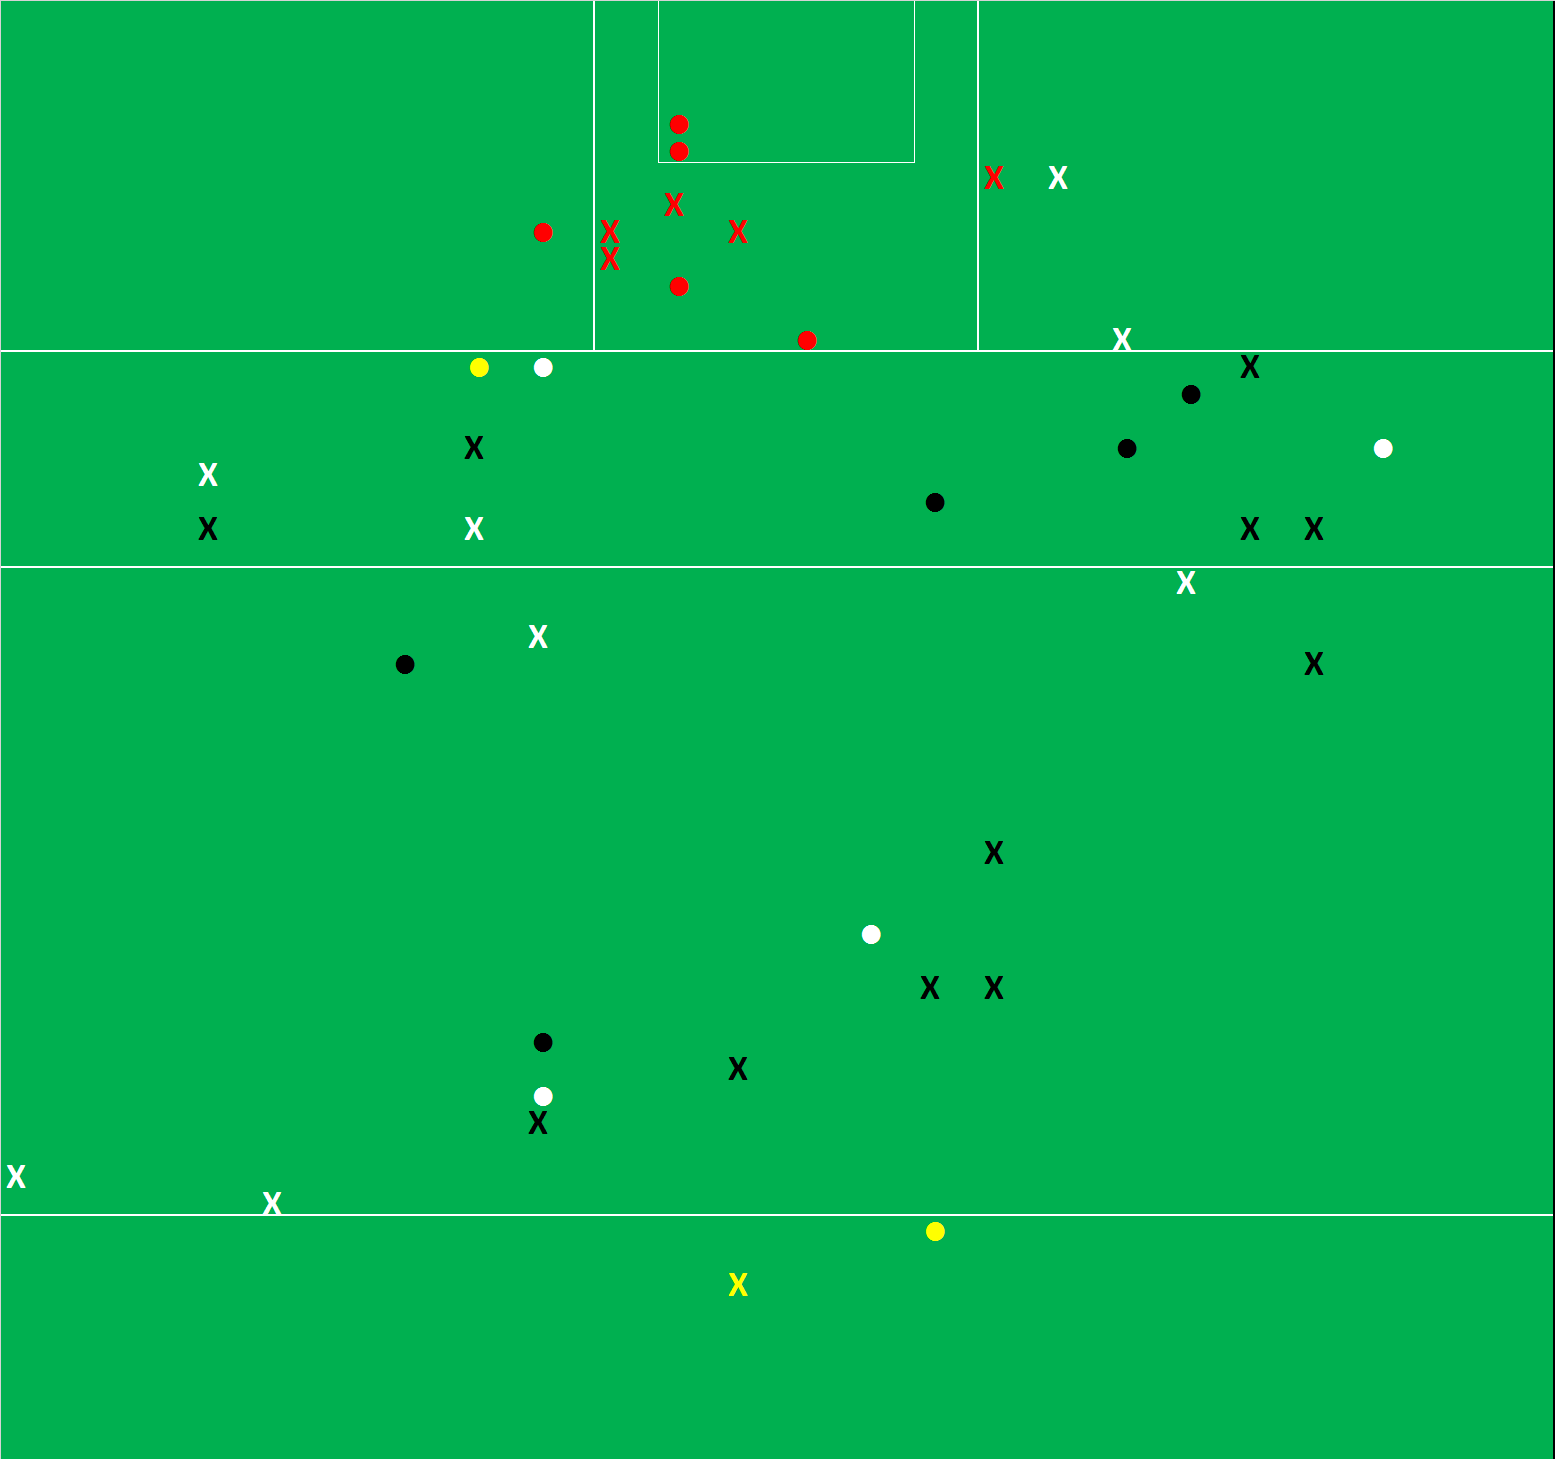
Mayo shooting

Mayo’s overall shooting was as poor as Tipperary’s with a total Ext Pts of -2.34. But whereas Tipperary were consistent in their issues throughout the game Mayo were gloriously inconsistent.

Expt Pts

Up until the goal in the 25th minute Mayo were a very poor 25% (3 from 12) with an Expt Pts of -3.84. From play it reads even worse with a paltry 0-01 registered from 8 attempts (13%) including a glorious missed fisted point attempt from the 20m line. And then the goal happened.

From the 25th minute until the end of the first half Mayo were a mirror image scoring 1-07 from just eight shots (Expt Pt of +4.70). Within that span they only had one possession that did not end in a score. A point per possession return of 0.40 is generally very good; Mayo returned a barely believable 1.11 points for those nine possessions. It was a stunning “power play”

And then half time happened. D O’Connor responded to Quinlivan’s free early with a trademark strike from the right in the 37th minute and then …. nothing. Radio silence. Mayo managed just two shots – let alone garner any scores – in the next 17 minutes. As brilliant as they had been prior to half time they were inept here. From their 1.11 points per possession – on 9 possessions – prior to half time they now went 11 possessions without scoring. Not only that they managed just five attacks and two shots in that period.

Mayo completely ceded the game to Tipperary who, in that same time period, garnered 17 possessions scoring 0 – 04 from 10 shots. If Mayo allow such a fallow spot in the final you have to imagine that either Dublin or Kerry would punish them at a higher rate than Tipperary did (0.24 pts per possession on those 17 possessions).

The goal

The build up to the second goal was very fortuitous but there was nothing lucky about the first.

Mayo goal v Tipp

Although the move for the goal emanated from a misplaced hand pass involving one of the Tipperary defenders bringing the ball out they were still well set when Higgins approached the 45. They were manned up 4 on 4 (Campbell (3) has McLoughlin (10) on his shoulder just out of picture) with an extra trailing defender (18). It is a testament to Higgins’ speed and close ball control that he was not just able to round Fox (12) but also that the covering defence couldn’t get across to him. By bursting through the defence at speed either Campbell (3) or Feehan (7) had to leave their man and stop the shot.

Appendix

Mayo’s shooting
Mayo shooting (V Tipperary 16)
x = missed, disc = score, yellow = deadball, black = 1st half from play, white = 2nd half, red = goal attempt


Players with >= 4 shots from play

Shots Scores Success Rate Exp Pts
M Quinlivan (Tipperary) 8 0 – 07 88% 6.23
C O’Connor (Mayo) 7 0 – 03 57% 4.66
D O’Connor (Mayo) 6 0 – 02 33% 2.97
A Moran (Mayo) 5 0 – 04 80% 3.50
P Austin (Tipperary) 5 0 – 01 20% 2.33
C Sweeney (Tipperary) 4 0 – 03 75% 2.15
K O’Halloran (Tipperary) 4 0 – 02 50% 2.07

Galway v Tipperary 2016 AI Quarter Final

August 3, 2016

For those new to the blog, or who haven’t been here for a while, please find a refresher on the definitions and how the numbers are compiled here

Team Possessions Attacks Shots Scores Exp Pts
Galway 45 32 19 1 – 10 13.53
Tipperary 60 50 42 3 – 13 27.13

Possessions, Attack Rate, Shot Rate, Expt Pts …. Tipperary blew Galway out of the water. They were so comfortable that their shooting was able to be well below par yet they could win by 10 points in a hack canter.

Generally speaking teams score at the rate of 0.3 points per possession. Having 15 more possessions in a game, which is the biggest gap this year – Monaghan had a surplus of 13 in their one sided procession against Down, gave Tipperary a ~5 point leg up.

Origination Galway Tipperary
Own kickout 16 15
Opp kickout 5 11
Turnover own 3rd 19 22
Turnover mid 3rd 4 3
Turnover opp 3rd 0 1
Other 1 8

The origination of the possessions are laid out above. We can see that the majority of Tipperary’s surplus came from the opposition’s kickout (where Tipperary won 11 to Galway’s 5) and “other”. The kickouts we’ll touch on later but “other” consists of throw-ins and possession re-gathered (not sure if that’s a word!) by a team after their own shot. Both teams split the opening throw-ins leaving Tipperary gathering seven of their own shots. Not only are they extra possessions but they are possessions gained inside the opponent’s 45. Tipperary managed a further seven shots off these possession re-gains scoring 1- 02. Now from a shooting perspective that’s not great as it is 1-02 off 14 shots however it does lead to a sense of overwhelming superiority as shots appear to land in waves constantly cranking up the pressure on the opposition

Those shot gains came in a variety of ways – balls back off the post, being first to goalkeeper parries or picking up balls further out the field after shots were blocked – and indicate perhaps just how much more alert, and on their toes, Tipperary were compared to Galway.

Galway

On much lower possession volumes Galway had to mind what ball they did have but unfortunately for them it just didn’t stick. A 71% Attack Rate (getting the ball into Tipperary’s 45) is below average whilst a shot Rate of 59% is very low. Both numbers are very far below what was required when you consider the edge Tipperary had in possessions and shots (notwithstanding the poor execution mentioned above)

Galway didn’t engage Tipperary high up the pitch so only nine of their possessions occurred outside their own kickout or their own 65m line. They had to work hard to get the ball up to the forwards and when they did they just didn’t pull the trigger. It is somewhat understandable in the second half, when the game was gone with 20 minutes to go, that they were shot shy in an attempt to get goals but in the first half, when it was there to be won, they only had 10 shots compared to Tipperary’s 24. Indeed after Danny Cummins’ point in the 14th minute which put them 0 – 04 t0 0 – 01 ahead they did not have another shot from play until Paul Conroy’s effort in the 32nd minute. In that intervening 18 minutes they had seven possessions and four attacks with just a Gary Sice missed free to show for their efforts.

Tipperary in that same period had 15 possessions, 14 attacks and 12 shots (including four on goal) scoring 1 – 06.

Galway were absolutely blitzed and the 1-01 they scored at the end of the half enabled the HT scoreboard to gloss over just how comprehensively outplayed they were in the first half.

Tipperary Shooting

That being said the Tipperary performance was not without its issues. Yes they racked up a large possession volume and their approach play was such to produce high attack & shot rates. But their shooting itself was poor.

In the previous round against Derry it was noted that whilst they had run up another big score (an impressive 1 – 21) this was achieved through volume rather than overt accuracy. Their Expt Pts total that day was +0.14 off of 37 shots. Again the 37 was high but their overall accuracy was bang on average.

Against Galway they had an even more impressive 42 shots but “only” scored 3 – 13 gaving an overall conversion rate of 38% and an Expt Pts tally of -5.13. That’s the problem with racking a possession volume through the “other” origination outlined above – you have to miss your original shot to regain the possession! We won’t see many games where you have a conversion rate less than 40% (only other winner this year was Tyrone against Donegal), such a negative Expt Pts and yet still romp to a 10 point win! So how was such a negative waiting obtained?

Goal attempts
Tipperary had a quite remarkable ten attempts at goal scoring 3 – 02. That looks like a healthy 1.10 points per attempt however the average is actually 1.19 so although the Conversion Rate here is high at 50% the goal conversion rate of 30% is below average and leads to an Expt Pts of -0.90 on goal attempts

Deadballs
Tipperary converted three of their five deadballs (again the average is ~67%) returning an Expt Pts of -0.21. Against Derry they went 9 from 13 (69% Conversion Rate; Expt Pts of -0.29) so between then O’Halloran & Quinlivan are about average; Conversion Rate of 67% & a combined Expt Pts of -0.50

Point attempts
So stripping out goal attempts and deadballs that leaves some very poor point taking. Tipperary had 27 point attempts but only scored 0 – 08; a 30% Conversion Rate with an Expt Pts return of -4.02. There is no hiding just how poor that is. The question then becomes will it be repeated?

One element of the performance that will give Tipperary solace is that they came out cold. We must remember that this was the first big Championship match in Croke Park for a lot of these players and it showed early on. Until the Quinlivan goal in the 16th minute Tipperary’s shooting from play read as 0 – 01 from 10 attempts (10% Conversion Rate) with an Expt Pts of -3.37. Whether it was the occasion or the very new test of shooting in to an empty Hill in a quarter final they were very, very poor early on. Thereafter they were much better returning 0 – 07 from 17; a low enough Conversion Rate of 41% but the Expt Pts of -0.45 shows it was only a touch below expected.

Against Derry they were 12 from 21 (57%, Expt Pts of +1.00) when attempting a point. That’s not a huge amount to go on but we can say that over the two games, apart from a 16 minute spell at the start of the Galway game which does have mitigating factors, they were about average. If they continue to produce the same volume of shots against Mayo or Tyrone as they did against Derry & Galway then they will take average shooting.

Kickouts
As noted above Tipperary were on top when it came to getting their hands on the opposition’s kickouts. Galway had 27 kickouts in total winning 16 with Tipperary claiming the other 11. That however is somewhat misleading as seven of Galway’s kickouts went short. So when Galway went past the 45 Tipperary came out on top 11 – 9.

Overall the net scoring on Galway’s kickouts was a washout (Galway scored 1- 05 from the possessions they won and let in 1-04 from the kickouts Tipperary claimed) however this may be an area of concern. Firstly Galway only scored 1-10 so to let 1-05 in from a set piece is somewhat disconcerting. Plus the goal came from a long kickout which carved open the defence once it bypassed midfield. Also will they have as much possession from either Tyrone or Mayo’s kickouts? And if not can they replace the 1-04?

Tipperary’s kickouts? Comerford has been rightly applauded for some of the pinpoint deliveries he had – especially out on the right touchline. Here again however the bare numbers can be deceiving. Tipperary gained possession 75% of the time (15 – 5) from their own kickouts 75% of the time. This however includes ten short kickouts so when the ball was contestable – landing beyond the 45 – honours were even at five apiece. Tipperary dodged a bullet here as Galway couldn’t do anything with these prime possessions, failing to register a point, but it’s hard to imagine Tyrone or Mayo remaining scoreless after winning Tipperary’s kickout(s).

Appendix

Shot Charts

Galway’s shooting

Galway shooting (V Tipperary16)

Tipperary’s shooting
Tipperary shooting (V Donegal 16)
x = missed, disc = score, yellow = deadball, black = 1st half from play, white = 2nd half, red = goal attempt


Players with >= 4 shots from play

Shots Scores Success Rate Exp Pts
M Quinlivan (Tipperary) 14 1 – 04 36% 8.59
S Walsh (Galway) 7 0 – 04 57% 4.97
K O’Halloran (Tipperary) 7 2 – 02 57% 4.55
C Sweeney (Tipperary) 6 0 – 04 67% 4.43

Derry v Tipperary 2016 AI Qualifiers

July 28, 2016

For those new to the blog, or who haven’t been here for a while, please find a refresher on the definitions and how the numbers are compiled here

Team Possessions Attacks Shots Scores Exp Pts
Derry 45 34 30 2 – 17 19.91
Tipperary 52 47 37 1 – 21 23.86

Tipperary controlled this game in many respects recording seven more possessions and 13 more attacks which culminated in seven extra shots. The drop from 13 additional attacks to just the seven extra shots can be attributed to Derry being more proficient at getting their shots off once inside the 45. The main reason Tipperary were within a whisker of going out of the Championship was Derry’s shooting.

Derry produced an Expt Pts tally of +6.09 which was bettered only by Tyrone’s +10.17 in the drawn game against Cavan when they smashed in 5-18 (as an aside the best Expt Pts games will always be those with a high volume of goals as you’re getting ~+1.8 Expt Pts for any that you convert).

Derry were aided by scoring 2-01 from their three goal chances (Expt Pts of +3.43) as well as converting all four frees (Expt Pts of +0.97) but their point taking really stood up converting 52% with an Expt Pts of +1.69.

It is hard to be critical given their overall returns but if you were to pick anything to review from their shooting display it would be the shot selection in the first half when playing in to the wind. Then they were 45% (0 – 05 from 11) with an Expt Pts return of -0.29. This is particularly harsh as it is viewed against the prism of their second half display (58%; 0 – 07 from 12 and +1.98) but in a one point game it is the small things that can be the making or breaking of a day.

Tipperary’s high score was not the product of excellent shooting but that of volume. 37 shots is an excellent return and ranks up there with the highest this year (Monaghan had 39 in their drubbing of Down). Their shooting was bang on average with a total Expt Pts of +0.14 recording Expt Pts tallies of -0.57 on goal attempts (1 – 00 from 3), -0.29 on deadballs (0 – 09 from 13) and +1.00 (0 – 12 from 21) on point attempts.

Sweeney & Quinlivan, working as an inside tandem, were extremely effective when shooting for points scoring a combined 0 – 07 from just eight shots (Expt Pts +2.53)

Derry’s defending late on

For all the excellent shooting above what stood out most was Derry’s defensive frailties in injury time. Below is a sequence of images from the 71st minute which shows any amount of space for the Tipperary forwards to roam into in the period

Equalising point

Derry Pic1 v Tipp

Tipperary attacked down the left but got stopped. Derry’s whole defence got sucked towards the ball however which meant that two quick passes to the right bye passed six Derry defenders and left an ocean of space for Sweeney to run in to for the equalising point. There is no Derry defender down the right or even covering in front

Leahy shot

Derry pic2 v Tipp

Tipperary won the subsequent kickout and attacked down the right which culminated in a blocked Leahy shot. Just before Leahy pulled the trigger however there was a moment when a simple popped hand pass (which came but was just out of reach of Leahy forcing him towards the by-line) would have created a three on one down Derry’s right.

Winning point

Derry pic3 v Tipp

Keane won a free after tackling Derry high up the pitch (as Derry were trying to exit following the Leahy blocked shot) and had a choice of players to choose from all of whom were in prime attacking position. He chose the right option in Sweeney but really could have given the ball to three players. In this instance Derry were trying to break with the ball, and win the game themselves, after winning a free to stop Tipperary but in doing so left their defence completely exposed.

And yet despite all this Derry still had a chance to draw level with the last shot of the game. In many ways it was a shame that the shot fell to Rogers as although he has the skill to convert that shot, and given his positioning he had to take the shot on, it was he that burst out of defence to create the chance. This after 75 minutes when there were players wilting all around and this was his first shot of the game. As mentioned he had to take it but I’ve no doubt the Derry sideline would have wished for someone else to be on the ball given the circumstances.

Kickouts

2 – 22 of the 3 – 38 scored on the day emanated from kickouts. With their quarter final against Galway on the horizon Tipperary will want to tighten up in this aspect. They lost 9 of their 22 kickouts but that total includes eight that went short. So of those that passed the 45m line they lost 64% (9 of 14) and managed to concede 2 – 04 from those nine losses. It is a rare day that your kickouts can be such a millstone and yet you come out the right side.

Galway v Tipperary 2014 Championship

July 30, 2014

For those new to the blog, or who haven’t been here for a while, please find a refresher on the definitions and how the numbers are compiled here

Overall

Team Possessions Shots Shot Rate Scores Success Rate Weighting
Galway 44 38 86% 21 55% +2.672
Tipperary 39 28 72% 16 57% +2.233
Champ (’12 & ’13 avg) 35.8 27.6 77.2% 14.1 51.0%

Excellent shooting from both teams however the overall numbers are tempered by (a) the volume of goal shots converted and (b) the volume of shots taken under pressure.

There were 12 goal shots in the game (7 for Galway, 5 for Tipperary including the penalty) with 9 resulting in a score. Goal shots generally end in a score c40% of the time. Converting a goal shot is therefore quite a low percentage shot (versus going for a point in the same position) so the weighting is quite high when they are converted. Converting 9 obviously has a huge effect.

Of the 52 shots from play I charted only 35% (18 from 52) being taken under pressure – take out the goal shots and that drops to a paltry 27% (11 out of 41). The lack of pressure is not the sole reason for the excellent returns but it surely helps!

Where attacks originated

Opposition k/out Own k/out Ball received in Own 3rd Ball received in Mid 3rd Ball received in Opposition 3rd Other (throw-in, rebound etc.)
Galway 9 12 15 2 1 5
Tipperary 7 14 10 4 2 2

Very similar returns for both teams. Both teams managed 21 attacking possessions from kickouts whilst Galway edged two more possessions from turnovers (18 to 16).

The difference in shots came mainly, as we will see below, from turnovers. Galway had 2 extra attacking possessions from turnovers but managed 8 extra shots from the turnovers gained.

Shots from Play

Team Shots Scores Success Rate Weighting
Galway 30 18 60% +4.944
Tipperary 22 11 50% +1.401
Champ avgs (’12 & ’13) 20.3 9.2 45.4%

The Galway returns are excellent. They managed 7 shots at goal scoring 4-01 and converted 57% (13 from 23) of their point attempts. As noted earlier the concern going forward is can they replicate this? Only four of those 23 point shots were taken under pressure

Shots from deadballs

Player Shots Scores Success Rate Weighting
S Walsh (Galway) 5 3 60% -0.574
P Conroy (Galway) 2 0 0% -0.857
M Martin (Galway) 1 0 0% -0.840
C Sweeney (Tipperary) 5 5 100% +1.672
B Grogan (Tipperary) 1 0 0% -0.840
team avgs (’12 & ’13 Champ) 7.3 4.9 66.7%

Very good from Sweeney – not much more could have been asked.

The first shot in the game Martin skewered a simple free from in front of goal and that seemed to set the tone for Galway’s performance. Combined they were 38% (3 from 8) with a weighting of -2.271. Shane Walsh’s sublime piece of skill to kill Conroy’s 45 with his instep hid the fact that the 45 itself was atrocious – dropping short and wide at the corner of the small square.

Turnovers

Team “coughing up” possession Shots from Turnovers %
Galway 22 11 50%
Tipperary 22 19 86%


Misplaced Pass Tackled Shots not going dead Other
Galway 11 6 4 1
Tipperary 12 5 0 5

The turnover numbers are quite low – 44 in this game versus 58 in the Cork-Sligo game – however the striking number is that 86% from Galway. Of the 22 turnovers they created/received they managed to convert 19 to shots. Thier foot passing into the space for the forwards to latch on to was excellent.

All four of their goals came from Tipperary turnovers

Kickouts

Galway’s kickouts Won % Turned into a possession % Shot %
Galway 20 74% 12 60% 8 40%
Tipperary 7 26% 7 100% 6 86%
Tipperary’s kickouts Won % Turned into a possession % Shot %
Galway 12 43% 9 75% 7 58%
Tipperary 16 57% 14 88% 10 63%

Galway gained possession of the kickout a full nine times more than Tipperary yet managed one less shot.

On their own kickouts Galway went short seven times but only managed a shot twice. Of the remaining twenty kickouts they won a respectable 13. The problem is that when Tipperary won these kickouts they scored 2-02. The fear, when meeting Kerry who were very good on Cork’s kickouts for the mid 50 minutes, is that the grouping of Buckley, Sheehan, Walsh & O’Mahoney will win more than 35% of Galway’s contestable kickouts. If they do will they convert at the same rate that Tipperary did?

On the flip side Conroy, Flynn & O’Curraoin were very good on Tipperary’s kickouts winning 55% (12 from 22) of their kickouts that travelled past the 45.

Shot Charts
Galway’s shot chart is slightly strange in that they had more shots from the left than the right – Galway’s propensity to shoot from the left was evident in the Mayo game as well.

Galway’s shooting
Galway shooting (V Tipperary)

Tipperary’s shooting
Tipperary shooting (V Galway)
x = missed, disc = score, yellow = deadball, black = 1st half from play, white = 2nd half from play

Players with >= 2 shots from play

Shots Scores Success Rate Weighting
D Cummins (Galway) 6 2 33% -0.481
M Martin (Galway) 5 3 60% +0.998
C O’Riordan (Tipperary) 5 3 60% +0.893
P Conroy (Galway) 4 3 75% +1.008
P Acheson (Tipperary) 4 2 50% +0.026
S Armstrong (Galway) 3 2 67% +0.516
M Lundy (Galway) 3 2 67% +0.477
S Walsh (Galway) 2 2 100% +1.224
P Varley (Galway) 2 1 50% +0.234
M Quinlivan (Tipperary) 2 1 50% +0.224
G Hannigan (Tipperary) 2 1 50% -0.068
C Sweeney (Tipperary) 2 0 0% -0.785
P Austin (Tipperary) 2 0 0% -0.997

Kerry V Tipperary 2013

May 30, 2013

For those new to the blog, or who haven’t been here for a while, please find a refresher on the definitions and how the numbers are compiled here

Overall

Team Possessions Shots Shot Rate Scores Success Rate Weighting
Kerry 47 37 79% 21 57% +3.4764
Tipperary 27 19 70% 8 42% -1.843
2012 avg 35.28 27.02 76.6% 13.96 51.67%

Sometimes there is very little that can be added to the bare numbers. Kerry had 74% more possessions & 95% more shots. Their dominance was complete.

Shots from play

Team Shots Scores Success Rate Weighting
Kerry 28 17 61% +4.0449
Tipperary 10 2 20% -1.755
2012 avg 20.14 9.36 46.47%

Tipperary’s shooting from play was abject both in terms of quantity & quality. They didn’t shoot from inside the 20m line until the 28th minute whilst it was the 2nd half before they scored from play.

Kerry’s shooting was very good. To maintain such a high weighting, and Success Rate, whilst reigning in shots is testament of this. One note of caution however would be the quality of the opposition they faced. This is factored into the weighting, to an extent, as they were well ahead for the majority of the game (see here for explanation) however they only faced pressure on 1 of the first 7 shots they took in the 1st half – scoring 6 points. Tipperary started slow and maintained that gear throughout the game.

Shots from deadballs

Player Shots Scores Success Rate Weighting
J Buckley (Kerry) 4 2 50% -0.155
B Sheehan (Kerry) 3 1 33% -0.318
C Cooper (Kerry) 2 1 50% -0.096
B Grogan (Tipperary) 4 3 75% +0.059
C Sweeney (Tipperary) 3 3 100% +0.959
A Maloney (Tipperary) 1 0 0% -0.548
I Fahey (Tipperary) 1 0 0% -0.558
2012 team avgs 6.88 4.6 66.9%

Anyone who has read the blog for any length will know that one of Kerry’s major weak points is their deadball accuracy. In a game with no real pressure they had a return of 44% and a weighting of -0.569. Below are the combined ’12 Championship & ’13 League returns for games charted. Compare this to Donegal or Mayo’s returns.

Shots Scores Success Rate Weighting
’12 Championship 29 17 59% -4.76
’13 League 21 11 52% -3.71

Kerry’s shooting

Kerry shooting

Tipperary’s shooting
Tipperary shooting

x = missed, disc = score, yellow = deadball, white = play

Kickouts

Kickouts

Kerry were utterly dominant with a +16 differential in kickouts won a +12 in shots from those kickouts.

Kerry generally do not hit their kickouts long. In the 4 league games charted only 18% went beyond the 65m line – that continued in this game with only 13% (2/15) going long.

Players with >= 2 shots from play

Shots Scores Success Rate Weighting
J O’Donoghue (Kerry) 6 4 67% +0.888
C Cooper (Kerry) 5 4 80% +2.054
D Walsh (Kerry) 4 1 25% -0.533
P Galvin (Kerry) 3 2 67% +0.759
T O’Sé (Kerry) 3 1 33% -0.342
P Austin (Tipperary) 2 1 50% +0.248
Darran O’Sullivan (Kerry) 2 1 50% -0.106
Declan O’Sullivan (Kerry) 2 1 50% -0.106
P Acheson (Tipperary) 2 0 0% -0.714

Tipperary Vs Kerry

May 28, 2012
Team Possessions Shots Shot Rate Scores Success Rate
Tipperary 30 25 83% 10 40%
Kerry 37 27 73% 16 59%
avg 41.8 28.3 67.7% 14.1 49.8%

Thanks Tipp! One week after saying we might not see another 80% shot rate this year Tipperay only go and give us 83%.

When Galway returned a shot rate of 80% it was due to a soft Roscommon defence. This time however I’m more inclined to attribute the high shot rate to Tipperary’s patience in working what little attacking ball they had into shooting positions. It was their shooting from play, after working hard to get the opening, that let them down.

In 2010 Kerry were very good at limiting the opposition to below average possessions – this seems to have continued through to 2012. It will be a blog post for later in the year but understanding how much attacking ball the opposition is going to “let” you have should be a big part of a manager’s equation for when to introduce second half substitutions. Kerry don’t give you as many possessions as other teams – you need to get your subs on earlier if you want to them to affect the scoreboard.

That’s 2 teams so far this year that have had a shot rate over 80%. This could be a blip or the emergence of a trend – a deliberate possession based approach worked on over the Winter to counteract the mass defences. Time will tell.

From play

Team Shots Scores Success Rate Vs Expected
Tipperary 17 5 29% -3.20
Kerry 17 9 53% +1.07
avg 21.1 9.3 44.0% 0.00

From deadballs

Shots Scores Success Rate Vs Expected
B Sheehan (Ker) 8 5 63% -1.20
C Cooper (Ker) 2 2 100% +0.12
A Maloney (Tipp) 4 3 75% +1.18
M Quinlivan (Tipp) 4 2 50% -1.50
team avgs 7.3 4.8 66.5% 0.00

Tipperary worked hard to keep the ball and get into shooting range – and then blew it. 12 of Tipperary’s 17 shots from play were from in front of the posts (sections 5 & 8) however only 4 of these were converted. That won’t cut it in any game -let alone one against Kerry.

Kerry were Kerry – efficient at converting possession to shots and above average with their shooting accuracy. The one real drawback of note would be their deadball striking. Brian Sheehan is a very good free taker but against Tipperary he was below average. He missed 2 frees inside the 45m and the ones he converted were not sufficiently difficult enough to bring his performance back up.

One thing that Kerry are very good at is working the ball into positions that are favourable to their forwards. The below shows where they took their shots from and compares it to what Donegal & Galway did.

Segment 1-3 4&6 5 7&9 8
Donegal
from play 0% 40% 20% 10% 30%
in total 4% 50% 14% 7% 25%
Galway
from play 0% 36% 21% 21% 21%
in total 0% 38% 22% 19% 22%
Kerry
from play 0% 24% 29% 18% 29%
in total 4% 22% 33% 11% 30%

Now this comes with a big caveat in that it is each teams first game of the year but Kerry’s shooting is conspicuously weighted towards the sections directly in front of goal. 63% of their shots came from in front of the goals (section 5 & 8) as oppossed to 44% and 39% for Galway & Donegal respectively. They are taking shots from areas that favour their forwards; ones that consistently have a better success rate. Once we have a few games for each of the main protagonists we’ll have a better view of the individual team’s tactics re where they want to shoot from.

Players with >= 2 shots from play

Shots Scores Success Rate Vs Expected
C Cooper (Ker) 4 2 50% +0.33
P Austin (Tipp) 4 1 25% -1.30
P Acheson (Tipp) 3 2 67% +0.80
Declan O’Sullivan (Ker) 3 2 67% +0.73
A Maloney (Tipp) 3 1 33% -0.32
Darran O’Sullivan (Ker) 3 1 33% -0.57
K O’Leary (Ker) 2 1 50% +0.01
H Coghlan (Tipp) 2 1 50% -0.08
G Hannigan (Tipp) 2 0 0% -0.80
M Quinlivan (Gal) 2 0 0% -1.10

Quinlivan had a tough day all round. Kerry’s big guns, whilst not firing, were adequate.