For those new to the blog, or who haven’t been here for a while, please find a refresher on the definitions and how the numbers are compiled here
| Team | Possessions | Attacks | Shots | Scores | Exp Pts |
| Donegal | 44 | 39 | 27 | 1 – 11 | 16.86 |
| Monaghan | 47 | 37 | 26 | 0 – 14 | 15.14 |
At a macro level the returns for both teams are very similar with just three possessions, 2 attacks & 1 shot separating them. Nothing untoward or unexpected given the recent history of these two teams. What did differ however was just how bad Donegal’s shooting was. It was much more erratic than Monaghan’s evidenced by the low conversion rate of 44% and leaving >2.5 points behind them.
Donegal managed to create three good goal opportunities through Gillespie, McBrearty and MacNiallais. Those goal attempts returned an Expt Pts tally of +0.43. Given this was a positive, and the overall return was a negative then Donegal’s point taking is shown up as poor, bordering on feeble. Donegal scored 0-10 from 24 point attempts (42% conversion rate) with a combined Expt Pts of -3.29. Their shooting from play was below average (38% with an Expt Pts of -0.62) but not terrible – it was their free taking that really let them down.
Before we turn to Donegal’s deadballs we need to touch on Monaghan. They will be very concerned with their last quarter as, after the red card in the ~55th minute, they only managed to create two shots more than Donegal and more worryingly they only created the one shot from play in those final 20 minutes.
Deadballs
McManus was outstanding from frees converting 78% (7 from 9) with an Expt Pts tally of +0.93. The raw numbers do not do justice to his performance however as his 6th and 7th points were both converted from outside the 45, in injury time, whilst one of the misses was basically on the 20m flag from the right with the right foot.
Possibly of more importance for Monaghan, looking towards the replay, was the 33% conversion rate of the supporting cast. Monaghan rely on deadballs more than any team so to see K Hughes & R Beggan miss their only free – both from the right as was one of McManus’s misses – will be of slight concern to Malachy O’Rourke and his management team.
Whatever concerns Monaghan may have in this area will pale into insignificance compared with those of Donegal. McBrearty & Murphy were 45% from 11 attempts and had a combined Expt Pts of –2.53. In such a tight encounter you cannot leave that many points behind you.
On raw returns McBrearty would escape much of the blame scoring 0-03 from his four attempts however the one he missed was on the top of the D and should be converted 70-80% of the time.
Murphy was very poor scoring 0-02 from 7 attempts. There are mitigating circumstances in that two of his misses were outside the 45m line whilst a third was just inside the 45 from wide on the left. Even if you were to be generous, and exclude these three attempts, his returns were 0-02 from four with an Expt Pts tally of -0.67. Include them and the Expt Pts tally rises to -2.12.
We know Murphy is better than that. History has shown us that he is an above average deadball striker. Donegal will need him to (re)find his accuracy in the replay.
Kickouts
Much was made of the kickouts – especially Donegal’s – at half time in the Sky coverage. The gist being that the fact they had lost 4 of their 12 first half kickouts (whereas Monaghan lost just one of their nine) showed a poor kickout strategy.
At the time I was a bit dismissive of this as Donegal had netted 0 – 03 (Donegal scored 0-04 from the 8 they won whilst Monaghan scored 0-01 from the 4 they won) from their own kickouts whilst Monaghan had scored 0-01. However when we look at shots created from kickout possessions it was level at 5 apiece at half time. Extend that out to the 70mins and Monaghan created 10 shots from the kickouts they won to Donegal’s 7.
The loss of Durcan does appear to have robbed Donegal of some of their subtlety on kickouts and what is easily decipherable can also be easily targeted.
The Goal
Finally a quick note on the goal. Donegal had just gone down to 14 men and this was the first Donegal possession after this. Timely indeed but given the game situation it was surprising to see MacNiallais in acres of space in front of goal.

As can be seen above MacNiallais got a helping hand to create this space. Fintan Kelly (18) was marking MacNiallais (9) whilst Gillespie was also being man marked. MacNiallais got free however as Gillespie managed to step across Kelly and “help” him to the ground thus freeing MacNiallais up and giving himself a yard on his marker to receive the ball.
As Ciaran McMonagle (@CiaranMcMonagle – a good follow) said on Twitter “illegal but clever”
Appendix
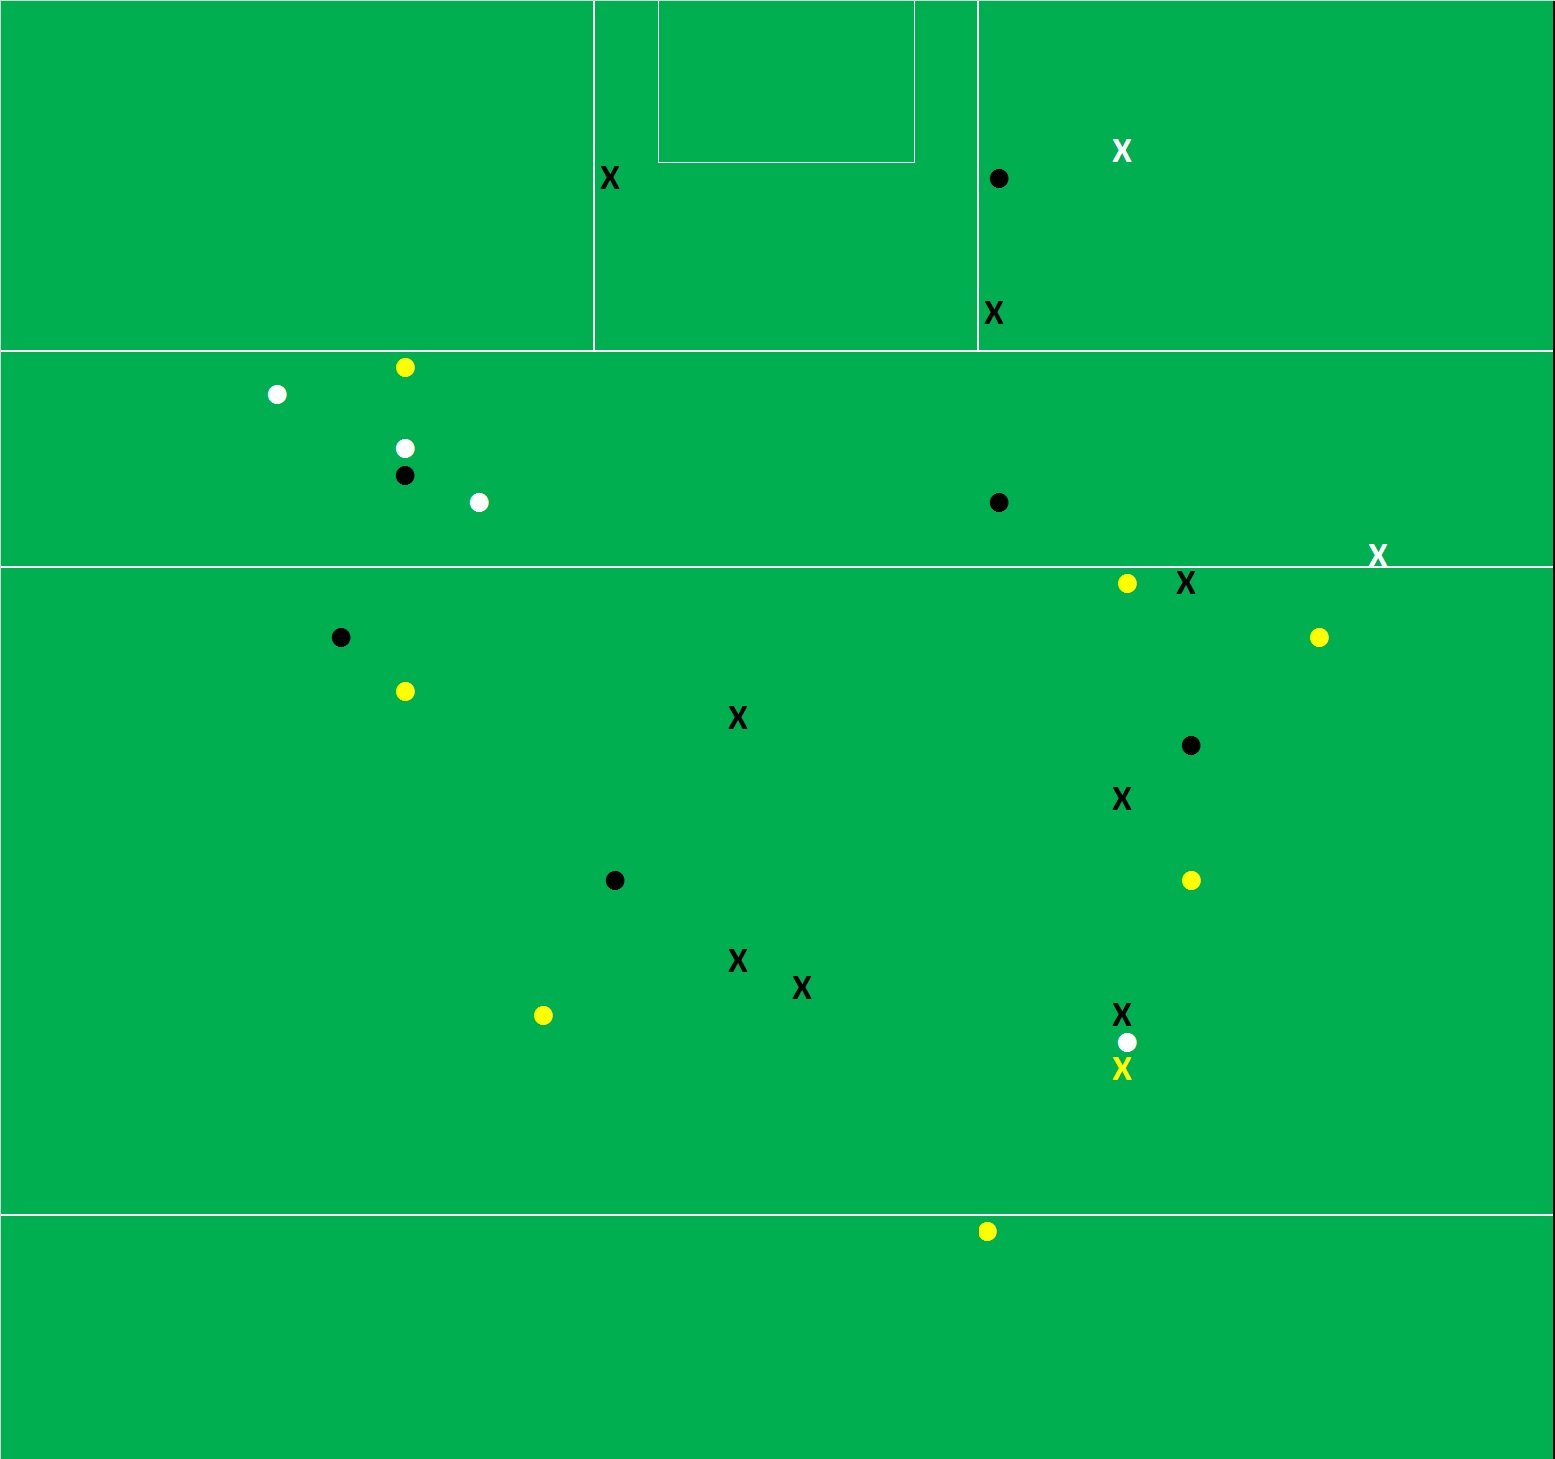
Shot Charts
Donegal’s shooting

Monaghan’s shooting

x = missed, disc = score, yellow = deadball, black = 1st half from play, white = 2nd half, red = goal attempt