Archive for the ‘Qualifier’ Category

Derry v Tipperary 2016 AI Qualifiers

July 28, 2016

For those new to the blog, or who haven’t been here for a while, please find a refresher on the definitions and how the numbers are compiled here

Team Possessions Attacks Shots Scores Exp Pts
Derry 45 34 30 2 – 17 19.91
Tipperary 52 47 37 1 – 21 23.86

Tipperary controlled this game in many respects recording seven more possessions and 13 more attacks which culminated in seven extra shots. The drop from 13 additional attacks to just the seven extra shots can be attributed to Derry being more proficient at getting their shots off once inside the 45. The main reason Tipperary were within a whisker of going out of the Championship was Derry’s shooting.

Derry produced an Expt Pts tally of +6.09 which was bettered only by Tyrone’s +10.17 in the drawn game against Cavan when they smashed in 5-18 (as an aside the best Expt Pts games will always be those with a high volume of goals as you’re getting ~+1.8 Expt Pts for any that you convert).

Derry were aided by scoring 2-01 from their three goal chances (Expt Pts of +3.43) as well as converting all four frees (Expt Pts of +0.97) but their point taking really stood up converting 52% with an Expt Pts of +1.69.

It is hard to be critical given their overall returns but if you were to pick anything to review from their shooting display it would be the shot selection in the first half when playing in to the wind. Then they were 45% (0 – 05 from 11) with an Expt Pts return of -0.29. This is particularly harsh as it is viewed against the prism of their second half display (58%; 0 – 07 from 12 and +1.98) but in a one point game it is the small things that can be the making or breaking of a day.

Tipperary’s high score was not the product of excellent shooting but that of volume. 37 shots is an excellent return and ranks up there with the highest this year (Monaghan had 39 in their drubbing of Down). Their shooting was bang on average with a total Expt Pts of +0.14 recording Expt Pts tallies of -0.57 on goal attempts (1 – 00 from 3), -0.29 on deadballs (0 – 09 from 13) and +1.00 (0 – 12 from 21) on point attempts.

Sweeney & Quinlivan, working as an inside tandem, were extremely effective when shooting for points scoring a combined 0 – 07 from just eight shots (Expt Pts +2.53)

Derry’s defending late on

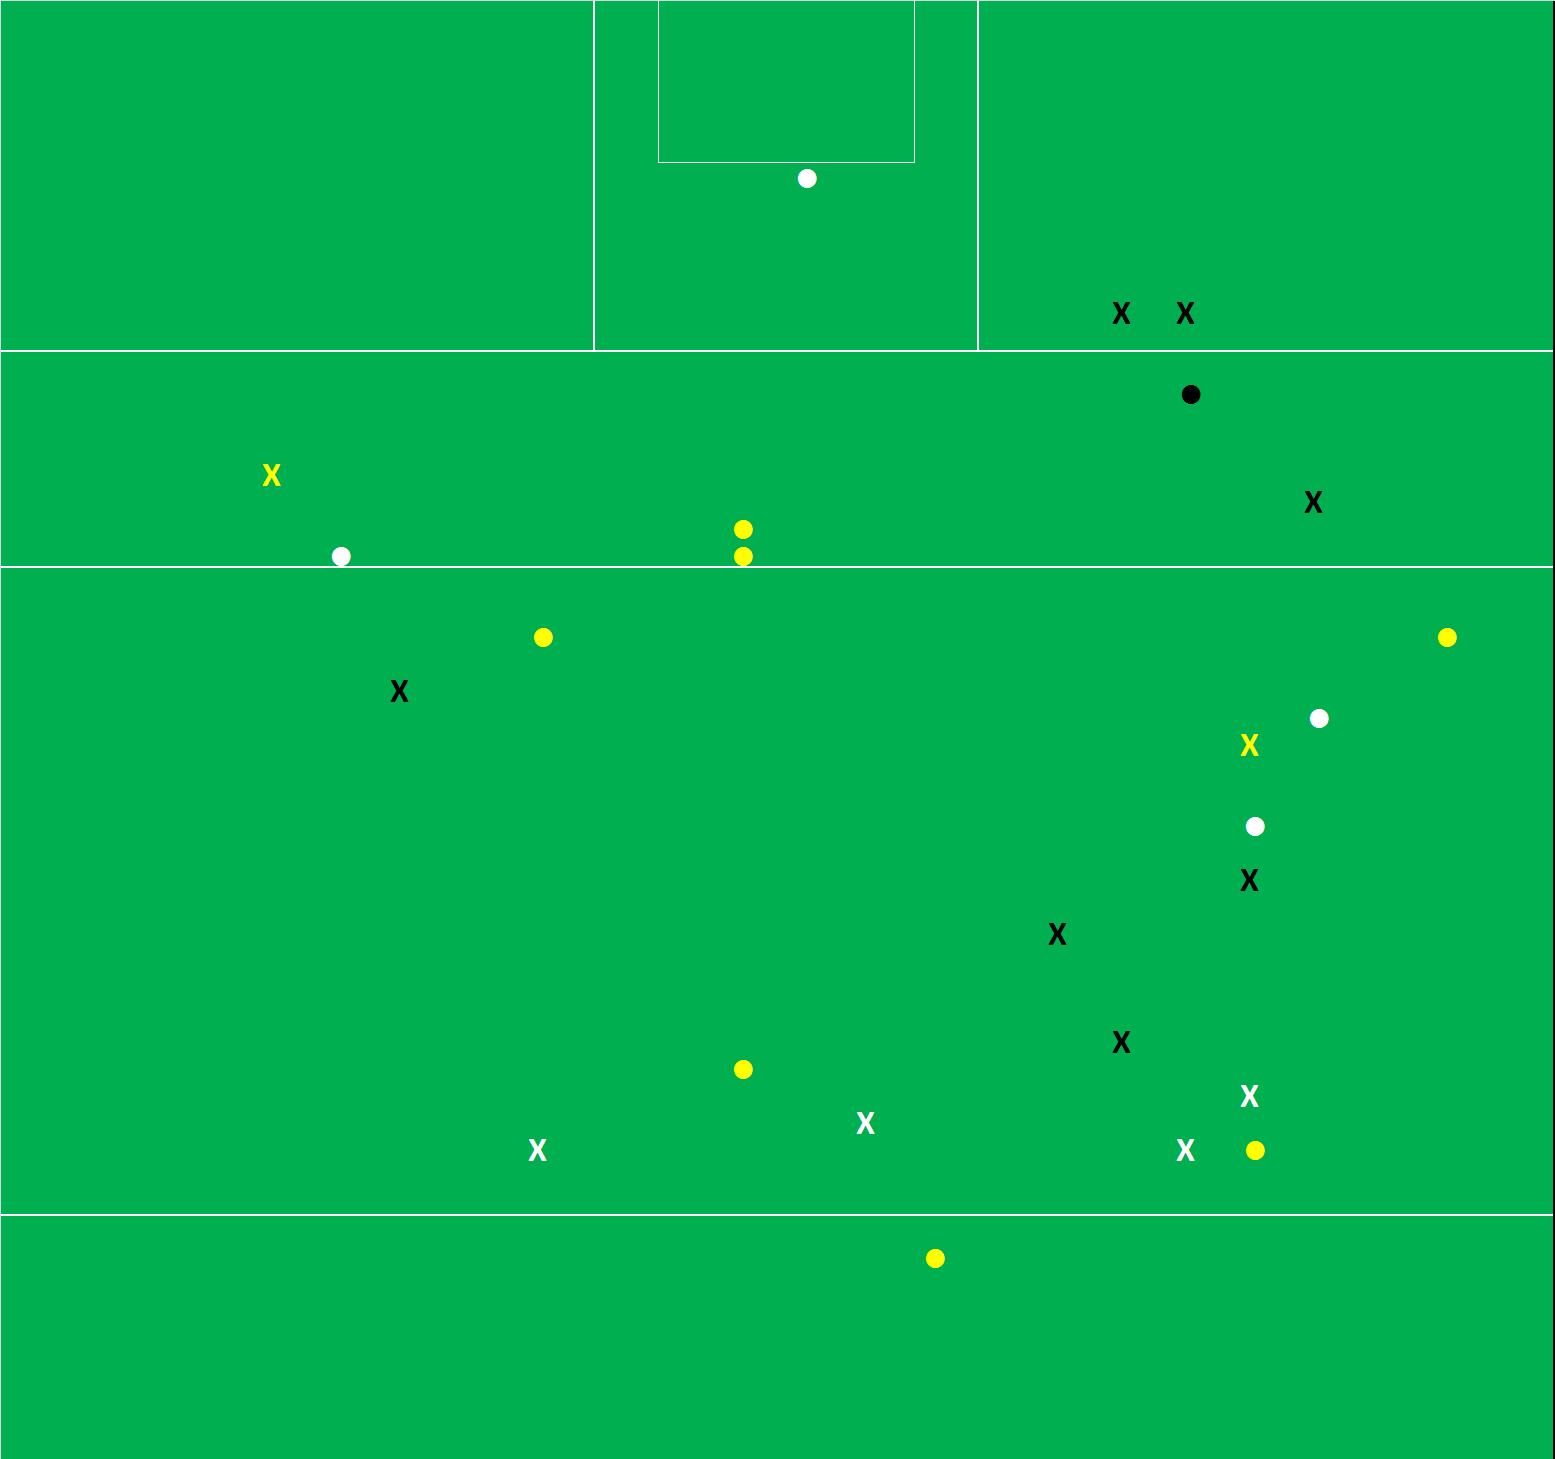
For all the excellent shooting above what stood out most was Derry’s defensive frailties in injury time. Below is a sequence of images from the 71st minute which shows any amount of space for the Tipperary forwards to roam into in the period

Equalising point

Derry Pic1 v Tipp

Tipperary attacked down the left but got stopped. Derry’s whole defence got sucked towards the ball however which meant that two quick passes to the right bye passed six Derry defenders and left an ocean of space for Sweeney to run in to for the equalising point. There is no Derry defender down the right or even covering in front

Leahy shot

Derry pic2 v Tipp

Tipperary won the subsequent kickout and attacked down the right which culminated in a blocked Leahy shot. Just before Leahy pulled the trigger however there was a moment when a simple popped hand pass (which came but was just out of reach of Leahy forcing him towards the by-line) would have created a three on one down Derry’s right.

Winning point

Derry pic3 v Tipp

Keane won a free after tackling Derry high up the pitch (as Derry were trying to exit following the Leahy blocked shot) and had a choice of players to choose from all of whom were in prime attacking position. He chose the right option in Sweeney but really could have given the ball to three players. In this instance Derry were trying to break with the ball, and win the game themselves, after winning a free to stop Tipperary but in doing so left their defence completely exposed.

And yet despite all this Derry still had a chance to draw level with the last shot of the game. In many ways it was a shame that the shot fell to Rogers as although he has the skill to convert that shot, and given his positioning he had to take the shot on, it was he that burst out of defence to create the chance. This after 75 minutes when there were players wilting all around and this was his first shot of the game. As mentioned he had to take it but I’ve no doubt the Derry sideline would have wished for someone else to be on the ball given the circumstances.

Kickouts

2 – 22 of the 3 – 38 scored on the day emanated from kickouts. With their quarter final against Galway on the horizon Tipperary will want to tighten up in this aspect. They lost 9 of their 22 kickouts but that total includes eight that went short. So of those that passed the 45m line they lost 64% (9 of 14) and managed to concede 2 – 04 from those nine losses. It is a rare day that your kickouts can be such a millstone and yet you come out the right side.

Clare v Roscommon 2016 AI Qualifiers

July 26, 2016

For those new to the blog, or who haven’t been here for a while, please find a refresher on the definitions and how the numbers are compiled here

Team Possessions Attacks Shots Scores Exp Pts
Clare 55 39 34 2 – 12 21.53
Roscommon 54 32 22 1 – 09 14.45

Combined the Expt Pts in this game was -5.98; the two teams scored six points less than an average intercounty team would be expected to score given the shots taken. It is going to be hard to take too many positives from a game with such numbers.

Clare Shooting

Clare’s shooting returns were poor with a Conversion Rate of just 41% (14 scores from 34 shots) and an Expt Pts tally of -3.53. Unfortunately for Clare no segmentation of the shooting shows a positive return
> Inside the 20m line; 42% (5 from 12) with an Expt Pts of -0.68
> Outside the 20m line; 36% (5 from 14) with an Expt Pts of -0.95
> Deadballs 50%; 50% (4 from 8) with an Expt Pts of -1.90

Undoubtedly there were some very poor misses – Cleary’s missed fisted point, a poor Ryan pass for Sexton in the first minute leading to a missed palmed effort – which Clare will hope to eradicate. And 12 shots from inside the 20m line is an indicator of their ability to create chances. But still that is poor.

This was our first Championship look at Clare (in the Division 3 league final they were more or less average with a 51% Conversion Rate and an Expt Pts tally if -0.99) so we cannot draw too many conclusions but they cannot be as profligate in the quarter final.

Kickouts

At a high level Clare won just 37% (17 of 46) of all kickouts and 63% of their own (12 from 19) with a net point difference of minus two points (Roscommon scored 0 – 06 from the kickouts they won with Clare similarly scoring 0 – 04).

Clare particularly struggled in this respect when playing against the wind in the first half. Seven first half kickouts travelled past the 45m line with Roscommon winning five; in the second half three went past the 45m line with Clare winning all three thus leaving Clare winning 50% of their own contestable kickouts.

They also had trouble with the short ones losing two of nine. They lost two short ones in the Kildare game as well. With limited data they appear to prefer the short kickout (60% of kickouts over the two games) but losing 15% (4 out of 27) is opening yourself up to potential disaster..

Roscommon

Roscommon had as many possessions as Clare but even given Clare’s very poor shooting Roscommon’s 0.22 points per possession was way below that of Clare. Indeed the 0.21 Mayo recorded against Galway was the only one worse this year.

The reason for such a poor return is twofold. Firstly Roscommon were anaemic in their efforts to get the ball in to Clare’s 45 with only 59% of their possessions ending up as an attack. This again was the second worst recorded this year behind Meath’s 57% against Dublin (as an aside the only other return below 70% was Galway’s against Mayo).

Secondly their shooting was also poor showing a Conversion Rate of 45% with an Expt Pts of -2.45. You can have low attacking volumes, or poor shooting, and survive. You cannot have both.

What struck me more than the shooting however was the way that Roscommon approached the game. The below picture shows the movement for Clare’s attack in the first minute.

PhotoGrid_1469349777236

I would have thought that Roscommon would be busting a gut to make amends after the Connacht final replay but Ryan’s pass and run are never tracked and Brennan is allowed to turn inside without a hand being laid on him thus drawing the cover and allowing Ryan in behind.

Now the question becomes is that a system issue (Smith should not be responsible for tracking a livewire like Ryan & Keenan did not have the strength for Brennan) or a player attitude/mental fatigue issue? That we cannot decipher but it was not the first time that this happened.

PhotoGrid_1469547131961

Above is the substitute McGrath taking a kickout in acres of space. Smith had just missed the goal chance in the 61st minute to bring the sides level. Roscommon’s tails were up and the Clare goalie had not rushed the kickout (32 seconds between Smith’s shot and the kickout). McGrath to be that open at that stage of the game is criminal. Roscommon were chasing the game so I can understand there being a lack of cover but even still for no one to lay a hand on him before taking a shot just outside the 20m line added injury to insult.

These were two incidents either end of the game. There were many more. It will be a long Winter for the Roscommon team.

Fermanagh V Westmeath 2015 Qualifier

July 31, 2015

For those new to the blog, or who haven’t been here for a while, please find a refresher on the definitions and how the numbers are compiled here

Overall

Team Possessions Attacks Attack % Shots Shot % Scores Success % Weighting
Fermanagh 48 37 77% 31 84% 14 45% -1.508
Westmeath 47 36 77% 25 69% 7 28% -6.793
Avg 37.0 28.7 77.7% 14.7 51.2%

An even enough game in terms of how much ball the teams had (possessions) and where they had it (attacks). The differential was in the attacking play and the accuracy of the shooting.

Once inside the 45 Fermanagh were able to get shots off (though the Shot Rate was boosted by their willingness to shoot from the wings – more of that anon) however Westmeath seemed to run out of ideas once met by Fermanagh’s defensive screen. 25 shots from 36 attacks is a low enough return.

On top of that, for the second game in a row, Westmeath’s accuracy was very poor. It was so poor that Fermanagh could have a below average outing and still win easily.

Shots from Play

Team Shots Scores Success % Weighting
Fermanagh 21 8 38% -0.845
Westmeath 17 4 24% -4.026
Avgs 21.4 9.7 45.3%

There was only one goal attempt in the game which Corrigan finished with aplomb.

There was one occasion in the first half however when Fermanagh, after overturning the ball high up the pitch, had a running overlap which they could have converted with an attacking hand pass. Instead the pass went square and Westmeath got back. Against Dublin they will need to be more aggressive.

PhotoGrid_1438204111218

When going for a point Fermanagh were poor converting 35% (7 from 20) with a weighting of -1.507. The main reason for this was where Fermanagh took their shots from. Only 35% were central – of the remainder Fermanagh converted 31% on 13 attempts. If you are going to shoot from wide you better have your shooting boots on – if they’re not on you better get more central.

Whilst not wishing to be overly critical of Westmeath that is now two games where they have trailed for long periods of the second half and in which they have not manufactured one shot on goal. As well as that their shooting from play was decidedly poor converting just 25% (8 from 32) of their point attempts for a combined weighting of -6.81. Combine both elements (poor shooting and no goal attempts) and you get some dismal returns from your possession.

pts per possession 31.07.2015

Shots from deadballs

Player Shots Scores Success % Weighting
T Corrigan (Fermanagh) 6 5 83% +0.853
S Quigley (Fermanagh) 4 1 25% -1.516
J Connellan (Westmeath) 3 2 67% -0.295
R Connellan (Westmeath) 3 1 33% -1.062
P Sharry (Westmeath) 1 0 0% -0.621
G Egan (Westmeath) 1 0 0% -0.789

Only for Corrigan! In the first half there were 12 shots at goal from a deadball – with only four converted (33% versus an average of ~70%). The sequence is below. As the half was bookended with three points there were 8 misses from 9 attempts at one stage.

Point, Point, Wide, Wide, Wide, Wide, Point, Wide, Short, Wide, Wide, Point

Corrigan converted all five of his frees with the only miss being a rather rash attempt from a sideline ball.

Heslin being out proved a big hurdle for Westmeath to overcome and this was no more evident than when they turned down three opportunities for a shot at goal from a free inside Fermanagh’s 45. You have to imagine Heslin would have gotten two of them thus boosting Westmeath and placing great pressure on Fermanagh – in that first half particularly.

Kickouts

Fermanagh’s kickouts Won % Turned into an attack % Shot %
Fermanagh 10 56% 7 70% 5 50%
Westmeath 8 44% 8 100% 6 75%
Westmeath’s kickouts Won % Turned into an attack % Shot %
Fermanagh 10 34% 9 90% 7 70%
Westmeath 19 66% 15 79% 11 58%

We missed one of Fermanagh’s kickouts. Of the remaining 17 three went short meaning that of the 14 “contestable” kickouts Westmeath won the battle 8 – 6. This will have to be an area of concern going in to the next day..

Turnovers

Team giving up the ball Pass In the Tackle Shot Other
Fermanagh 11 4 1 3
Westmeath 10 8 6 1

Nothing too earth shattering here though Fermanagh did give up three turnovers inside their own 65 which Westmeath were unable to convert to a score. They will have to mind the ball better against Dublin

Players with >= 3 shots from play

Shots Scores Success % Weighting
T Corrigan (Fermanagh) 5 3 60% +0.920
S Quigley (Fermanagh) 4 1 25% -0.729
S Dempsey (Westmeath) 4 1 25% -0.979
D McCusker (Fermanagh) 3 2 67% +0.807
J Connellan (Westmeath) 3 2 67% +0.733

Galway v Tipperary 2014 Championship

July 30, 2014

For those new to the blog, or who haven’t been here for a while, please find a refresher on the definitions and how the numbers are compiled here

Overall

Team Possessions Shots Shot Rate Scores Success Rate Weighting
Galway 44 38 86% 21 55% +2.672
Tipperary 39 28 72% 16 57% +2.233
Champ (’12 & ’13 avg) 35.8 27.6 77.2% 14.1 51.0%

Excellent shooting from both teams however the overall numbers are tempered by (a) the volume of goal shots converted and (b) the volume of shots taken under pressure.

There were 12 goal shots in the game (7 for Galway, 5 for Tipperary including the penalty) with 9 resulting in a score. Goal shots generally end in a score c40% of the time. Converting a goal shot is therefore quite a low percentage shot (versus going for a point in the same position) so the weighting is quite high when they are converted. Converting 9 obviously has a huge effect.

Of the 52 shots from play I charted only 35% (18 from 52) being taken under pressure – take out the goal shots and that drops to a paltry 27% (11 out of 41). The lack of pressure is not the sole reason for the excellent returns but it surely helps!

Where attacks originated

Opposition k/out Own k/out Ball received in Own 3rd Ball received in Mid 3rd Ball received in Opposition 3rd Other (throw-in, rebound etc.)
Galway 9 12 15 2 1 5
Tipperary 7 14 10 4 2 2

Very similar returns for both teams. Both teams managed 21 attacking possessions from kickouts whilst Galway edged two more possessions from turnovers (18 to 16).

The difference in shots came mainly, as we will see below, from turnovers. Galway had 2 extra attacking possessions from turnovers but managed 8 extra shots from the turnovers gained.

Shots from Play

Team Shots Scores Success Rate Weighting
Galway 30 18 60% +4.944
Tipperary 22 11 50% +1.401
Champ avgs (’12 & ’13) 20.3 9.2 45.4%

The Galway returns are excellent. They managed 7 shots at goal scoring 4-01 and converted 57% (13 from 23) of their point attempts. As noted earlier the concern going forward is can they replicate this? Only four of those 23 point shots were taken under pressure

Shots from deadballs

Player Shots Scores Success Rate Weighting
S Walsh (Galway) 5 3 60% -0.574
P Conroy (Galway) 2 0 0% -0.857
M Martin (Galway) 1 0 0% -0.840
C Sweeney (Tipperary) 5 5 100% +1.672
B Grogan (Tipperary) 1 0 0% -0.840
team avgs (’12 & ’13 Champ) 7.3 4.9 66.7%

Very good from Sweeney – not much more could have been asked.

The first shot in the game Martin skewered a simple free from in front of goal and that seemed to set the tone for Galway’s performance. Combined they were 38% (3 from 8) with a weighting of -2.271. Shane Walsh’s sublime piece of skill to kill Conroy’s 45 with his instep hid the fact that the 45 itself was atrocious – dropping short and wide at the corner of the small square.

Turnovers

Team “coughing up” possession Shots from Turnovers %
Galway 22 11 50%
Tipperary 22 19 86%


Misplaced Pass Tackled Shots not going dead Other
Galway 11 6 4 1
Tipperary 12 5 0 5

The turnover numbers are quite low – 44 in this game versus 58 in the Cork-Sligo game – however the striking number is that 86% from Galway. Of the 22 turnovers they created/received they managed to convert 19 to shots. Thier foot passing into the space for the forwards to latch on to was excellent.

All four of their goals came from Tipperary turnovers

Kickouts

Galway’s kickouts Won % Turned into a possession % Shot %
Galway 20 74% 12 60% 8 40%
Tipperary 7 26% 7 100% 6 86%
Tipperary’s kickouts Won % Turned into a possession % Shot %
Galway 12 43% 9 75% 7 58%
Tipperary 16 57% 14 88% 10 63%

Galway gained possession of the kickout a full nine times more than Tipperary yet managed one less shot.

On their own kickouts Galway went short seven times but only managed a shot twice. Of the remaining twenty kickouts they won a respectable 13. The problem is that when Tipperary won these kickouts they scored 2-02. The fear, when meeting Kerry who were very good on Cork’s kickouts for the mid 50 minutes, is that the grouping of Buckley, Sheehan, Walsh & O’Mahoney will win more than 35% of Galway’s contestable kickouts. If they do will they convert at the same rate that Tipperary did?

On the flip side Conroy, Flynn & O’Curraoin were very good on Tipperary’s kickouts winning 55% (12 from 22) of their kickouts that travelled past the 45.

Shot Charts
Galway’s shot chart is slightly strange in that they had more shots from the left than the right – Galway’s propensity to shoot from the left was evident in the Mayo game as well.

Galway’s shooting
Galway shooting (V Tipperary)

Tipperary’s shooting
Tipperary shooting (V Galway)
x = missed, disc = score, yellow = deadball, black = 1st half from play, white = 2nd half from play

Players with >= 2 shots from play

Shots Scores Success Rate Weighting
D Cummins (Galway) 6 2 33% -0.481
M Martin (Galway) 5 3 60% +0.998
C O’Riordan (Tipperary) 5 3 60% +0.893
P Conroy (Galway) 4 3 75% +1.008
P Acheson (Tipperary) 4 2 50% +0.026
S Armstrong (Galway) 3 2 67% +0.516
M Lundy (Galway) 3 2 67% +0.477
S Walsh (Galway) 2 2 100% +1.224
P Varley (Galway) 2 1 50% +0.234
M Quinlivan (Tipperary) 2 1 50% +0.224
G Hannigan (Tipperary) 2 1 50% -0.068
C Sweeney (Tipperary) 2 0 0% -0.785
P Austin (Tipperary) 2 0 0% -0.997

Cork V Sligo 2014 Championship

July 28, 2014

For those new to the blog, or who haven’t been here for a while, please find a refresher on the definitions and how the numbers are compiled here

Overall

Team Possessions Shots Shot Rate Scores Success Rate Weighting
Cork 44 38 86% 21 55% +2.055
Sligo 35 25 71% 12 48% -0.662
Champ (’12 & ’13 avg) 35.8 27.6 77.2% 14.1 51.0%

An excellent set of numbers from Cork with all the main markers coming in above average. They will also be delighted, from a defensive point of view, that they kept Sligo to a Shot Rate as low as 71%. Sligo had a lot of the ball but were unable to penetrate Cork’s defense in any meaningful way.

Where attacks originated

Opposition k/out Own k/out Ball received in Own 3rd Ball received in Mid 3rd Ball received in Opposition 3rd Other (throw-in, rebound etc.)
Cork 6 13 14 7 1 3
Sligo 2 17 11 2 2 1

Both teams manufactured 19 attacking possessions from kickouts – it was Cork’s ability to (a) create turnovers (or conversely Sligo’s inability to mind the ball) and (b) convert the turnovers they manufactured into shots that ensured Cork had so many more attacks.

Shots from Play

Team Shots Scores Success Rate Weighting
Cork 29 15 52% +1.495
Sligo 16 5 31% -1.258
Champ avgs (’12 & ’13) 20.3 9.2 45.4%

Again good accuracy from Cork. Kerrigan was granted man of the match for his industrious performance that resulted in 5 points from play from 10 shots however it is Colm O’Neill’s returns that were the real highlight; 6 from 6 with a weighting of +2.959 which is just behind the weighting achieved by James O’Donoghue against Cork. Add in his deadball accuracy and he had a 100% game (3x frees, 1x 45, 2x points from the right & 4x points from the centre). The only blip was that one of his points was an attempt at goal – but still he at least got the point.

There will come a point when we can adequately judge the quality of the opposition’s defence on a player’s shot attempts however until then the weighting is the best method we have for comparing performances across games. Personally I think Munnelly’s performance against Dublin is the best this year but from a weighting perspective this O’Neill performance, and O’Donoghue’s game against Cork, lead the way.

Speaking of goal attempts Cork only had the two (O’Neill’s & Goulding’s towards the end of the game) from 29 shots. Four times they were close enough to goal to attempt a fisted point (Kerrigan missed one whilst off balance). If that was Dublin they would have looked to recycle the ball and created one if not two goal shots.

Shots from deadballs

Player Shots Scores Success Rate Weighting
C O’Neill (Cork) 4 4 100% +1.638
A Walsh (Cork) 3 1 33% -0.757
B Hurley (Cork) 2 1 50% -0.322
A Marren (Sligo) 7 5 71% -0.309
M Breheny (Sligo) 2 2 100% +0.906
team avgs (’12 & ’13 Champ) 7.3 4.9 66.7%

Considering the scoreline was not close for large tracts of the game it might be somewhat surprising that there were 16 shots at goals from frees (2x 45s made up the rest of the deadballs) however this is bang in line with the 2013 average (one free for every 2.8 shots from play).

Looking ahead the spread of those Cork players committing the fouls was wide with only Aidan Walsh (x3) committing more than one foul from which Sligo attempted a shot.

Although Marren had a relatively good Success Rate at 71% the negative weighting indicates that the level of difficulty of those he converted were on the easy side. All 5 were central with only the long range effort just outside the 45 being considered on the difficult side.

Given the deadball talent at their disposal Cork’s long range free taking was below par with Walsh missing two (a long range free & a 45) whilst Hurley also missed a free just outside the 45.

As we have touched on earlier the one bright spark for Cork from deadballs was O’Neill – though even at that his four were relatively central as well.

Turnovers

Team “coughing up” possession Shots from Turnovers %
Cork 25 15 60%
Sligo 33 22 67%


Misplaced Pass Tackled Shots not going dead Other
Cork 11 5 5 4
Sligo 16 6 4 7

Pretty good from Cork. Although there were quite a high volume of turnovers in the game Cork only committed 25 with a high percentage (20%) coming from shots dropping short.

Cork also converted 67% of Sligo’s 33 turnovers to shots. As an overall percentage 67% is just a tad below the best returns but is very respectable.

One point they will want to tidy up on is giving turnovers away in their own half. On three occasions Cork gave Sligo the ball within their own 65. Sligo managed one point from these three turnovers however more clinical teams will be looking to pounce on such lapses.

Kickouts

Cork’s kickouts Won % Turned into a possession % Shot %
Cork 16 80% 13 81% 11 69%
Sligo 4 20% 2 50% 2 50%
Sligo’s kickouts Won % Turned into a possession % Shot %
Cork 9 29% 7 78% 5 56%
Sligo 22 71% 16 73% 11 50%

There was much criticism of Cork’s kickout strategy against Kerry with little variation exhibited when Kerry got on top. In that game Cork’s first five kickouts went long – long – long – long – mid. Here they went short – short – mid – short – mid. A case of change & adapt!

Against Sligo Cork were much more concerned with securing primary possessions from their kickouts than had been the case previously with 50% of all their kickouts going short. Their running & transition game was working effectively so they were able to convert 60% (6 from 10) of these short kickouts to shots.

Of the remaining 10 Cork won 6 getting a shot from 5; Sligo got their hands on four and managed a shot from two of them. Cork will be pleased, considering the attention being placed on this area of their game post the Kerry match, that Sligo only got two shots in the entire game from their kickouts.

What might be of more concern for Cuthbert and his backroom staff will be how they performed on Sligo’s kickouts.

Sligo went short on 9 kickouts. Of the remaining 20 – which should be contestable given that the ball lands outside the 45 – Sligo gained possession on 60% (12 from 20). Their ability to convert that possession to shots was poor (6 shots from those 12 wins) given how far up the pitch they won that possession. Other teams may not be as forgiving.

Shot Charts

Cork’s shooting
Cork shooting (V Sligo)

Sligo’s shooting
Sligo shooting (V Cork)
x = missed, disc = score, yellow = deadball, black = 1st half from play, white = 2nd half from play

Players with >= 2 shots from play

Shots Scores Success Rate Weighting
P Kerrigan (Cork) 10 5 50% -0.194
C O’Neill (Cork) 6 6 100% +2.959
A Marren (Sligo) 5 1 20% -0.863
S Coen (Sligo) 4 2 50% +0.318
A Walsh (Cork) 4 1 25% -0.716
D Hodnett (Cork) 2 1 50% +0.282
M Breheny (Sligo) 2 1 50% +0.215
B Hurley (Cork) 2 0 0% -0.718
P Hughes (Sligo) 2 0 0% -0.785

Laois V Fermanagh 2014 Championship

June 27, 2014

For those new to the blog, or who haven’t been here for a while, please find a refresher on the definitions and how the numbers are compiled here

Overall

Team Possessions Shots Shot Rate Scores Success Rate Weighting
Laois 49 37 76% 20 54% +2.8431
Fermanagh 38 29 76% 17 59% +2.163
Champ (’12 & ’13 avg) 35.8 27.6 77.2% 14.1 51.0%  

A generally open game with Fermanagh’s accuracy, rather than any squandering on Laois’s part, leading to a close game.

The 49 possessions here indicate, alongside the 44 gained against Dublin, that this Laois team has a lot of attacking intent and will have enough ball to give any team a game.

Shots from Play

Team Shots Scores Success Rate Weighting
Laois 30 15 50% +2.009
Fermanagh 24 12 50% +0.298
Champ avgs (’12 & ’13) 20.3 9.2 45.4%  

Two things jump out. The first being the discrepancy in weightings considering that both teams converted 50%. Fermanagh’s weighting is hugely affected by two efforts for fisted points from Owens & Quigley from in front of the posts. There are not enough of these attempts in the database to give them a proper weighting so they are treated as normal attempts at a point from in front of goals – teams (& players) are pretty negatively affected when they miss these attempts.

The second is how good Laois’s returns were. Much of the commentary in the first half was around how Laois were squandering their supremacy. And they did – they only converted 2 of their first 10 shots. This impression of looseness was maintained throughout the game however after that initial period Laois were superb converting 65% (13 out of 20) of their shots including a remarkable closing sequence of 7 from 8.

There were some remarkable individual displays from Quigley (5 from 9 with a weighting of +1.115) and Kingston (5 from 8 with a weighting of +1.605). Indeed for one stretch of play, either side of half time, Quigley accounted for 10 of Fermanagh’s 12 shots.

Munnelly could not maintain his shooting accuracy from the Dublin game. It was noticeable however that after the Fermanagh goal in the first half it was Munnelly that took the next two shots and set up the third for Meredith’s point right before the half time whistle.

Shots from deadballs

Player Shots Scores Success Rate Weighting
D Strong (Laois) 4 2 50% -0.322
R Munnelly (Laois) 2 2 100% +0.906
D Kingston (Laois) 1 1 100% +0.160
S Quigley (Fermanagh) 5 5 100% +1.865
team avgs (’12 & ’13 Champ) 7.3 4.9 66.7%  

Excellent deadball striking all told with the only two misses coming from two long range Darren Strong frees.

Quigley’s returns were very good with only one of the four frees being central.

Kickouts

Laois’s kickouts Won % Turned into a possession % Shot %
Laois 19 76% 15 79% 11 58%
Fermanagh 6 24% 6 100% 6 100%
 
Fermanagh’s kickouts Won % Turned into a possession % Shot %
Laois 10 32% 9 90% 7 70%
Fermanagh 21 68% 14 67% 10 48%

Laois went short (were allowed go short by Fermanagh) on 54% of their kickouts which resulted in 9 shots and a return of 0-03. Fermanagh did not gain a possession from any of these kickouts.

When Laois went past the 45 with their kickout it became a contest. Fermanagh won 5 of the 11 and got a shot from all 5. Laois only managed to get two shots from the six that they won.

Fermanagh were better at defending the short kickout than Antrim were against Donegal (or conversely Laois were poor at turning the short kickout into a shot) but in both games they (Fermanagh & Antrim) were better served by forcing the opposition to kick long

Turnovers

Team “coughing up” possession # turnovers Shots from Turnovers %
Laois 27 11 41%
Fermanagh 28 18 64%


  Misplaced Pass Tackled Shots not going dead Mishandled possession Fouled ball
Laois 8 9 5 3 2
Fermanagh 16 5 3 2 2

Laois will be concerned by how often they got turned over in the tackle. The good news was that none of those particular turnovers occurred in their own third of the pitch. The bad news is that the 9 turnovers were spread over 7 different players so it appears to be a team wide “fault” in that they get dispossessed easier than most county teams (they also lost possession against Dublin 5 times through a tackle)

Shot Charts

Laois’s shooting
Laois shooting (V Fermanagh)

Fermanagh’s shooting
Fermanagh shooting (V Laois)
x = missed, disc = score, yellow = deadball, black = 1st half from play, white = 2nd half from play

Players with >= 2 shots from play

Shots Scores Success Rate Weighting
S Quigley (Fermanagh) 9 5 56% +1.115
D Kingston (Laois) 8 5 63% +1.605
R Munnelly (Laois) 6 2 33% -0.343
C Begley (Laois) 3 1 33% -0.135
D Strong (Laois) 3 1 33% -0.357
T McElroy (Fermanagh) 3 0 0% -1.283
C Meredith (Laois) 2 2 100% +1.003
E Maguire (Fermanagh) 2 2 100% +0.793
R Jones (Fermanagh) 2 1 50% +0.281
B Sheehan (Laois) 2 1 50% +0.234
P McCusker (Fermanagh) 2 1 50% +0.149
D Conway (Laois) 2 1 50% -0.125
B Owens (Fermanagh) 2 1 50% -0.417

Meath V Tyrone 2013

July 30, 2013

For those new to the blog, or who haven’t been here for a while, please find a refresher on the definitions and how the numbers are compiled here

Overall

Team Possessions Shots Shot Rate Scores Success Rate Weighting
Meath 35 27 77% 11 41% -2.5623
Tyrone 37 33 89% 17 52% +0.7507
2012 avg 35.28 27.02 76.6% 13.96 51.67%

Tyrone produced an excellent Shot Rate with it being well into the second half before they had a possession that didn’t result in a shot. Their shooting was quite good – as evidenced by an above average weighting on an average Success Rate – however there was quite a disparity between their shots from play and those from deadballs.

Very poor returns from Meath with only Wallace & Bray scoring from play. Goals at the start of either half kept them in touch but like Kildare the previous week Tyrone used their deadball accuracy to ensure they stayed just that step ahead.

Shots from Play

Team Shots Scores Success Rate Weighting
Meath 15 5 33% -1.2162
Tyrone 22 6 27% -2.8206
2012 team avgs 20.14 9.36 46.5%

That is one set of ugly numbers.

For two weeks in a row Tyrone have been lacklustre in front of goal, averaging a poor 32% (12 from 37) from play. Their returns in this game were hampered somewhat by attempting three shots at goal but not converting any – as ever the positive spin will be that they are creating the chances.

Outside of the excellent Wallace Meath converted one of their eleven shots from play – a paltry 9%. Graham Reilly was in excellent shooting form in the opening two games, scoring eight points from a mere eleven shots. In the subsequent games against Dublin & Tyrone he had one shot in each. His role in the team obviously changed to suit however in 2014 Meath may be best served by ensuring he bears more of the shooting burden.

A quick note on Séan Cavanagh. He has had two excellent outings against Kildare & Meath but his accuracy from play has been just below average. For the two games combined he has converted 37.5% (3/8). This does not diminish his overall performances but is a further indicator of Tyrone’s dependence on him – he has taken more shots than O’Neill & Penrose combined. From midfield.

Shots from deadballs

Player Shots Scores Success Rate Weighting
S Cavanagh (Tyrone) 6 6 100% +2.652
D McCurry (Tyrone) 5 4 80% +0.919
M Newman (Meath) 11 6 55% -0.846
P O’Rourke (Meath) 1 0 0% -0.500
2012 team avgs 6.88 4.6 66.9%

An absolutely superb day from Tyrone converting 91% (10/11). In the past two games their conversion rate is 81% (17/21; weighting of +2.833). Better still Cavanagh’s is 100% (9/ 9; weighting +3.128).

Prior to this display no player had received a weighting greater than 1.6; Cavanagh smashed that with a return of +2.652. He was able to do so given the relative difficulty of the shots he converted … his six frees all came from Sector 6 – on average those kicks are converted a little over 50% of the time.

McCurry also had a fine game from deadballs only missing the one 45. As a combination they have now converted a remarkable 89% (16/18) in the last two games. They are now performing at an equivalent level to Murphy & McFadden last year.

Monaghan were average against Donegal in giving away 6 frees within shooting range – they will want to maintain this discipline in the quarter-final. Tyrone has taken 9 shots (17 frees & 1 penalty) a game from deadballs against Kildare & Meath.

Newman’s deadball day was average. It is perhaps telling of the impression he has made that this comes as somewhat of a disappointment. His weighting gets hammered for missing a free from Sector8 despite the fact it was a desperation attempt at a goal … that aside he got the frees he was expected to get and didn’t convert enough of the higher tariff ones (three frees outside the 45 – converting one of them).

Shot Charts

Meath’s shooting

Meath shooting

Tyrone’s shooting

Tyrone shooting

x = missed, disc = score, yellow = deadball, white = play

Kickouts
Meath-Tyrone kickouts

Meath won possession from the first four kickouts but the contest settled down thereafter.
Just under a quarter of all kickouts went short (11/45) with a shot emanating from 73% (8/11) – from all other kickouts there was a shot from 47% (16/34) of possessions gained from a kickout.

Meath messed up a short kickout early in the game, handing Tyrone an easy point, however in the long run it may be more profitable for teams to work the possession through short kickout routines than risk the opponent gaining a shot through 50:50 kickouts.

Players with >= 2 shots from from play

Shots Scores Success Rate Weighting
E Wallace (Meath) 5 4 80% +1.726
S Cavanagh (Tyrone) 5 2 40% +0.045
D McCurry (Tyrone) 4 1 25% -0.930
Mattie Donnelly (Tyrone) 3 2 67% +0.438
S Bray (Meath) 3 1 33% -0.021
J Sheridan (Meath) 2 0 0% -0.776
C Cavanagh (Tyrone) 2 0 0% -0.795
B Farrell (Meath) 2 0 0% -0.837
C McGinley (Tyrone) 2 0 0% -0.866

Kildare V Tyrone 2013

July 25, 2013

For those new to the blog, or who haven’t been here for a while, please find a refresher on the definitions and how the numbers are compiled here

Overall

Team Possessions Shots Shot Rate Scores Success Rate Weighting
Kildare 34 28 82% 12 43% -0.7048
Tyrone 33 25 76% 12 48% -2.322
2012 avg 35.28 27.02 76.6% 13.96 51.67%  

There’s some numbers that might surprise! Tyrone won by two points, and for 55 of the 70 minutes had kept Kildare at an easy arms length, but judging by the raw numbers you would deem them to have fallen over the line.

This game had some very strange idiosyncrasies which no doubt fed into the overall weightings. You had a woeful Kildare shooting performance except for 10 minutes in the second half when they went 5 for 5, a very rare occurrence in a saved penalty, and a sideline converted when the player wasn’t shooting.

We will review the affects of the penalty and sideline in the deadball section but first we’ll take a look at Kildare’s splits.

Possessions Shots Shot Rate Scores Success Rate Weighting
1st Half 18 16 89% 4 25% -2.814
2nd Half 16 12 75% 8 67% +2.109

Kildare’s shooting was atrocious in that first half. The worst shooting performance in this year’s Championship was probably Roscommon’s against Mayo where they recorded a Success Rate of 35% & a weighting of -3.912 (Tyrone themselves had a Success Rate of 34% against Donegal but not as bad a weighting). Kildare in that first half were on track to smash both.

They completely turned it around at the start of the second half, scoring 6 points from 7 shots (and only 8 possessions). The problem thereafter was that they only managed to engineer a further 4 shots (excluding Johnston’s sideline) in c 20 minutes.

Tyrone themselves had a pretty poor second half with three of their five points coming from easy frees. O’Neill, McCurry & Mark Donnelly all missed chances from inside the 21m line as well as the penalty save.

Shots from Play

Team Shots Scores Success Rate Weighting
Kildare 20 7 35% -0.7263
Tyrone 15 5 33% -1.583
2012 team avgs 20.14 9.36 46.5%  

Tyrone’s shooting from play was worse than Kildare’s. Now that is due in part to the fact that Kildare were at their most successful when chasing a lead which leads to a better weighting (see here) however there was some strange shot selections as well. O’Neill (x2) & Sean Cavanagh both took shots tight to the endline. They have the skill to pull the spectacular off but 3 times? They may have been better recycling those chances.

Kildare’s real problems came from a sector to the right of the goal. Kildare attempted ten shots within a small area covering sectors 4 & 7 and converted two. On a good game a team would convert 5 or 6 of these; on an average day 4 – so whilst ideally you would like to see some of those shot attempts recycled to more advantageous positions there was no real issue with taking the shot – it was just poor execution.

Shots from deadballs

Player Shots Scores Success Rate Weighting
D McCurry (Tyrone) 4 3 75% -0.579
S Cavanagh (Tyrone) 3 3 100% +0.476
M Penrose (Tyrone) 1 1 100% +0.274
S O’Neill (Tyrone) 1 0 0% -0.391
Joe McMahon (Tyrone) 1 0 0% -0.519
J Doyle (Kildare) 6 4 67% +0.228
S Johnston (Kildare) 1 1 100% +0.274
E O’Flaherty (Kildare) 1 0 0% -0.481
2012 team avgs 6.88 4.6 66.9%  

Tyrone do like to spread the wealth when it comes to shooting from deadballs – I’m not sure we’ll see too many games where five different players get to have an attempt. Séan Cavanagh had a good game whilst McCurry gets hammered on the weightings for his one miss because the three frees he made were so simple he got next to no benefit from them.

Stephen O’Neill didn’t score in this game but his hidden value was instrumental in Tyrone’s win. He won a 45 and four frees from which Tyrone scored on each.

Penalties in GAA are considered easier to convert than soccer so it may be somewhat surprising to see a miss equated with missing a 45. This is due to the fact that we have so few penalties tracked. I made a call to treat penalties as a shot for goal from play rather than as a free – this probably overplays the difficulty of converting a penalty and as such when one is missed the weighting doesn’t truly convey how poor that miss was (conversely if one is successfully converted the player will get too high a weighting).

Kildare’s deadball striking has been a problem for quite a while and again today, excluding the sideline at the end, it was below average.

Seanie Johnston’s sideline at the end of the second half was bizarre. I wasn’t going to put it in as a shot but in the end did – I’m still not convinced I should have! What I found strangest was that he had a practice attempt and landed it basically on the square.

Typical of Kildare’s season that the most egregious shooting error should be one from which they scored!

Shot Charts

You can see the aforementioned three shots from very, very tight angles for Tyrone. As well as that there were few shots from central locations – a curate’s egg of a performance that led to the poor returns.
Kildare’s shooting

Kildare shooting

Tyrone’s shooting

Tyrone shooting

x = missed, disc = score, yellow = deadball, white = play

Kickouts
Kil-Tyr kickouts

Kildare’s kickout returns look healthy however they went short on 8 of their own kickouts. They were quite effective moving the ball from these short kickouts gaining five shots. At times these kickout routines can be fraught, with the odd one going astray, but even if it does you may be better taking that one misplaced attempt on the chin that abandoning the ploy. When Kildare went passed the 45 with their kickout the possession was 50:50 and the volume of shots 4-3 in Kildare’s favour.

Tyrone only went short on one of their kickouts (which didn’t produce a shot). They were much more effective at their mid to long kickouts gaining a shot differential of +4 … overall when the kickout went past the 45 Tyrone won possession on 55% (20 to 16) but managed to get three more shots off ( 11 to 8).

Players with >= 2 shots from play

  Shots Scores Success Rate Weighting
Matthew Donnelly (Tyrone) 5 2 40% +0.103
N Kelly (Kildare) 4 2 50% +0.189
P Cribben (Kildare) 4 1 25% -0.601
J Doyle (Kildare) 3 2 67% 0.868
E O’Flaherty (Kildare) 3 1 33% -0.041
P O’Neill (Kildare) 3 1 33% -0.144
S Cavanagh (Tyrone) 3 1 33% -0.394
Mark Donnelly (Tyrone) 2 1 50% -0.330
S O’Neill (Tyrone) 2 0 0% -0.831

Kildare V Louth 2013

July 19, 2013

Kildare-Louth was not on the TV but Brendan Coffey (@coffeybrendan on Twitter) of the Kildare Nationalist very kindly forwarded the stats from the game. So as a precursor to the Kildare-Tyrone game please find Brendan’s analysis here

Overall

Team Possessions Shots Shot Rate Scores Success Rate
Kildare 49 35 71% 20 57%
Louth 37 28 76% 15 54%
2012 avg 35.28 27.02 76.6% 13.96 51.67%

On the face of it Kildare enjoyed a comfortable win against Louth but just like their previous game against Dublin, the scoreline didn’t reveal how lucky the Lilies were in both games.

In their Leinster semi-final, a 16-point defeat was bad but not as bad as it could have been for Kildare considering the 16 goal chances Dublin had in that game. It was also telling that after taking an early five-point lead, Kildare lost the remaining 60 minutes by 21 points. While Kildare managed to get the right side of the scoreline against Louth, their seven point winning margin did not reflect the difficulties they had for three-quarters of the game.

With ten minutes left the sides were level at 15 points each but Kildare scored an unanswered 1-5 in the final 11 minutes to leave Newbridge with the win. However, take out that final flurry and you see another worrying trend for the Lilies.

For a team that enjoys so much possession in games thanks to a strong midfield and a reliable kickout strategy, Kildare are struggling to make the most of all that ball. Their shot rate against Louth (71%) was well behind their opponents (76%), who had 12 less attacks than Kildare.

Before Kildare went on that free-scoring roll late in the second half, their shot rate was 69%, which was worryingly similar to their shot rate against Dublin, which was also under 70%. To the naked eye, Kildare struggle when they have to recycle the ball up front – unless they get their shot away with the first wave of attackers, they seem unable to unlock the opposition’s defence when the support players come from deep.

With players like Padraig O’Neill and Daryl Flynn in their midfield – both of whom scored long-range points from play against Louth – this shouldn’t be as big a problem as it is for Kildare.
Kildare didn’t have this problem in the league – in the league semi-final against Tyrone they had a shot rate of 85% and it was their inaccuracy that let them down. Similarly when the sides met earlier in the league at Newbridge, Kildare’s attack managed 38 shots – 24 in the second half which included an incredible 17 misses – and lost by six points to a Tyrone team that scored 1-13 from 28 shots.

At the back there are worrying signs too. Dublin’s shot rate was 82 per cent against Kildare while Offaly and Louth had shot rates in the mid-70s. Kildare are giving up too many chances, even against inferior opposition. Against a defence as mean as Donegal’s, Tyrone managed a 78% shot rate so it’s clear they’ll get plenty of chances this weekend

Shots from Play

Team Shots Scores Success Rate
Kildare 27 16 59%
Louth 20 12 60%
2012 team avgs 20.14 9.36 46.5%

Both sides were impressive from play in what was a very open and entertaining game of football. Again Kildare will be concerned about their opponent’s success from play although a lot of that was down to a phenomenal display from Louth’s Ciaran Byrne, who kicked five points from play and was four from four in the first half. A number of those shots were kicked under extreme pressure so the Kildare defence will have escaped censure during their video analysis earlier this week.

(N.B. Byrne’s shooting (5/7 from play) against Kildare will be long forgotten come September but it’s worth noting his performance his as a real highlight of the championship).
Kildare’s Eoghan O’Flaherty is growing in importance to the team. He was one of the few players to come out of the Dublin game with credit and his returns from play this year have been excellent. He kicked four from five against Offaly, two from four against Dublin and three from four against Louth, including a sublime effort off the outside of his right foot on the right wing in the final minute of last Saturday’s qualifier game.

Scoring goals was not a problem for Kildare in the National League but the green flags have dried up in the championship. 12 goals in eight league games was a superb return against Division 1 opposition but they’ve only netted two from their three championship games to date.

Full-forward Tomas O’Connor was a huge factor in a lot of those league goals but after a disappointing performance against Offaly – his two clearcut goal chances were saved – he was dropped for the Dublin game. It’s clear that Kieran McGeeney faces a dilemma with O’Connor – he makes goal chances but misses too many. Brought in as a sub against Louth in the 31st minute, four minutes later he had a shot at goal saved by Shane McCoy.

However O’Connor eventually came good in the 66th minute when he rounded McCoy for his first goal of the championship at the fourth attempt. What was interesting about his goal, as opposed to the other three chances he’s had this year, is that the chance came about by accident rather than design.

Whereas O’Connor was put through on goal by deliberate attacking moves for his first three attempts, his goal resulted from a poor attempt at a point by Alan Smith. Smith’s shot ballooned up into the air and it was O’Connor’s persistence – and considerable frame – that allowed him to gather the ball before using his strength to get past McCoy.

Shots from deadballs

Player Shots Scores Success Rate
J Doyle (Kildare) 2 2 100%
E O’Flaherty (Kildare) 1 0 0%
M Conway (Kildare) 5 2 40%
2012 team avgs 6.88 4.6 66.9%

Free-taking is another concern for Kildare. Mikey Conway was recalled for the Louth game and handed responsibility for deadballs but with just two from five, he was withdrawn after 42 minutes. John Doyle had sole responsibility against Offaly and hit a decent return (4/6) but his form collapsed against Dublin, where he missed one from the 20-metre line in front of the posts, not far from the right-hand upright. He remains Kildare’s best option though and landed a spectacular free from long-range against Louth to begin their late scoring rally.