Posts Tagged ‘Cavan’

Cavan v Tyrone 2016 Ulster

July 7, 2016

For those new to the blog, or who haven’t been here for a while, please find a refresher on the definitions and how the numbers are compiled here

Team Possessions Attacks Shots Scores Exp Pts
Cavan 59 51 38 2 – 17 21.28
Tyrone 54 45 33 5 – 18 22.83

It is not often that we will find a team take five more shots and end up being so comprehensively defeated. This is when context is required to ensure the game flow is taken into account. From the 68th minute onwards, when all intensity had left the game, Cavan scored 1 – 05 from 8 shots with a combined Expt Pts of +4.72.

In the original game the late goal helped Cavan outperform their Expt Pts whilst Tyrone’s shooting saw them return ~3 points below expected. Show the two games back to back and we begin to get a sense of just how much Tyrone dominated – not just in terms of total scores but also in Expt Pts.

140mins Expt Pts

Peter Harte

Harte had a great game scoring 2-04 from just the six shots producing an Expt Pts total of +4.40. Within those scores there was a free on his left, two points from play, with one off either foot, and three goal attempts returning 2-01. He was also on the shoulder form McAlliskey’s 3rd goal so, being unrealistically greedy, as good as his day was it could have been even better.

Still that accuracy was good enough to place his returns 4th overall since 2012 (>100 TV games in that span).

Harte

Cavan’s defending

Tyrone had six goal shots in the replay scoring 5-01. Generally speaking that is unrepeatable however more surprising than this level of accuracy was the fact that the goal attempts did not occur in the first game when they only produced the solitary McNulty attempt. Tyrone ran down the throat of Cavan but this “soft” center was identified in the Armagh game where on more than one occasion there were Armagh men standing on their own centrally in front of goal.

Tyrone’s Deadballs

There has been some commentary on how poor Tyrone’s free taking has been. Over the three games in this year’s Championship (the two against Cavan & Derry) they returned 0 – 10 from 18 deadballs with a combined Expt Pts of -3.67. We have 3 games from their 2015 run (the Ulster game against Donegal, the QF & SF from Croke Park) where they returned 1-13 from 21 attempts with a combined Expt Pts of +0.11

Their 2016 deadball performance has indeed been very poor but do we base our view on the most recent returns or smooth it out over time? Is the 2016 form natural variance due to small sample size or the manifestation of something more serious? Only time will categorically answer that one however it is fair to say that at best their deadball striking reaches average whilst on current form it is very poor.

dEADBALLS

Tyrone have used six different players to take deadballs in that six game span. Evidence would suggest that this chopping and changing is as a result of not having any great free taker – as opposed to the poor returns being as a result of the chopping and changing – however I am not sure why Séan Cavanagh was taken off the frees. Granted we do not have the games from their qualifier run last year however he was three form three against Donegal up in Ballybofey and hasn’t taken one in the five games since. It is worth remembering that he was 67% (16 of 24) with an Expt Pts tally of -0.04 during 2013 & 2014. Average yes but looking at Tyrone’s returns of late they would take average.

Cavan v Armagh 2016 Ulster

May 31, 2016

For those new to the blog, or who haven’t been here for a while, please find a refresher on the definitions and how the numbers are compiled here

Team Possessions Attacks Shots Scores Exp Pts
Cavan 43 36 30 2 – 16 18.30
Armagh 45 36 28 0 – 14 16.93

Possessions, attacks, shots & Expt Pts were all very similar yet Cavan had this game wrapped up in the 57th minute when Campbell’s penalty was saved and Séanie Johnston scored on the subsequent possession. How so?

Armagh’s shooting

The first port of call is Armagh’s relative under performance on the scoreboard. They left the guts of 1-01 behind them when Campbell missed a 13m free in the first half and that penalty in the second. The chances of scoring 0 – 00 from those two shots is ~0.3%. 0.3%!!

Of course this means that excluding these two misses (I know you can’t but bear with me!) Armagh’s shooting was satisfactory. From the remaining 26 shots Armagh had an Expt Pts return of 13.47; they scored 0-14. Their deadball striking was very good (once we have removed the missed 13m free!) with 9 shots producing a score of 0 – 08 off an Expt Pts tally of 6.59. From play their returns were 0 – 06 scored from 16 shots (Expt Pts of 6.88).

Therein lies the real problem. Although Armagh had 16 shots from play they were, in the main, long range efforts. Something very similar occurred in last week’s game between Derry and Tyrone. Armagh had little or no penetration and thus momentum was difficult to (a) build or (b) maintain. They would get within touching distance of Cavan but fall away again as the shot selection was too difficult. As an illustration below is Armagh’s 1st half shooting from play

Armagh from play 1st half

You couldn’t have a cleaner, more impressive chart if you were Cavan. Armagh just could not get inside at all. That changed to some degree in the second half but the damage was done – they were chasing the game with absolutely no goal threat (indeed outside the penalty Armagh didn’t have a goal attempt all game).

Cavan

Cavan had two goal chances and converted both. Their point taking was also very efficient. From play they were 0 – 11 from 21 shots (Expt Pts of 9.66) whilst also returning 0 – 05 from deadballs (7 shots; Expt Pts 4.97). A repeatable performance? There was nothing to suggest otherwise. There was no real shot concentration in any one area, no over reliance on frees whilst the conversion rate for shots taken under pressure at 60% (6 from 10) was better than those taken without any pressure applied – 45% (5 from 11).

It was a good performance but what caught the eye more, looking ahead to Tyrone, was what Cavan did, or more accurately did not do, from a defensive perspective. Yes they protected the D but there was a vulnerability down the centre.

PhotoGrid_1464728078857


PhotoGrid_1464728222262

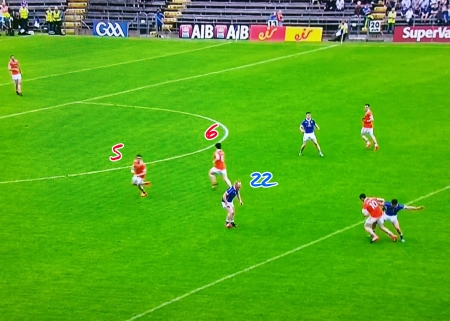
Above are two instances where Armagh have an overlap straight through the heart of the Cavan defence. In the first Mackey (22) is drawn towards Grugan (10) leaving both Mallon (5) and Forker (6) completely isolated at the top of the D. In the second Campbell shoots but if he slips the ball inside McKenna (21) is standing all on his own at the top of the large rectangle. Snapshots to be sure – and any team can look exposed with an instantaneous snapshot – but these were not the only examples. Twice Armagh won easy frees in the first half when running straight through the middle. Given Tyrone’s style I can see Donnelly, Harte et al looking to drive through the 45 the next day.

Kickouts

One topic that generated a lot of discussion was Armagh’s kickout strategy. A lot was made of the late switch in the Armagh goalkeeper and the impact this had on the outcome. Firstly Armagh “won” 83% of their own kickouts. This however included 20 that went short (or appeared to go short*); strip these out and Cavan edged the Armagh kickouts 5-4. This is by no mean disastrous nor even out of kilter with the norm.

Armagh scored 0 – 07 from the possessions they obtained from their own kickout and coughed up 0 – 03. That 0 – 03 is generally fine but appeared to be much more as the game was progressing as a result of (a) two quick back to back Cavan points in the first half giving the impression of a large scale issue and (b) the commentators continually referencing Armagh’s kickout problems**.

It wasn’t their own kickout that was the problem. It was Cavan’s. Cavan had 17 kickouts and only one of these went short – an unusual stat in and of itself. Of the remaining 16 Armagh only “won” two. Considering all 16 were contestable – landing outside the 45 – this is a very poor return. Whereas Armagh had a net result of 0 – 04 on their own kickouts (0-07 scored versus 0 – 03 conceded directly from the kickout) Cavan had a very comfortable net return of 1-05 in their favour on their own kickouts.

Armagh had a fairly average day on their own kickouts – nothing destructive. Cavan however had a day of days on theirs.

Campbell

A quick note on Campbell. He had 14 shots in total with an Expected Return of 10.13 and the return of 0 – 08 shows an absolute mixed bag. His day will be remember for the penalty & missed 13m free however outside of those he was excellent converting 67% (8 from 12) and scoring +1.33 above Expected.
14 shots is the joint highest recorded by any one player in a Championship game***. The others to reach 14 were Séan Quigley against Laois in 2014, Martin Dunne for Cavan against Armagh in 2013 and Conor McManus in Monaghan’s defeat to Dublin in 2014.

Appendix

Shot Charts

Cavan’s shooting
Cavan shooting (V Armagh 16)

Armagh’s shooting
Armagh shooting (V Cavan 16)
x = missed, disc = score, yellow = deadball, black = 1st half from play, white = 2nd half, red = goal attempt


*You can always tell when RTE are not in control of the production. You will rarely miss anything in a game when they are in charge – here there were numerous kickouts not shown. I counted nine in total. Normally this isn’t really an issue as the camera will catch where the ball lands, or we’ll return to the game with a back advancing after obviously taking a short kickout. Here though we missed complete possessions! Where there were gaps in the game a level of judgement had to be overlaid on the data.

** as an aside one of the best pieces of advice I was given was to watch the game with the sound off. This emanated from amateur boxing where you begin to focus on the footwork rather than the punches the commentator calls. Similarly in horse racing your eyes get drawn to places other than the front of the race. If you are interested in analysis record the next GAA game and watch without the commentary on. As the game progresses pick 3 or 4 things you notice that teams/players are doing and which you feel are important. Watch the game back and listen to the commentary. Are your items picked up? Are they emphasised? Does the newspaper and forum chatter revolve around what you saw or what the commentary told the audience to see? This is not a go at commentators – theirs is a very hard job (to do well). But what they observe live can set an agenda that has nothing to do with what won/lost the game.

*** ~95% of TV games from 2012 – 2016 included. There will be instances where players have taken more than 14 shots but they will have been in non TV games

Cavan V Monaghan 2015 Ulster Championship

May 25, 2015

For those new to the blog, or who haven’t been here for a while, please find a refresher on the definitions and how the numbers are compiled here

Overall

Team Possessions Attacks Attack % Shots Shot % Scores Success % Weighting
Cavan 49 34 69% 25 74% 15 60% +0.741
Monaghan 43 35 81% 24 69% 16 67% +2.306
Avg 37.0 28.7 77.7% 14.7 51.2%

Cavan had every opportunity to take this game. They had more six more possessions and one more shot than Monaghan. Their shooting didn’t let them down as it was above average – it was just that Monaghan’s shooting was deadly accurate. Especially from frees.

Indeed if we just look at the expected return from the shots that both teams attempted, and run 20,000 simulations of same, Cavan win the game 45% of the time with Monaghan 43% and a draw 12%.

Cav - Mon outcomesv3

That first line “six more possessions and one more shot” does indicate that Cavan had problems converting primary ball into an attack (and a subsequent shot). Converting 69% of your ball into an attack (possession inside the opposition’s 45) is low. This is due in the main to the way that Cavan played launching long balls in to Argue.

In and of itself that is fine but it does mean you have to maximise your opportunities (as there will generally be less of them). And get a goal. Cavan didn’t manage one attempt on goal. There were instances where a break could have fallen their way but that’s the gamble you take with the long ball strategy.

Monaghan? On the whole they’ll be pleased. They went away from home and came away with a win. Job done. Move on. But their reliance on deadballs, and specific individuals, hasn’t moved on from the last two years. Remember how Dublin attacked them down the left when Walshe went off in last year’s QF? If a team is disciplined can they manufacture the chances from play? Can they chase a game with no great goal threat?

Shots from Play

Team Shots Scores Success % Weighting
Cavan 15 8 53% +0.471
Monaghan 13 7 54% +1.056
Avgs 21.4 9.7 45.3%

Monaghan’s accuracy was very good but their volume of shots from play would be a worry. Yes this was in part due to Cavan fouling however they only managed three shots from play in the first half and all from the top left (see shot chart below). That’s very poor.

They managed a much healthier ten shots in the second half and converted some absolute stunners (Dessie Mone hanging one on the wind from the left and McManus from a tight angle top of the right being another) but their lack of firepower (McManus aside) can be exploited if a defence is disciplined.

Monaghan only managed one shot on goal – Hughes’ pile driver over the bar – which is a recurrent theme. In their five Championship games last year they managed eight attempts at goal with two of those being long range shots from outside the 20m line. I took two snapshots when the camera panned back showing the huge open spaces in front of the opposition’s goal – it’s no wonder they are not prolific on the goal front!

PhotoGrid_1432493662612

Shots from deadballs

Player Shots Scores Success % Weighting
C McManus (Monaghan) 5 5 100% +1.448
N McDermott (Cavan) 4 4 100% +0.885
P Finlay (Monaghan) 3 3 100% +0.291
R Galligan (Cavan) 3 1 33% -0.442
R Beggan (Monaghan) 2 0 0% -0.669
K Hughes (Monaghan) 1 1 100% +0.180
M Dunne (Cavan) 1 1 100% +0.163
C Mackay (Cavan) 1 1 100% +0.064
M Reilly (Cavan) 1 0 0% -0.400
team avgs 7.2 4.9 68.7%

21 shots from deadballs is a lot. It places this game second only to the Meath – Tyrone game in 2013 which had a combined 23.

McManus (5 from 5) and McDermott (4 from 4) were the main protagonists converting all of their attempts however the weighting shows that McManus’s conversions were of the more difficult type.

During the off season we showed that McManus’s conversion rate was second only to Cillian O’Connor over the previous three years. It would appear he will challenge O’Connor for the top marksman accolades this year – his free from the left on the 20m line in the second half was a peach – as was Kieran Hughes’ from the right. With McManus, Hughes, Finlay & Beggan Monaghan have a lethal deadball arsenal.

There has been much commentary about Galligan’s two misses at the end however we forget the one he converted in the first half. Of the three kicks he would only be expected to convert more than one a little over half (~52%) the time. The misses were magnified by the timing and the game state. Indeed Rory Beggan missed both his long range efforts. His misses won’t come under the same level of scrutiny as Galligan’s however when viewed over the entirety of the game they were every bit as important, and of a similar ilk, to the two that Galligan missed.

Kickouts

Cavan’s kickouts Won % Turned into an attack % Shot %
Cavan 18 86% 14 78% 9 50%
Monaghan 3 14% 3 100% 3 100%
Monaghan’s kickouts Won % Turned into an attack % Shot %
Cavan 7 29% 6 86% 3 43%
Monaghan 17 71% 15 88% 9 53%

A word of warning when reviewing these. A lot of the immediate kickout aftermath – where the ball was aimed, who won it and how etc. was missed by the TV coverage. Not too sure why this may be – there were various lingering shots of players leaving the field and entering the subs bench when the game was progressing!

Shot Charts

Cavan’s shooting
Cavan shooting (V Monaghan)

Monaghan’s shooting
Monaghan shooting (V Cavan)

x = missed, disc = score, yellow = deadball, black = 1st half from play, white = 2nd half from play,

Players with >= 3 shots from play

Shots Scores Success % Weighting
C McManus (Monaghan) 3 2 67% +0.737
G McKiernan (Monaghan) 3 2 67% +0.479
M Argue (Cavan) 3 2 67% +0.114

Cavan V Kerry 2013

August 7, 2013

For those new to the blog, or who haven’t been here for a while, please find a refresher on the definitions and how the numbers are compiled here

Overall

Team Possessions Shots Shot Rate Scores Success Rate Weighting
Cavan 33 24 73% 9 38% -2.893
Kerry 37 26 70% 15 58% +0.9985
2012 avg 35.28 27.02 76.6% 13.96 51.67%

Excellent accuracy from Kerry converting 58% of their shots however there was a real divide in their shooting from play (39%) and their deadball shooting (100%). Their Shot Rate was low, which may be in part due to a lacklustre second half (it was 89% in the Munster final), but if it were to be repeated against Dublin it would put huge pressure on the accuracy as they attempt to keep pace.

Cavan’s shooting was poor but not as poor as the weighting would suggest. They got penalised very harshly for Mackey’s attempted blast with the last kick of the ball but still they had the chances to put Kerry under more pressure than they did.

The difference can be summed up in a cameo between Buckley & Reilly. Buckley had two 45s and a free in quick succession in the first half – he slotted all three enabling Kerry to build a lead. Reilly similarly had a long-range free and two 45s in quick succession in the second half as Cavan chased the lead. He converted one.

Shots from Play

Team Shots Scores Success Rate Weighting
Cavan 15 4 27% -1.828
Kerry 18 7 39% -1.492
2012 team avgs 20.14 9.36 46.5%

Pretty poor returns all round.

Of the 18 shots that Kerry took Walsh accounted for six of them. That left 12 further shots spread out amongst ten different players. The five remaining forwards had combined returns of three from seven (Conversion Rate 43%; weighting -0.4805) … given the expected volume of shots that Dublin will bring Kerry will either need to up how many shots their marquee forwards take or their accuracy is going to have to increase greatly.

Although Cavan had enough shots to be closer to Kerry their two main men, Dunne & Keating, only had four shots with Dunne converting one.

Whilst Kerry went on their nine point unanswered run in the first half they took 14 shots compared to Cavan’s two. Cavan were simply over run for that period and were never able to adequately make up the deficit despite their resurgence in the second half. As an aside Kerry did something similar to Cork towards the end of the first half in the Munster final; they led the shot count 11-2 for the last 15 minutes of that half.

Shots from deadballs

Player Shots Scores Success Rate Weighting
C Cooper (Kerry) 5 5 100% +0.972
J Buckley (Kerry) 3 3 100% +1.518
E Keating (Cavan) 3 2 67% +0.05
M Reilly (Cavan) 3 1 33% -0.499
N McDermott (Cavan) 2 2 100% +0.330
C Mackey (Cavan) 1 0 0% -0.944
2012 team avgs 6.88 4.6 66.9%

In the 2012 Championship, and the 2013 League Kerry had problems from deadballs

Shots Scores Success Rate Weighting
’12 Champ 29 17 59% -4.76
’13 League 21 12 57% -3.708

In the last two games those problems have disappeared with Kerry converting 8 from 8 in this game and 7 from 8 in the Munster Final (combined conversion rate of 93%). Part of this is sample size, part is the natural ebb and flow of form but perhaps in this case part can also be attributed to a change in kicker. Whilst only one game Buckley’s long range performance was, much like Cluxton for Dublin, the pillar on which Kerry’s early lead was built upon.

If we excuse Mackey’s blast at goal towards the end then Cavan’s shooting from frees & 45s was average.

Shot Charts
Cavan’s shooting

Cavan shooting

Kerry’s shooting

Kerry shooting

x = missed, disc = score, yellow = deadball, white = play

Kickouts
Cavan-Kerry kickouts

Kerry fairly well lorded their own kickouts winning possession from 90% of them. They went short on 55% (11 of 20), securing all of them, however won the possession battle 7-2 when they went past the 45m line as well. They got a shot off from 45% (5/11) of their short kickouts and 43% (3/7) of the long to medium kickouts they won.

Although there was not much difference in returns mixing up the kickouts does ensure that Dublin cannot key on any one facet. Against Cork Kerry only went short once out of 24 … by varying the tactic in this game it gives Dublin something extra to think about.

Cavan went short on 54% (13 of 24) of their kickouts. The messed up the first one but got a shot off on seven of the remainder. When Cavan went long they actually lost the possession battle 4-7 giving Kerry four shots and only managing one themselves.

Players with >= 2 shots from play

Shots Scores Success Rate Weighting
D Walsh (Kerry) 6 3 50% +0.089
E Keating (Cavan) 3 0 0% -1.175
D Givney (Cavan) 2 1 50% +0.185
N McDermott (Cavan) 2 1 50% +0.185
Declan O’Sullivan (Kerry) 2 1 50% -0.093
Darran O’Sullivan (Kerry) 2 0 0% -0.761

Cavan V Monaghan 2013

July 4, 2013

For those new to the blog, or who haven’t been here for a while, please find a refresher on the definitions and how the numbers are compiled here

Overall

Team Possessions Shots Shot Rate Scores Success Rate Weighting
Cavan 32 24 75% 12 50% -1.017
Monaghan 33 28 85% 11 39% -2.394
2012 avg 35.28 27.02 76.6% 13.96 51.67%

There are two ways of looking at this from a Monaghan perspective. The positive slant is that they were very good at converting possession to shots , which they will need to be against Donegal, and they won a tight game whilst shooting poorly. There is room for improvement.

On the other hand their Success Rate was poor and without McManus it was *very* poor (26% Success Rate with a weighting of -3.716).

Cavan were a tad below average on all metrics but had quite a negative weighting given this. This is indicative of the fact that the majority of the scores they did get were in the ‘easier’ category .

Shots from Play

Team Shots Scores Success Rate Weighting
Cavan 17 7 41% -0.757
Monaghan 18 6 33% -1.079
2012 team avgs 20.14 9.36 46.5%

Pretty poor returns for both teams. McManus stood out (3 from 5 shots with a weighting of +1.170) for Monaghan as did Keating, though for opposite reasons, for Cavan.

Towards the end of the game, whilst trailing by just the one point, Keating took two shots centrally from outside the 45m. Keating has the skill set to do this as his returns against Donegal (here) last year showed however in this instance he may have been better served following Cavan’s pattern earlier in the game of recycling the ball looking for a better shot.

Shots from deadballs

Player Shots Scores Success Rate Weighting
C McManus (Monaghan) 4 3 75% +0.152
P Finlay (Monaghan) 3 2 67% -0.119
R Beggan (Monaghan) 2 0 0% -0.8
K Hughes (Monaghan) 1 0 0% -0.548
M Dunne (Cavan) 4 2 50% -1.07
N McDermott (Cavan) 2 2 100% +0.310
C Gilsenan (Cavan) 1 1 100% +0.5
2012 team avgs 6.88 4.6 66.9%

Up until the 30th minute both defences had shown considerable discipline in the tackle, in their own half, allowing only two shots from frees. Things kind of went downhill for the remaining 40 minutes with a further 14 shots at goal emanating from frees. The volume was undoubtedly enhanced by both teams calling on their goalkeepers to take long-range attempts but neither team will want to replicate this again this season. Especially Monaghan against the deadly duo of Murphy & McFadden.

Dunne’s returns are hit by the curse of the sideline again. Just to recap we do not have enough sideline attempts charted to give them a separate weighting therefore they are counted as being frees. A bit harsh on Dunne to call his sideline a “missed free from inside the 21m” but that’s what it currently is.

Shot Charts
Cavan’s shooting

Cavan Shooting

Monaghan’s shooting

Monaghan shooting

x = missed, disc = score, yellow = deadball, white = play

Kickouts
Cavan-Monaghan kickouts

An “old fashioned” kickout battle as only 4 out of the 42 kickouts charted were kicked short. Perhaps the early goal that emanated from a short kickout gone awry had an impact on this.

Cavan had the better of the kickout exchanges winning more and converting more of those wins to possessions. What was more remarkable was that 8 of their 13 points came directly from kickout possessions. They scored a point on a 3rd of kickouts won; conversely Monaghan only scored on 17% ( three from 18) of the possessions they won from kickouts. They did of course score their goal.

Players with >= 2 shots from play

Shots Scores Success Rate Weighting
C McManus (Monaghan) 5 3 60% +1.170
E Keating (Cavan) 5 1 20% -1.167
D Givney (Cavan) 3 2 67% +0.536
K Hughes (Monaghan) 3 1 33% -0.155
C McGuinness (Monaghan) 3 1 33% -0.162
C Mackey (Cavan) 3 1 33% -0.289
T Freeman (Monaghan) 3 0 0% -1.149
D Hughes (Monaghan) 2 1 50% +0.079
M Dunne (Cavan) 2 1 50% -0.103
D O’Reilly (Cavan) 2 0 0% -0.986

Cavan V Armagh 2013

May 23, 2013

For those new to the blog, or who haven’t been here for a while, please find a refresher on the definitions and how the numbers are compiled here

Overall

Team Possessions Shots Shot Rate Scores Success Rate Weighting
Cavan 34 32 94% 16 50% -0.3958
Armagh 40 29 73% 12 41% -2.167
2012 avg 35.28 27.02 76.6% 13.96 51.67%

What has been a recurring theme in the commentary on this game, and will be laced throughout this piece, is Armagh’s defensive tactics. The effect of this can be seen in a number of areas and none more so than in Cavan’s 94% shot rate.

In all bar two occasions when Cavan got the ball into Armagh’s 45 they got a shot off. This is phenomenal and an indicator of the lack of pressure the Cavan forwards were under. They were rarely tackled by multiple defenders nor forced to spray the ball back and forth across the line looking for a gap. Armagh left lots of space; the ball was played into it, gathered and a shot taken. Cavan’s slightly below average weighting shows that, Dunne apart, their execution left a lot to be desired.

Armagh did have their chances, with above average possession and shots, but their execution let them down.

Shots from play

Team Shots Scores Success Rate Weighting
Cavan 27 14 52% +0.9291
Armagh 23 7 30% -2.033
2012 avg 20.14 9.36 46.47%

Dunne and Keating had 19 shots from play between them scoring 10 points. Dunne was a lot more efficient (73% Success Rate (8/11) & Weighting of +2.41) than Keating (25% (2/8) weighting of -1.87) however the supply to both really had to be shut down.

Armagh’s shooting from play was very poor. Cavan marked Clarke out of it ensuring he only had one effort, apart from the ghost goal, which was knocked out of his hands. Unfortunately for Armagh none of his teammates stood up to take his place

Shots from deadballs

Player Shots Scores Success Rate Weighting
M Dunne (Cavan) 3 1 33% -0.961
N McDermott (Cavan) 1 1 100% +0.159
C Gilsenan (Cavan) 1 0 0% -0.519
S Forker (Armagh) 3 2 67% -0.611
A Kernan (Armagh) 2 2 100% +0.310
T Kernan (Armagh) 1 1 100% +0.167
2012 team avgs 6.88 4.6 66.9%

Apart from Tony Kernan’s wonderful sideline point there was nothing of note here – except perhaps Dunne missing two very easy frees in the first half.

Shot charts
Look at how close to goal all of Cavan’s shots are. Armagh’s man marking ensured that there was no “press” on the ball – Cavan could just get the ball in, turn and shoot.

Armagh, for all their failings, got the ball into the right area. They missed 6 shots from play from in and around Sector 5 – take the average from this sector and they are right there.

It is quite instructive to compare the two shot charts here with Mayo’s against Galway (here) and compare the accuracy from in front of the posts.

Cavan’s shooting

Cavan shooting

Armagh’s shooting

Armagh shooting

x = missed, disc = score, red = free/sideline, white = play, yellow = 45

Kickouts

Cavan-Armagh kickouts

Armagh had a +9 differential on winning kickouts but only turned this into a +3 differential in terms of shots. This was due, in the main, to Cavan’s excellent shot rate – every kickout they turned into a possession also became a shot.

Although on the surface a -3 differential on shots from kickouts won is not a bad days work this will be an area of concern for Cavan. They will surely not meet a defence as accommodating again. If they continue to win just 40% of kickouts we can expect the conversion to possessions, and then shots, to drop. Were this to happen it would provide a huge platform for their opponents.

Players with >= 2 shots from play
Eugene Keating had a bad day but he was stellar against Donegal last year (here). I think it is safe to assume that both he and Dunne will regress to the mean – if this does happen then Cavan will be looking for more production from the rest of the team.

Shots Scores Success Rate Weighting
M Dunne (Cavan) 11 8 73% +2.407
E Keating (Cavan) 8 2 25% -1.869
S Forker (Armagh) 4 2 50% +0.606
T Kernan (Armagh) 4 1 25% -0.358
E Rafferty (Armagh) 3 1 33% -0.135
M Shields (Armagh) 3 1 33% -0.177
N McDermott (Cavan) 3 1 33% -0.382
C Rafferty (Armagh) 2 1 50% +0.215
K Dyas (Armagh) 2 0 0% -0.926

Cavan Vs Donegal

May 21, 2012

So finally to some game data.

Team Possessions Shots Shot Rate Scores Success Rate
Donegal 39 28 72% 17 61%
Cavan 41 26 63% 11 42%
avg 41.8 28.3 67.7% 14.1 49.8%

Nothing earth shattering there. The game was average in terms of the number of possessions both sides had but Donegal were better at converting the possession to shots and were also better in terms of accuracy. If we were able to make adjustments based on the team you were facing then maybe Cavan’s bare stats would look better (in that Donegal are generally accepted as being one of the better defensive teams) but we have to attribute their below par shot rate & success rate to Donegal’s ability to harry & hassle them once they entered the 45m zone.

The next two tables break the shots down by deadballs (45s, frees, penalties & sideline) & shots from play. We also introduce a new metric “Vs Expected”. This will be a blog entry on its own, expanding on how it is created, however essentially a return of 0.00 = exactly average or “as expected”. The more positive the return the better a team or player’s shooting was – the more negative the worse it was.

From play

Team Shots Scores Success Rate Vs Expected
Donegal 20 11 55% +3.32
Cavan 22 9 41% +0.28
avg 21.1 9.3 44.0% 0.00

From deadballs

Team Shots Scores Success Rate Vs Expected
Donegal 8 6 75% +1.44
Cavan 4 2 50% -0.94
avg 7.3 4.8 66.5% 0.00

We associate blanket defence, and honesty of effort, with Donegal but against Kildare last year they showed that they could take some booming scores. Similarly against Cavan their shooting from play was well above average. McFadden scored the penalty and the 5 frees he took a shot from but missed the two 45s he had – in tight games they will need those and his deadball performance was hindered by this.

Cavan were essentially average (apart from Keating – see below) from play whilst their free taking was quite poor. Both McKiernan & Keating missed frees from inside the 45m.

Donegal had 13 different players take a shot from play whilst Cavan had 9 – this means that Cavan had 4 players take 3 or more shots to Donegal’s 1. These players are represented below however seeing as Donegal march on we must take note of McHugh (Vs Expected +1.22) & McLoone (+1.02) who scored with both their shots. McBrearty (-0.71) missed with both his.

Players with >= 3 shots from play

Shots Scores Success Rate Vs Expected
Keating (Cavan) 6 5 83% +2.69
Fitzpatrick (Cavan) 4 0 0% -0.60
Kavanagh (Donegal) 3 3 100% +1.55
Givney (Cavan) 3 2 670% +0.85
McKiernan (Cavan) 3 1 33% -0.35