2023 Club SF Preview; Glen vs Kilmacud Crokes

January 4, 2024

• Can Glen profit from the big chances they create through their kicking game?
• Will Kilmacud’s shot execution be better? And will Walsh & Mannion be as subdued (from play) as in the 2022 final?
• Bench impact
• Kickouts; will both teams go long against the press? And can either middle third gain an advantage.

Ignoring the 16th man controversy, the closeness of last year’s final, where Conor Ferris produced a truly magnificent reactionary save to deny Conor Glass in the second minute of injury time, will have had both teams poring over the video during the Christmas break looking for that slight edge. Is there anything we can see in that game that will guide us to what both teams will focus on?

Styles of play

Glen
The final in 2022 was the classic clash of styles. Glen, the counter puncher, bookending Danny Tallon’s goal off their first possession with the save from Conor Ferris in the 62nd minute. They had two other clear-cut attempts at goal in between – Stevie O’Hara tripping on his left whilst through one on one and Conleth McGuckian with that infamous scramble against the sixteen men.


Glen were much more willing to use the attacking kick – letting the ball go into one-on-one contests much more frequently. 69% (22 of 32) of their possessions included what was marked as an attacking kick pass.

Those twenty-two possessions led to ten shots, four of which were the goal attempts. When they produced the attacking kick it was all in. Nine of those possessions only had one or two players control the ball. Twenty of the twenty-two had less than ten players control the ball.


Glen got the ball, looked up, tried to deliver a kick pass and when delivered committed to the fast strike.

This ethos has survived through 2023. Combining their Ulster final and semi-finals, against Scotstown and Naomh Conaill respectively, 55 % (39 of 70) of their possessions contained an attacking kick pass. This may be down on the 2022 final however that reduction, and the fact that they have not really threatened the goal in those two games (one attempt across the two games), can be attributed to both the weather and the defensive set ups they faced. The opposition combined for just a 42% attacking kick rate (31 of their 74 possessions contained an attacking kick pass) in those same games. Glen are still looking to strike faster than their opponents.

This style of play is fast, exciting and should produce excellent opportunities for their attackers to have a go in one-on-one situations. Against Moycullen in the 2022 AI semi final they produced two goal opportunities – one direct from a throw when the teams are lined up man on man.


What this high variance style can lead to are long spells without the ball and without a score. It is the ultimate balancing act for fast transitional attack teams. If you have four possessions, where you lose three one-on-ones due to variance and do not manage a shot from the one you do win, you can go ten minutes without scoring and can invite pressure if the opposition produces shots and then pushes up on your kickout winning one or two of those.


In last year’s final Glen did not have a shot in the first half from the 14th minute. Never mind a score – they did not have a shot. Similarly, after Stevie O’Hara’s missed goal attempt in the 48th minute the only shots they produced thereafter were the two goal attempts in injury time. It is to their absolute credit that they had the mental strength to overcome those barren patches, but you feel it is something they will have to address on Sunday.


(Against Naomh Conaill they used their kick passing differently claiming five Marks as the defence dropped. Unfortunately, they missed the last four. And missed the one they attempted in the final against Scotstown. Not sure we will see them revert to this ploy against Kilmacud!)

Kilmacud

If Glen are the counter puncher, then Kilmacud assume the orthodox stance controlling the centre of the ring and continually scoring with percentage attempts.


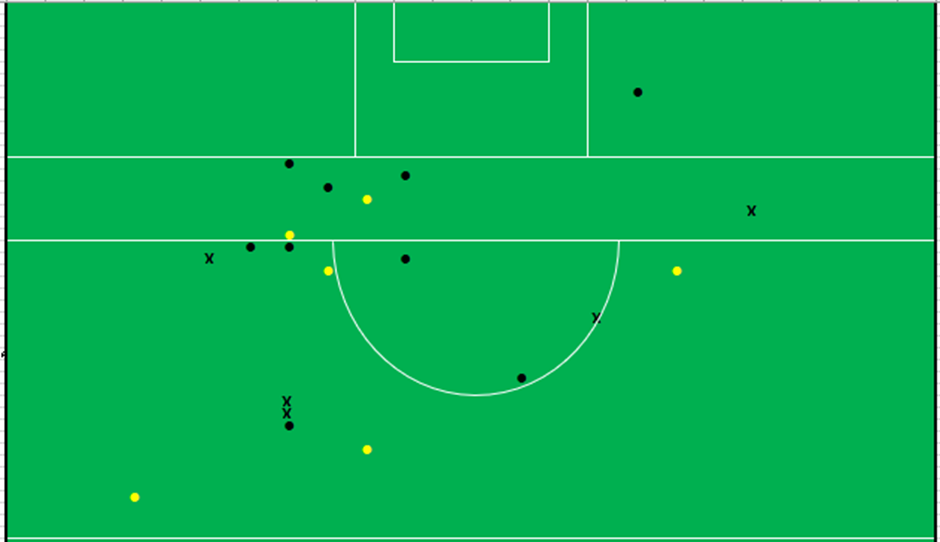
47 minutes into last year’s final Glen were leading 1-09 to 1-07 but the shot count was 21-14 in Kilmacud’s favour. The shot chart, below, to that point was fine and tidy; nothing wild. It was the execution that let Kilmacud down including two missed attempts from Paul Mannion and a missed free apiece for Mannion and Shane Walsh. Kilmacud should really have been at least level at that stage.

(As a side note Glen restricted Walsh to just one point attempt from play and two primary assists. He was good on deadballs scoring 1-03 from five attempts keeping the scoreboard ticking over but noticeably quiet otherwise. Mannion was also quiet scoring 0-01 from three frees and missing his only attempt from play. Outside the final free from the sideline, he was primary assist on only one other shot)

The game ended with Kilmacud producing 27 shots to Glen’s 14. Again, until the goal scramble in injury time this was 27 – 12.


How they produced double the volume of shots was through controlling the ball. They had 35 team possessions to Glen’s 32 but had 99 possessions inside Glen’s 45 (Glen = 59) and 14 inside the 21 (Glen = 11). They continually recycle until the correct opportunity presents itself.


That is what made the Conversion Rate of 44% in the final so noteworthy. Kilmacud are a control team. Process driven. Correct shots at the correct time with the correct outcome. The final component malfunctioned last year.


Glen cannot rely on that malfunction this Sunday, however. Against Naas in the Leinster Final Kilmacud’s shooting was back on point. Again, the control was there; 97 player possessions inside Naas’ 45 from 35 team possessions. Twenty shots this time but the Conversion rate was 75%

One other noteworthy point from watching the game back was the impact of Kilmacud’s bench. They introduced Cian O’Connor in the 46th minute and Shane Horan in the 50th. Combined they were involved in all of Kilmacud’s final six shots – taking two scoring 0-01, winning two frees that were converted by Walsh, winning a Glen kickout that led to another free and being involved in the build up to Mullin’s point in the 48th minute.


For Glen they had O’Hara’s one on one but nothing outside of that.

Kickouts

The Battle of the presses. Thirty kickouts in last year’s final with eight going short, four just over the 45 and the remaining eighteen going long. Of the eighteen that went long possession broke down evenly – nine apiece. You might think that the kickout team would control those longer kickouts as they know where the ball is going etc. however both teams were better at claiming the opposition’s kickout on those longer ones. Twelve of the eighteen long kickouts were lost by the kickout team.

Part of this may be the length of both keeper’s kickout, as neither were able to get beyond the opposition 65 but is more probably a reflection of both team’s midfield. The Kilmacud keeper has changed this year, with David Higgins replacing Conor Ferris, but against Naas there was no evidence of any extra length. That is heavily caveated however as very few of the kickouts against Naas went past the 45.


This is one of those hidden advantages to Kilmacud’s positive shot count. More shots = more opposition kickouts. You get to decide if you press of drop. If you press you can compress the landing zone due to the lack of length. Kilmacud get to do what they love best. Control the tempo.

Glen v Errigal Ciaran 2022 Ulster Club QF

November 17, 2022

A brilliant game with numerous talking points. From a pure numbers perspective Glen had 23 shots producing 13 scores and 0.44 points per possession (ppp). Errigal Ciaran had 22 shots producing 13 scores and 0.41 ppp. Those numbers do not, generally, lead to a four-point win unless one of the oldest maxims in the game comes to the forefront – goals win games.

Glen had four attempts on goal scoring 2 – 01 whilst also converting two (poor?) dropping shots into 1 – 01. Errigal Ciaran had two shots at goal scoring one and hammering the crossbar with the other. To rub salt into the goal attempt wound the follow up scramble, after the ball hit the crossbar, saw a palmed goal ruled out for a square ball.

There were two main areas where the teams differed – kickouts and the spread of shooters.

Kickouts

Glen won the kickout possession battle 24 – 15. When the ball travelled past the 45 (“mid” and “long” combined) they won the possession battle 14 – 10. Included in this were four of five Errigal kickouts in their dominant 10 minutes just after half time.

Winning the Errigal kickout was huge for Glen. All eight won outside Errigal’s 45 (“mid”/ ”long”) were turned into a shot with six of the eight being quick strikes where only four players controlled the ball prior to the shot. Win and punish.

Errigal not pushing up hard on the Glen kickout worked out. Unlike when they won an Errigal kickout Glen only progressed five of their own nine short ones to an attack (controlling the ball inside Errigal’s 45) with just the two shots.

Looking forward I thought that this might be a form of weakness. Glen had 23 possessions starting inside their own 45 (own short kickouts and turnovers picked up inside the 45) producing eight shots. A shot every 2.33 possessions. Elsewhere they got a shot off every 1.42 possessions. Did they struggle to create shots against set defences?

Not really. In their Ulster QF & SF vs Scotstown & Kilcoo in the 2021 campaign they produced a shot every 1.86 possessions (starting inside the 45) and 1.35 elsewhere. The 2022 average to date is a shot every 2.07 possessions for balls collected inside your own 45 and 1.58 for everything else. 

This was just variance.

Spread of shooters

Glen had ten different players attempt a shot with no one attempting more than four. They also had an impact off the bench with their two main subs (McGonigle came on for just two minutes at the death) getting 0 – 02 from three shots in a combined 50 minutes on the pitch

Errigal Ciaran, on the other hand, just had the five players attempt a shot with the three Canavans combining for 18 shots and 1 – 09. Their three main subs had a combined 55 minutes on the pitch producing just the one primary assist.

All Ireland club final (Kilcoo v Kilmacud) Preview

February 10, 2022

Keys to the game

  • Can Kilcoo break down that Kilmacud defence? Conversely can Kilmacud stay in their shape for ~65minutes and not fall victim to a late goal?
  • If forced out how efficient can Kilcoo be on higher variance shooting?
  • Can Kilmacud continue to get a higher percentage of their shots off from the central channel?
  • Kickouts; will Kilmacud press and if they do will Kilcoo continue to force them in? What do Kilmacud do? A Kilcoo hammer blow awaits on anything that drops short of the 65.
  • And finally, the referee. Kilcoo had 17 shots from frees in their three games. But gave up 20. If this turns into a tight possession driven game – with both teams prodding for an opening – how the players shape the referees view of their tackling could be the decider

When Kilcoo have the ball

Kilcoo are very (very) patient with the ball. Of their 118 possessions in the three games under review (v Glen and Derrygonnelly in the Ulster campaign and St. Finbarrs in the semi-final) they strung ten or more passes together on 46% of them. All other club teams in this year’s review (13 non Kilcoo games – 26 different team performances) combined for 23%.

Their patience is not to be mistaken for passivity. They continuously probe with 25% of all their individual possessions being inside the opposition’s 45 and about a quarter of all possessions involving multiple entries into the 45 … they gain possession, bring it up to the 45 and start to probe right using Shealin Johnston’s speed to cut in to goal, down the middle primarily with Daryl Branagan or on the left with Eugene Branagan or Ceilum Doherty. If it is a quick break from a turnover Ryan Johnston picks up the ball on the 65 and runs at speed at you. They prod and thrust looking for the weak shoulder to attack or the cut in towards goal. If it does not come, they are happy to recycle back out to the 45 and go again. And again.

It must be absolutely draining to defend against. And this is shown up somewhat in two ways. The first is the volume of shots from frees they have attained with 17 across the three games – Kilmacud, in their three games under review, have only had eight.

Secondly, they have manufactured ten attempts at goal but only two of the ten have come before the 40th minute. The constant prodding and poking eventually leads to defences opening up. And that opening up, alloyed to Kilcoo’s willingness to go over and back, leads to the attempts landing at various players’ feet … eight different players have attempted those ten shots at goal. And they have been clinical with those attempts scoring 5-03.

Does the approach help their attack? Given their patience, and probing, their scoring efficiency is aided by where they shoot from rather than by excellent shooting. There is nothing wild. Nothing from more than ~35m out.

But is it predictable? By being so patient, and not shooting from the 45, they let teams set their defensive block deep on top of the D. Kilcoo have not gotten shots off in the pocket straight in front of goal (red above) … instead it is in an arc around the D (blue above). There is no real lean to either side; on the attacking left they are 45% (0 – 09 from 20) whilst on the right they are better (0 – 11 from 18) but that is probably due to more shots being closer to centre.

Deadball efficiency is as expected – probably a touch below average just given the propensity to miss those on the D

The template is simple enough. Control the ball. Control the game. Pull teams back and forth until there is a gap then pull the trigger in closer to goal or force the opposition to foul. As teams tire, they may not be able to close those gaps, or keep up to foul. Go for the jugular.

But that is just one side of the coin. How have the Kilmacud defence performed with these points in mind?

They have allowed six attempts at goal with four of those coming from St. Judes. In their last two games Padraig Pearses did not get an attempt off whilst Naas had two – both taken under severe pressure with the second coming late in the game (58th minute). Kilmacud have been particularly good at protecting that goal of late.

That is also shown up in the combined shot chart for Pearses & Naas … look how clean that area (known as the McGowan/O’Carroll zone) directly in front of goal is.

That is what every defence in the country wants their chart to look like. They do give up those shots around the D but that is high variance stuff – if they keep Kilcoo shooting from out there they will be more than happy.

One further point on the possession is where it emanates from. Kilcoo have gone short on 31 of their 38 kickouts. They want primary possession and are willing to fit the ball in to get it … only six of those 31 short kickouts were received uncontested or under no pressure. 11 were received under pressure, or with a man draped over the receiver, whilst another 14 were received whilst the opposition were pressing. And none were lost.

They have been clinical on the opposition’s kickout. They have faced 48 and won ten … getting their hands on one in five. But of the ten they won they produced nine shots scoring 2-04.

When Kilmacud Crokes have the ball

Kilmacud can be patient on the ball as well. Within the three games under review (v St Judes in the Dublin final, Naas in Leinster & Padraig Pearses in the semi-final) the percentage of possessions with ten or more passes came in at 32%. Not as high a proportion as Kilcoo but still higher than the average.

Their shooting is much the same as Kilcoo’s, but they are more willing to shoot from further out with that pocket at the top of the D being quite productive.

The above chart includes the St. Judes game when Paul Mannion was in the team. Despite being 13 he did not necessarily shoot from the offensive right that game … and his absence against Naas & Pearses hasn’t led to any huge pattern in their shooting. They were very balanced in those two non-Mannion games with seven point attempts from the right and seven from the left

Kilmacud have only (when compared to Kilcoo), attempted eight shots from frees across the three games and ten deadballs in total. Their returns have been a tad below average as Ferris has missed two 45s and a straight on free so it cannot be considered a strength.

But if Kilcoo continue to foul at the rate they have to date (eight against Glen in normal time; similarly nine to St. Finbarrs) then average may be good enough as the volume will aid their returns.

One major point of differential between the teams is the kickouts. Kilcoo went short 82% of the time (31 of 38). Kilmacud only went short on 33% (11 of 34) of theirs.

Part of the reason is that they are not as set to go short as Kilcoo are … they have lost three of those 11 which is a huge amount. And on top of that they have lost six of the 11 that have landed between the 45 and 65.

22 kickouts short of the 65 which should be prime retention ball – yet they’ve lost eight. And to date Ferris has not shown a propensity to be able to outkick any press. He can get them to the land between the 65s but not beyond.

Kilcoo are deadly when they get their hands on the opposition kickouts. Kilmacud have really struggled getting primary possession from their kickouts. How Kilmacud navigate this (or indeed what traps Kilcoo set them) will go a long way to determine the game.

2021 Galway Senior Club final

November 16, 2021

Corofin’s attacking output, over the ~65 minutes, was very, very poor. Unless you have complete control of the ball – which is a very rare occurrence – 0.24 points per possession (ppp) will not win any game. (I have completed four county finals from 2021 – the winning team’s ppp were 0.41, 0.34, 0.44 and 0.38 here)

But even that lens is flattering. When Mountbellew scored their goal in the 35th minute, to go 1 – 09 to 0 – 03 up, Corofin had just 18 possessions (I say “just” as Mountbellew had 25) but produced a meagre four (four!) shots. Had they maintained that trajectory for the whole game it would end up as 0.16 ppp and a Shot Rate of 22%! It was the 8th minute before Corofin completed a kick pass (and even then it didn’t go to hand – Mountbellew fouled the receiver) and by the first water break they had only controlled the ball inside Mountbellew’s 45 twice.

The flip side of this is that Mountbellew not only hit the ground running but hit *everything* in that opening period. It reads as Val Daly’s dream game plan; stymie Corofin’s early attacking moves, get your hands on the ball, read Power’s kickouts pinning Corofin in and finally take your chances. Taking each in turn

Corofin’s first three team possessions;

  • own kickout won as a Mark but subsequent pass, from Canney into Farragher intercepted in the D
  • own kickout won by Wall who carried it into Mountbellew’s 45 where he was dispossessed
  • sideline ball intercepted inside own 45. Corofin fouled the ball on the way out

Hands on the ball. Mountbellew are not an immature team, nor are they full of young bucks, however they have struggled in finals. They beat Corofin in the 2020 semi-finals but there must still have been some apprehension. Whether deliberate or not they eased themselves into the game. Corofin’s two first possessions ended after one player touched the ball. Mountbellew’s first two possessions had two of their longest strings of passing. In these two opening possessions there were 33 individual player possessions. Now there will be some players with multiple touches therein however that is a lot of the team getting their hands on the ball early.

Reading Power’s kickouts

Following on from the above Corofin won three of their first four kickouts (circled red). Power was angling the kicks to pockets on the wings for runners to run on to. One of these produced Corofin’s only shot in the first quarter. But Mountbellew quickly got to grips with this and won the next four (circled yellow) and, just as important as winning the kickout, they managed to get 0 – 02 from those four kickouts.

Which brings us to Mountbellew’s shooting early doors. At that goal on the 35th minute they had taken 16 shots and scored 1 – 09. A conversion rate of 63%. But prior to that they had a phenomenal start, scoring 0 – 07 from nine shots (78% Conversion Rate). These nine shots were not easy either with only one of the seven from play coming from “inside”.

They were 0 – 04 from six “outside” with McHugh converting a tight enough angled free kick. This was unsustainable however the early lead, and then the goal, cracked open the game and took the sting, and urgency, out of everything thereafter.

Mayo Kickouts (pre 2020 Final)

December 14, 2020

Kickouts are a huge element of any game. Where keepers kick them to, who gains possession, and how, and what teams do with those possessions. Prime example being last year when Dublin outkicked the Kerry press by picking out Brian Howard on the sideline and then setting up McCaffrey’s goal.

The interest in kickouts (as with most things!) tends to peak when Mayo are involved. The overarching sense in the build-up to this final is that David Clarke’s kickouts can be “gotten at”. So in the best traditions of the blog let us preview the kickout battle on Saturday by reviewing what has happened previously between these two teams.

Overview

We have six Championship games in the database between Dublin & Mayo (2015 drawn semi-final and replay, 2016 drawn final and replay, 2017 final and the 2019 semi-final) and whilst the protagonists, be that the Mayo keeper (more on that anon), the managers or the outfield players, have changed the overall outline of the teams, and the game plans therein, have remained intact.

In the six games there were 259 kickouts with Dublin gaining 13 (136 v 123) more possessions*.

*Personally I think language here is important; “winning” is a very positive phrase indicating that teams have done something “right”. But you can “win” a kickout that was terrible (opposition has a 3 on 1 but the one player comes out with the ball). Or indeed by not doing anything at all (ball dribbles out over the sideline). Instead teams gain, or retain, a possession.

Mayo defended those Dublin possessions well – to the extent that despite having 13 more possessions Dublin only produced 3 more shots. Mayo were more efficient at moving their kickout possessions to a shot. But as ever Dublin’s more clinical finishing saw them convert those three extra shots to 2-02 on the scoreboard.

However from a macro view, roughly 0 – 01, and half a shot, extra per game is nowhere near the dominance that is generally attributed to Dublin’s kickout performances.

Dublin’s kickouts

The above table compares Dublin’s kickouts in the six games against Mayo with opponents in other semi-final and finals during the same period. So we are comparing Mayo’s efforts with very similar calibre teams in similar high profile games.

And in truth Mayo have performed well by comparison. They have restricted Dublin to a 79% retention rate whereas other opponents have allowed Dublin an 84% retention rate. Now part of that could be the likes of Tyrone dropping off, and allowing Dublin to have the short ones, but when we look at what Dublin did with those possessions we can see that Mayo restricted Dublin to 0.33 points per possession (ppp) whilst others allowed 0.35. Mayo also scored more, both actually and per possession, than others did on the Dublin kickouts they gained possession of.

Combining all that Mayo come out looking better than Dublin’s other opponents allowing them to net 0.19ppp vs 0.23ppp against other teams.

That is one comparison point – to Mayo’s peers. But how does that 0.19 ppp allowed compare directly to Dublin?

Mayo kickouts

Things are not so rosy. Yes Mayo stack up well when compared to their peers however Dublin are a rung above and it shows here. Mayo restrict Dublin to 0.19 ppp on their kickouts … but Dublin have held Mayo to 0.12ppp on theirs. When they get their hands on the ball Mayo are more or less in line with Dublin scoring 2 – 26, or 0.33 ppp on their own kickouts with Dublin scoring 4-23, or 0.35ppp, on theirs.

The issue, in the main, is the sheer volume of Mayo kickouts that Dublin win. Dublin have only allowed Mayo to retain possession on 28% of Mayo’s kickouts. For comparison Mayo retain possession on 82% of their kickouts against other teams. Dublin retain possession on 79% of their kickouts versus Mayo.

On top of that volume Dublin look to strike hard. When they do get their hands on a Mayo kickout they produce a shot 62% of the time; others produce a shot 53% of the time they “win” a Mayo kickout.

Mayo keepers

One point of distinction within Mayo’s six games is the fact that they have used two keepers. The six games break down as two for David Clarke, three for Rob Hennelly with the sixth split more or less evenly when Clarke replaced Hennelly after 41 minutes of the 2016 final replay

Now not everything is based purely on the keeper. To absolutely, correctly, compare the two keepers we should be overlaying games state, the opposition’s tactics, the positioning of the outfield players etc.

But we don’t have that. Let alone that I only started recording the length of kickouts from 2017 onwards so we can’t, from this vantage, tell if Clarke’s higher retention rate is due to a higher proportion of short kickouts. Instead what we have is as per previous tables – retention rates and scores from kickouts won/loss. And against Dublin Clarke comes out well on top.

2020

So if Clarke has done well against Dublin, despite obvious failings such as the ball over the sideline at the end of the 2017 final, how is he, and Mayo, doing in 2020?

The answer is – not great. In their last three games (against Roscommon, Galway & Tipperary) Mayo have only retained possession on 69% of their own kickouts. We have seen that this was 72% previously vs Dublin … but acknowledge that Dublin is a step ahead of the rest. If the trend were to continue you would expect Mayo to come up with …. ~65% in the final??

And the more we delve into the numbers the less appetising they become. That retention rate of 69% includes short kickouts which account for 42% of all of Mayo’s kickouts. Mayo retained possession on 93% of these, which in itself is poor, but all kickouts out past the 45 saw Mayo with a Retention rate of 53% and a net ppp of -0.13. The opposition combined has scored 1 – 04 from the 18 possession gained off Mayo kickouts out past the 45. Mayo have scored 0 – 03 from 20 similar kickouts “won”.

Looking at the chart for these kickouts out past the 45 (we are missing some whereby the cameras didn’t pan out quick enough to see where they landed) we can see some obvious trends. Mayo have avoided the “mid-mid” section out to about 55m which ostensibly means that teams shouldn’t be able to come straight through on goal from one broken kickout however Clarke’s lack of relative length (think of where Patton or Beggan can land them) means that the whole “mid” section between the 45 & 65 can be flooded and the opposition are able to key on anything that is not pinpoint. Or has any shape of an arc on it.

Mayo have historically done better than others against Dublin on kickouts. Not better than Dublin but better than their peers. Clarke’s kickouts have had much better outcomes than Hennelly’s. But the 2020 trend is not encouraging and whilst in a one off game one or two breaks can have a big effect on numbers Mayo will, collectively, most definitely have to come up with something much better than has been the case so far this year.

Free Taking Review

June 15, 2020

This piece started out as a simple question – who is the best free taker? Just like reviewing the impact of short kickouts however that simple question opens up differing layers of complexities. So before we can answer that original simple question we need to disentangle the complexity, by understanding the various components, and then put it all back together again. (see note1)

Historic returns
Frees (for this piece 45s are considered free kicks) have produced a relatively stable return for the past number for years though there was a step up in 2017 that has been maintained.

The numbers involved, at just under 2.5k attempts, are robust. We can be happy that the returns, whilst covering approximately one third of all Championship games, are indeed indicative of free taking in the game at the highest level.

2017 – 2019
The relative stability of the returns means that the Expt Pts methodology works well. Thus we are able to look past pure Conversion Rates and take into account the relative difficulty of various frees to see who is outperforming the average

The above table shows the returns for any player with >25 attempts recorded in Championship games from 2017. Why we chose 2017 will become apparent. We can immediately see the importance of overlaying something (in this instance Expt Pts) onto the Conversion Rate through the lens of Rory Beggan. His Conversion Rate is low as the vast majority of his attempts are from distance. But his strike rate on these more difficult attempts is such that it ensures his returns, through Expt Pts, are well above average.

But this table is incomplete. It only includes those games fully charted and in the database.

To ensure a complete picture all frees from games not in the database, for those nine players, as well as the data for another six free takers from Roscommon & Tyrone (see note2), was reviewed and backfilled

Some quick highlights
• Diarmuid Murtagh comes in with a bullet; first on Conversion Rate and an above average return
• A “big three” emerges with Dean Rock, Seán O’Shea and Beggan pulling away from the others in terms of Expt Pts
• Through this lens Conor McManus & Michael Murphy are surprisingly low on the table
• Tyrone’s issues from deadballs are evident. They have used Seán Cavanagh & Darren McCurry as well but their main strikers have been below average as a trio

Shot Charts

From 2017 onwards I started to chart exactly where point attempts were taken from as opposed to just the sector which feeds into the Expt Pts calculation. This allows us to produce individual shot maps. It has also allowed us to create zones for frees – demarcated by the blue line above- with the guideline returns being 90% for “inside” and 50% for “outside”

In this guise below is Beggan’s shot map since 2017 (yes that is the 65m coming into view!)

He immediately presents a problem (one that we only really see elsewhere with Paul Broderick from Carlow) in that his “outside” shooting is very outside. Given that all attempts from beyond the 45 are placed into three zones based on the width of the pitch no consideration is really given to angle or length. And we can’t really model the returns as there are so few to compare against. It is therefore possible (probable?) that Expt Pts is underselling his performance.

To overcome this I’ve layered another zone so that instead of just “inside” and “outside” we now have “inside”, ”outside” and “ultra” (open to better names!!!). The “inside”/”outside” demarcation was subjectively arrived at after reviewing games. The below “ultra” outline is similarly subjective in nature. It could be moved 1 metre either way. Two metres perhaps? But looking at Beggan & Broderick’s shot maps we do have to introduce the concept so the below is as good an educated guess as any as to where to apply the line.

Individual players
Using these three ranges we now have new averages – 90% for inside, 58% for outside and 34% for ultra. Using these new ranges gives us a very different view of some players

Dean Rock

Mister consistency. Rock is second on the Conversion Rate ranking and first on Expt Pts. He is not padding his stats with short range efforts either. 71% of his attempts are “inside” and, whilst above average, his returns at 93% from this zone are not earth shattering. There are plenty with similar returns. What he is very good at is knowing his range – only two from “ultra”, which were out wide rather than long, with a lot of the “outside” attempts being centrally around the 45. This all aids his excellent 78% from “outside”.

On top of the mere accuracy we must note that 38% of his attempts have come in All Ireland finals and semi-finals. Preliminary work (here) has shown that game state can have an impact on a free taker’s returns. Given the sheer number of big game he has been in it is even more impressive that he has maintained this level of consistency.

Rory Beggan

No. 1 on “outside” shooting, from those with any volume, plus maintaining an above average return on the “ultra” length (40% versus a 32% average without his attempts included). The idea of a wrong side (right footer from the right) dissipates when we are shooting from such long range distances as the narrowness of the angle of the goalposts lessens, however it is still evident in Beggan’s chart. He is deadly centrally (80%; 0-16 rom 20) but if we draw a line up from the edge of the D he is 42% (0-07 from 17) on the right and 55% (0-06 from 11) on the left.

But that is nit picking. His abilities – such length whilst maintaining above average accuracy – is unique and is a deadly weapon. Quite apart from his accuracy just the threat of him means where you foul Monaghan has to come into any opposition team talk – which gives their inside forwards that extra split second to make their runs.

Conor McManus

We can’t talk about Beggan without reviewing Conor McManus. His returns were those that surprised me the most as my go to image of him is always hitting monster points from ridiculous angles. But that image hides a lack of consistency on his free taking; 84% “inside” is poor when you consider the volume he has taken from there.

Now there are mitigating factors. There are five misses from the right (wrong side) which indicates a lack of a reliable left footer whilst the subjective placement of the “inside” line goes against him. A metre further in and five of his misses would transfer from “inside” to “outside”. On top of the five misses inside from the right there are another two “outside”.

There are also another ten misses around the 45 which, when we compare to Beggan’s success there, make no sense as to why he would be taking them. They are obviously outside his zone. But the majority of these were pre Beggan becoming who he is. Eight of those ten central “outside” misses came in the 2017 campaign. Beggan had 12 attempts in total that year. McManus has more or less relinquished those efforts from which he is weakest from.

Seán O’Shea

The GAA’s own holy trinity is completed by Seán O’Shea. His unerring accuracy “inside” gives him a path to overtaking Rock on Conversion Rates but he will want to tidy up the “outside” shooting, especially just to the right of centre, to completely pull away from the other two in Expt Pts

Paul Broderick

Perhaps the most surprising entrant; he is the only member on the list outside of perennial Division1 & 2 teams. That in itself is a testament to the volume of games Carlow have played on their recent journey as well as their willingness to let him have an attempt given his accuracy.

Comments will become repetitive as we go through the players. He knows his limitations so doesn’t take them from the wrong side. The fact that he is left footed helps as “inside” right footed free takers are easier to come by. Again when the angle widens we can see him try some “ultra” attempts from the left. Prone to lapses of concentration – two of his three misses inside are within 25m on his good side.

Diarmuid Murtagh

His accuracy is good but he has been aided by the majority of his attempts being close and central. Again like Broderick the fact he is a left footer helps as Conor Cox & Ciarán Murtagh were able, in the main, to cover his “wrong side”

Neil Flynn

Neil Flynn took over from Kevin Feely as the main free taker in 2018. Overall conversion rate looks low at 71% but as the chart above shows he is reliable with his only two misses “inside” being from (a) the wrong side and (b) a straight on attempt close to the outside range. Has a weakness from centre to right of D for up to ~10metres outside the 45.

Peter Harte

As a unit Tyrone have struggled but Harte has held his own. Again like Diarmuid Murtagh he is aided by the fact that he is, in the main, an “inside” left footed free taker so does not have to take attempts from the wrong side. Again like Murtagh the majority of his attempts are within a specific close in zone – struggles on the edge of the “Inside” zone.

Shane Walsh

The only man to take frees off both feet (white = left foot above, black = right) and it is a testament to his two footedness that he is up there. The only other player I came across with this level of two footedness was Kevin Feely. Walsh was 94% (0-16 from 17) off his left “inside” and 85% (0-17 from 20) off his right. A bit of inconsistency with close in misses whilst Galway could develop a wide/long range shooter to take some of the pressure off as he struggles wide outside

Ciaran Murtagh, Conor Cox & Conor McAliskey

Murtagh & McAliskey had four attempts between them in 2019 whilst Cox’s volume is too small to extract too much from. All three come out with average returns on Expt Pts. Once again a reminder that average here is not bad – this is average in the context of the best players in our game in possibly the era with most collective accuracy ever.

Niall Morgan

Niall Morgan has an obvious comfort zone right of centre around the 45 (81%; 0 – 09 from 11). Everywhere else he has struggles (15%; 0-02 from 13). Playing amateur psychologist Tyrone see these as shots to nothing but there are consequences to such low returns – are they affecting Morgan’s confidence? Could Tyrone have scored more than 0 – 02 if they had gone quick with these attempts? Low volumes but poor enough game management.

Michael Murphy

Michael Murphy’s overall Conversion Rate at 66% is low but the perception, or mine at the very least, is that this was ok given the volume of his long range efforts. To some extent this is true as just under half (36 of 74) of his attempts come from “inside”.

And he is as good as the next man from “inside”. But this perception hides the fact that his long range shooting has not been up to scratch. He is, or at least has shown in Championship, that wide left, when he has, from distance, to swing them in, does not suit him.

For “outside” his returns of 45% are well below the average of 57%. Even more so when compared to those of the holy trinity – Rock, Beggan & O’Shea combined for 71%; 0-55 from 77.

Cillian O’Connor

In many ways Cillian O’Connor is the hardest player to peg. And the most surprising. I wrote on this subject, in what feels like a different lifetime, back in 2016 when O’Connor came out on top. He was the Dean Rock of 2013 – 2016. But this portion of his game has obviously regressed from there.

His “inside” shooting is still as metronomic as ever with his only misses coming from the right (due to the fact that Mayo have been unable to rely on a left footed free taker) and two out wide right on the subjective partition line.

The original “inside”/”outside” demarcation was not built on O’Connor’s data but it could well have been. The minute he steps outside that range his returns begin to plummet, from 94% “inside” to 41% “outside. This is the biggest drop of any player with any volume. The cherry on top being that he has missed all six from the “ultra” range.

Mayo have to help O’Connor here. Develop a left footed free taker. Transfer those longer range attempts to someone else. His brother perhaps? If you can’t do either start going short. Do something because what has happened for the last three years hasn’t worked.

Appendix

Note1: We must also understand that there are elements not captured. The impact of weather. The differing grounds. Pressure. Taking a free one point behind in an All-Ireland final is very different than taking one when ten points up in a Leinster final. We know all of these have an impact but that impact is not measured here.
We must also always be cognoscente of the small volumes involved

Note2; Roscommon & Tyrone were chosen given their relative success in the timeframe. We had the main free takers for the other “big” teams. Both of these had made the Super8s in both years

Short Kickouts Overview

May 6, 2020

Short kickouts. The bane of every traditionalist and subject of more opprobrium than steps, refereeing inconsistencies and red card appeals. Yet their prevalence continues to grow increasing from 46.7% of all kickouts in 2017 to 50.0% in 2019. That equates to a quarter of all possessions in a match.

So why, given that opprobrium, do teams persist with them? And do they work?


Why go short?

Short kickouts give a team possession (see Note1). And possession has been King of late with the average number of team possessions during a match dropping from 99.4 a game in 2015 to 90.3 in 2019. A reduction of ~9% over the past five years

The points per possession (ppp) by various kickout lengths also show that short kickouts far outstrip the returns for kickouts past the 45 (see Note2)


Short kickouts guarantee you possession in a game where possession is rarer; deny the opposition a scoring opportunity by kicking to a contest further out the pitch, whilst also being very productive compared to other kickout types. Why wouldn’t you go short?

Because that narrative is too simplistic. Incredibly so. A high proportion of short kickouts are conceded by opposing teams either through physical restraints (we know that no team can constantly press on the kickout) or for tactical reasons. Therefore basing efficiencies on whether a team gathered possession is too limited. It is what happens post gathering the kickout that determines how effective the routine has been.

(The best case scenario would be to know what percentage of possessions, emanating from short kickouts, were gathered versus differing defensive set ups. If a team defending the kickout drops you would expect the attacking team to take the easy option and roll a short one out every time. But it should be harder to score. If teams press up the proportion of short kickouts will drop as teams look to outkick the press. But we don’t have this granularity – see Note3 (more on what we do have later))

Here we look to introduce a new concept similar to the advantage that a server has in tennis (stay with me here!!). There is an excellent, if slightly out of date, article breaking down the nuances of the server’s advantage in tennis – https://www.tennisabstract.com/blog/2011/08/17/how-long-does-the-servers-advantage-last/ – but to quote that article

“… at some stage in the rally, the server’s advantage has disappeared. Four or five strokes in, the server may still be benefiting from an off-balance return. But by ten strokes, one would assume that the rally is neutral-that the advantage conferred by serving has evaporated

The same rationale can be applied to possessions in football. At some stage the advantage of having a possession from a kickout, such as the ability to bypass a defensive shield or use a pre-set move, disappears. The type of possession moves from a kickout into what one might dub a transition phase and any scores from this (transition) phase should be removed from kickout returns.

How do we determine that inflection point? That point when a possession moves from “kickout” to “transition”? One way would be time – how long a possession lasts. Another is how many passes are in a possession (see Note4)? And it is the latter that we are going to use here. I have collected the number of individual player possessions, within a team possession, for a number of years now which we can use as a proxy for passes. The breakdown of player possessions per short kickout gathered are shown below


Half of all short kickout possessions end after six individual player possessions. How they ended (shot, turnover, end of half etc.) is not a consideration at the moment. That will come later. The tennis paper had a range over which the advantage of the server dissipates. Following that example I have created two kickout phases – “quick” possessions where there have been 1-6 player possessions and then “medium” for 7-11 player possessions. Anything with 12+ player possessions is deemed to have moved to the transition phase – any outcomes, given how long the defending team has had to set up, cannot be attributed to the kickout (see Note5). All scores emanating from short kickouts will be attributed to these three components – quick, medium and transition. It is up to the reader whether they want to put the middle portion – “medium” – into the kickout numbers or the transition phase. I have placed them within the kickout phase.


Short kickouts

So what happens on short kickouts? The team taking the kickout gathers possession 94.1% of the time. We will parse those below but for now, and the remainder of this piece, we will treat the 5.9% of short kickouts where possession was lost as one homogenous group. On these the opposition scored 0.67 points per possession (ppp)

That led to a shot

The first demarcation on short kickouts is whether the possession was progressed to a shot. In our sample (96 Championship games from ’17 to ’19 and in excess of 2,200 short kickouts) this happened 58% of the time.

There are five outcomes from any shot; a score, the ball goes wide, the ball drops short and the opposition gains control, the half ends, or the shooting team regains possession (blocked shot regathered, or the ball goes out for a 45). The breakdown, for these five outcomes, are laid out below


With a score, a wide, the end of the half or the shot regained the kickout possession has definitively ended. We can take the outcomes from these kickouts and determine our points per possession (ppp) metric. The question then becomes what we do with the 11% of turnovers within “quick” & “medium” (we already have determined that “transition” possessions are no longer considered within kickout returns). Should any scores off these turnovers be netted against the scores from the short kickouts?

My instinctive answer to this is yes – but only where the score is off a quick counter attack i.e. a shot is produced, after a kickout, with one to eleven player possessions (“quick” & “medium”), the shot drops short, or is blocked, and the original defending team now scores off one to six player possessions (“quick”). Why only “quick”? It is undoubtedly a subjective viewpoint but in the main with player possessions of 1-11 the original attacking team should be more or less set defensively. When the ball is turned over the impact on the defensive shape, from the kickout, will be very quickly remedied.

If we do this the ppp table for shots from a short kickout looks like this


No shot

To understand the effectiveness of any kickout strategy you have to take account of the scores the opposition managed to attain from the possessions they gathered. We have produced these numbers for (a) where the kickout team lost the kickout and (b) where the kickout team managed a shot from the subsequent possession. What of the instances where the kickout team didn’t manage a shot?

Again there are four main outcomes here; there was no shot because the ball went out for a kickout (without a shot), the half ended or the ball was turned over either inside, or outside, the opposition’s 45


Again “transition” possessions, where the kickout team had the ball for 12+ individual player possessions before losing the ball, are discarded. Possessions that ended at half time or where the ball trickled out over the end line without a shot are also discarded.

So the question becomes which of the turnover possessions, and scores from same, we take account of? A bit of subjectivity is required again. Personally I believe all turnovers, off short kickouts, where the ball was picked up outside the defending team’s 45 should still be considered as an extension of the kickout possession. And all scores off those turnovers should be netted against the short kickout outcomes (these are denoted in green above; see Note6).

For those where the turnover was picked up inside the defending teams’ 45 (denoted in orange) we have already set the rules – only those where the then defending team scores on a quick counter are considered. Our ppp outcome for these now looks like


We have now calculated all the component parts; a breakdown of kickout percentages, how long teams held onto the ball for after gaining possession, how many possessions were progressed to a shot, how many were turned over, what score came off all our various components.

A team takes 200 kickouts with the returns from same following the outcomes outlined above. What happens?


The kickout team ends up scoring 0-57 whilst the defending team scores 0-26 … a net 0.156ppp in the kickout teams’ favour. Still good. Still positive. But much closer to the net ppp in the original table above for mid-range kickouts.

By team

Using the new methodology how do individual teams perform on short kickouts? Unsurprisingly Dublin are way out in front aided by a double positive – they have gathered possession more often than anyone else (98.4% of the time) and are also just more clinical on their shots in general.


Tyrone do well here, in the main, as they are very good at getting the short ones away. They are second on the list gathering possession 97.9% of the time.

Kerry and Mayo hurt themselves here somewhat. The opposition has gathered possession 9.1% (Kerry) and 8.1% of the time – compared to 1.6% & 2.1% for Dublin and Tyrone – leading to them leaking a combined 0-15 here. This compares to the gold standard of Dublin; on their 251 short kickouts they have only ever given up 0-02 from directly losing the possession and one of them was in the 68th minute when they were 9 points ahead against Galway in the 2018 AI semi-final (the other was Donegal in the 2018 Super8 game)


Note1: when talking about kickouts the term “won” is commonly used – “a team won 50% of its own kickouts”. I use the term myself; I interchange “won” & “gained possession”. But I shouldn’t. We need to move away from viewing kickouts as being won or lost as “won” indicates that the kickout was positive. But a team can win a kickout fortuitously (keeper kicks to a 1-v-3 for the opposition … but they all clatter into each other leaving his one player with the ball. This is a positive outcome on a terrible kickout). We need to think of kickouts in terms of gaining/losing possession as opposed to being won or lost.

Note2: this table is very simplistic. It nets, by length, the points scored on kickouts where possession was gathered versus points scored on kickouts where possession was lost.

Note3; partly due to time constraints on my part. But mostly due to the camera work of the various TV operators. Quite apart from the fact that one camera view is used for the vast majority of the game, so defensive shape cannot be determined, the operators tend to miss a number of kickouts due to the speed with which keepers get the ball away.

But even if we can’t see the exact defensive shape we can make some rudimentary notations as to how the ball was received. That was what I had started to do during the aborted 2020 league campaign. In the 11 games reviewed 72% of short kickouts were received uncontested thus further validating the need to go beyond whether the possession was gained to justify the tactic.

Note4; neither option – time nor number of passes – are fool proof. Any defending team can interrupt the possession by fouling and thus slow the possession down sufficiently to force it into the transition definition even if the time on the ball, or the number of passes, was relatively low.

Note5; these breaks are subjective. There is probably a statistical method available to split these groupings more accurately but my background is not academic enough to perform that. So we will, reluctantly, go with the gut feel based on the chart

Note6; we can tie ourselves in absolute knots here about what cohorts to include/exclude. But the volumes are small – 275 short kickouts ended up with the ball being turned over outside the opposition’s 45. Only 16 of these had 12+ player possessions. For simplicity’s sake they are all treated as one.

Derry v Down 1994 Ulster

April 23, 2020

This is the third game in the historic series (the 1985 All Ireland final between Kerry & Dublin can be found here whilst game4 of the 1991 Leinster series between Dublin and Meath can be found here) and a few observations highlighted in those games still hold true.

The game was different. The component parts – kickouts, fielding, shooting – were the same, and the current metrics we have for measuring them are probably a fair comparison, but the overarching principles that underlined how teams approached the game were different. Very different. Possession was not as important as it is now – clearing your lines was the first thought. This led to a lot more contested balls which in turn nullifies some of the metrics (points per possession, Attack Rates) we now view a game through (see note1).

In this game there were 113 team possessions with 31% of those possessions having just one player control the ball. 60% had no more than two players control the ball. No team possession had more than seven individual player possessions. This was very similar to that aforementioned 1991 game where there were 114 total possessions with 32% having one player possession, 63% having two player possessions and only one possession in the whole game having more than six individual player possessions (incidentally that was Kevin Foley’s goal!).

Compared to recent years? The four finals in the last three years have averaged 91 total possessions with 7% involving one player, 21% involving no more than two players and a whopping 35% with seven or more players controlling the ball. The game was different.

When Down had the ball

Overall Down had three fewer possessions throughout the game but managed to produce three more shots. (Incidentally that is now a clean sweep in these historic games for the team losing the possession count but winning the game). In and of itself this tells us something about that Down forward line; when they got the ball they were able to manufacture a shot. Again for the four finals in the last three years the Shot Rate (getting a shot off from possessions inside the 45) was 79.5%. Down produced a Shot Rate of 89% here.


Disc = score, X= miss; yellow = deadball, red = attempt on goal, black = point attempt from play 1st half, white = 2nd half

That Shot Rate was somewhat inflated by the sheer volume of deadball attempts – eleven in total (10x frees and 1x 45). Eleven is high both when compared to current trends (last two years have seen an average of 6.4 deadballs per team per game) and historically. The four teams in the previously mentioned historic games averaged 8.0 shots from deadballs per team. Greg McCartan had an off day from the ground returning 0-04 from 10 which is about 0-03 below (Expt pts -2.96) what the modern free takers would be expected to return (see note 2)

Given the shots they attempted Down were expected to score 1-18 (Expt pts of 21.5). We have touched on the poor returns from deadballs above but their shooting from play was more or less in line with modern returns (1-10 from 21; 52% Conversion Rate & Expt pts -0.74). They had three clear cut goal chances, which, incidentally, were their last three attempt from play, returning 1-00 leaving a stat line of 56% (0-10 from 18) and Expt Pts of -0.23 for point attempts from play. This is good shooting in an All-Ireland final (point attempts from play were 53% for the four finals from 2017) and, as we will touch upon below, was greatly aided by their decision making.

Mickey Linden was exceptional scoring 0-06 from 8 (Expt pts +1.41). Three with the right, two with the left and one fisted effort … all after missing a very simple fisted point with his first attempt. In the first half he was 0-05 from 7 whilst also being directly involved in the build up to two further shots. Derry got to grips with him in the second half, ostensibly by moving McKeever across to pick him up, however he was still pivotal getting out in front and shifting the ball with quick hands for McCabe’s goal and also letting the ball into the forward line for the Whitnall attempt that was pulled wide.

Part of Linden’s success was his link play with Aidan Farrell. Farrell, as the starting target man, “only” came away with 0-01, however he was the primary assist on six Down shots in the first half including 0-03 of Mickey Linden’s haul. In a nod to his flexibility, and ability, he was then brought further out to field to try and stymie the influence Gilligan & Tohill were having there.

McCabe must go down as one of the most impactful substitutes. He was only on the pitch for 10 minutes but was centrally involved in all three of Down’s goal attempts, which were condensed into a four minute period from the 63rd minute, whilst also shifting the ball to Whitnall who was then fouled for the last score of the game. Incidentally there is a great interview with him from 2019 here

When Derry had the ball

Derry were not as efficient as Down, either in terms of manufacturing shots from attacks (a shot rate of 78% versus 89% for Down), nor in converting those shots (a Conversion Rate of 45% versus 53% for Down).

Derry’s deadball returns were below what was expected (50%; 0-04 from 8 Expt pts -1.60) but not as poor as Down. Their goal attempts (1-01 from 2) also returned more than Down’s did. Which all leads to a very poor day on their point attempts.


Disc = score, X= miss; black = point attempt from play 1st half, white= 2nd half

Derry’s point attempts are outlined above. The majority of them came from “outside” where their accuracy fell apart in the second half; they missed all seven after going 0-03 from 5 in the first half. In fact when we compare the Down shots from play, versus the Derry ones, we can see a clear distinction.


Disc = score, X= miss; black = Derry point attempt from play, white = Down

A lot of Down’s comparative accuracy can be attributed to where the shots came from. The aforementioned decision making. Expanding the inside/outside zone (granted I have made this fit the argument but still …) Derry had 10 shots from outside the bulk of Down’s shots and scored just 0-02 from those 10 attempts. Inside both teams were more or less as accurate as each other; both returned 56% (Derry 0-05 from 9 and Down 0-09 from 15). Down’s chances were just heavily weighted to the more favourable scoring opportunities.

No one had a “Mickey Linden” day for Derry but Joe Brolly was very good. Not only did he convert both his attempts but he was also the primary assist in seven more shots including winning three frees and setting up McCusker for the goal

Kickouts

Generally speaking Derry dominated the kickouts. They gained 11 extra possessions (27 won versus 16 for Down) on the 43 kickouts without the volume being skewed towards them. They won 64% of their own kickouts (14 of 22) but also 62% of Down’s (13 of 21). They were dominant. Using current rules I had them claiming seven Marks, to Down’s three, with Gilligan & Tohill bagging three apiece (hence why Farrell was moved out)

But they didn’t turn this dominance into a scoreboard effect. Derry scored 0-05 directly off the kickout possessions won, which results in 0.19 points per possession (ppp). Down scored 1-05 from the 16 kickouts they won for 0.50 ppp

Unlike the modern game short kickouts were not really a “thing” with only five (12%) of the 43 kickouts dropping short of the 45. For context in the last four All-Ireland finals 58% of kickouts went short.

The kickout rules were different back in 1994. If a kickout was taken after a score it was taken from the 20m line. Otherwise it was taken from the edge of the small square. This had a huge variance on the length of the kickout and from Derry’s perspective the outcome. Below is their kickout chart with those kickouts post a score in white.


Disc = Derry gained possession, X= Down gained possession; white = after a score, black= after a wide

You can see that all bar three taken post a score made it past the 65 – basically onto Gilligan & Tohill – with two dropping just short of the 65. Derry dominated around the middle winning 10 of 14. But when the kickout was taken from the edge of the square Down managed to win 4 of 7 … three of these seven, circled in red, came in the last six minutes two of which led to the McCabe goal chances. Looking at the length of these three kickouts compared to the other four is it possible that the sheer volume of long kickouts emptied McCusker’s leg?

Note1
As an example of the differing emphasis there were 29 possessions started outside both team’s 65s in this game compared to an average of 7.75 over the past four All Ireland finals

Note2
This is another area, along with the possession count, that the modern day game distances itself from these historic games. And puts the accuracy of modern day free takers, such as Dean Rock and Séan O’Shea, into context. In the three historic games reviewed so far the teams combined for a deadball return of 49% (0-25 from 51). The average from the past five Championships was 72.6%. Rock, in the most pressurised of games, is running at 73% in All Ireland finals.

The three historic games’ deadballs are below. Now they have taken more long range pot shots than you are likely to see today but as a rule of thumb the target for current free takers is 85-90% “inside” and 50% “outside”. These historic returns are below expected on the “inside” (82%; 0-18 from 22) but well behind on the “outside” (24%; 0-07 from 29)

Ballyboden St. Endas v Kilcoo 2019 All Ireland Club Final

January 8, 2020

A high level overview shows an incredibly close game that, on chances alone, Ballyboden edged. They had 21 shots, with an Expected return of 0 – 14; Kilcoo produced 20 shots expected to return 1 – 10. They were created off very similar Attack Rates (78% apiece), Shot Rates (68% v 69%) and Conversion Rates (52% v 50%).

And yet Ballyboden were scrambling at the end trying to claw back a five point deficit with ten minutes to go. How did Ballyboden return a similar Conversion Rate to that of Kilcoo, off roughly the same number of shots, but find themselves in that hole? In large part due to their shot type.

Ballyboden shooting

Disc = score, X= miss; yellow = deadball, red = attempt on goal, black = point attempt from play 1st half, black = 2nd half

13 (10x frees and 3x 45s) of Ballyboden’s 21 shots were deadballs. That accounts for 62% of all their attempts which is an incredibly high volume; both in absolute terms and as a percentage of a teams’ total shot count. In the four provincial finals the next highest was seven shots from deadballs for Padraig Pearses in the Connacht final which accounted for 41% of all their shots.

Given this high volume Ballyboden had to ensure accuracy on their deadballs to keep the scoreboard ticking over. Instead they were poor scoring just 0 – 07 (54%; Expt Pts of -2.43).

Looking at the shot chart calling that 54% poor would seem harsh as they scored 0 – 07 from the nine attempts closer to goal and missed the four “50:50” chances from around the 45. But if these were true “50:50” chances then the average for the four would have been 0 – 02. To not get any of them is very poor especially as all four were taken with the benefit of a noticeable wind.

That brings up another quirk in the Ballyboden game – their lack of long range shooting. With that wind in the second half the furthest they attempted a shot from was c25 metres. In the first half they only had one shot (from play) from outside the 20m line. They were very conservative in their shooting.

Compare that to Kilcoo

Kilcoo shooting

With the wind in the first half Kilcoo had ten shots with nine of them coming from “outside”. The tenth was Johnston’s goal which was worked off a turnover high up the pitch.

Kilcoo only managed to score 0 – 02 from those nine point attempts so it was not necessarily a very accurate ploy (22% Conversion Rate; Expt pts -1.76) but it is in stark contrast to how Ballyboden used the wind. The old Wayne Gretzky adage of “You miss 100% of the shots you don’t take” comes to mind.

Of course, the other difference with Kilcoo’s shooting was their goal attempts. Kilcoo created three scoring 2 – 00. Ballyboden only had the one shot at goal which was a tight angled attempt that ensued from a scramble deep into injury time.

Kilcoo were very good in this aspect in the Ulster final as well meaning that they have scored 4 – 01 from just seven attempts on goal in two games. This is well above what would be expected. Can they maintain this in the final? Generally, you would expect their returns on goal attempts to revert to the mean but that’s in a long run of games. Nothing is set for just one game.

Kickouts

Possession from kickouts was a wash. Both teams lost one short kickout whilst the possession was evenly split on those that landed past the 45 (Kilcoo won possession on 11 to Ballyboden’s 10). No great split by keeper either; Kilcoo won six of Ballyboden’s 13 kickouts past the 45 with Ballyboden winning four of Kilcoo’s eight

One slightly strange aberration was that Kilcoo didn’t manage a shot from any of the five Ballyboden kickouts they won. This wasn’t an apparent issue in the Ulster final against Naomh Conaill, when they scored
0 – 02, off two shots, from four Naomh Conaill kickouts. But one of those shots came from a short one that went wrong. Over their last two games that is seven opposition kickouts past the 45 they have claimed – but only produced one shot from same. If they get a toe hold in the final through Corofin’s kickout they’ll have to do more.

Ballyboden St. Endas v Éire Óg 2019 Leinster Club Final

December 10, 2019

When reviewing games here we rarely reference the weather (except for last year’s Ulster club final) – mainly because the games covered are intercounty Championship played in the best of weather on (mainly) perfectly maintained pitches. This wasn’t the case here. There was a very strong wind down the pitch, the rain came and went throughout the game leading to a greasy ball and the ground was dead and heavy. All of which led to difficult handling conditions, placing numerous players under huge pressure, as well as changing the normal shooting zones.

A quick visual on how the conditions affected the game – below are the shots from play with the wind (white) and without (black).

Against the wind the furthest score was c25m from the goals. Only one shot was from further than 30m out. This in turn compresses the area that needs to be defended and can lead to more turnovers if the attacking team don’t stand off stringing a series of non-threatening passes together.

With all that said above are the numbers. There were only 31 shots in the game (the Munster final had 45, Ulster 37 and Connacht 36) with a total of 60 turnovers (Munster x43, Ulster x33 and Connacht x34) and 88 possessions (Munster x81, Ulster x69 and Connacht x68). The usual metrics of Shot Rate, Attack Rate and points per possession really don’t stack up.

That’s not to say the high turnover volume was purely down to the conditions. There were 24 turnovers higher up the pitch outside each teams’ respective 45 which is indicative of excellent tackling and physical aggression without cynicism. That lack of cynicism is further evidenced by the fact that there were just five shots at goal from frees throughout the whole game.

When Ballyboden had the ball

Ballyboden may not have taken many shots but they handled the conditions, shooting wise, better than Éire Óg did; they were 70% (0 – 07 from 10) on point attempts from play as against 43% (0 – 06 from 14) for Éire Óg. They also managed to eke out the only shot on goal.

Conal Keaney was evergreen scoring on all three attempts and also setting up another shot.

When Éire Óg had the ball

Éire Óg struggled to use the wind in the first half. They had a purple patch around the 10th minute when they scored 0 – 03 from three in sixty seconds. But outside that they didn’t have another shot in the first 20 minutes and then finished the half with nothing from four attempts.

The accuracy didn’t improve against the wind in the second half scoring another 0 – 03 from seven shots from play whilst another two opportunities went abegging with forced free kicks.
Séan Gannon was immense scoring 0 – 02 from 3 as well as providing the primary assists for another four shots.

Kickouts

Just a quick note on Éire Óg’s kickouts.

black = 1st half, white = 2nd half

They had just the four kickouts in the first half and, with the wind, went long(ish) on all of them winning possession on three. Against Portlaoise their mid to long kickouts broke 50:50 (won five, lost five). All good.

Against the wind they had seven kickouts but lost five; including two of the last three that led to Ballyboden points at the death. Could they have changed up those last few? Should they have? Not once did they go short. Ballyboden did so on three of their six against the wind. In the semi-final Éire Óg went short six times so it was in their locker. But having said that they did win a long one immediately after going a point behind but then kicked the ball away. Who is to say the outcome would be any different if they did go short? And there was a subtle change; their first four against the wind went mid to right and after losing three they went mid left with the last three. It just didn’t work.