Posts Tagged ‘Longford’

Expected Wins; how teams fared versus their odds

January 11, 2016

Once September rolls around only one or two teams will deem their year as being successful. In 2015 Dublin had a year of years winning the league, Leinster and the All Ireland (do we throw in the O’Byrne cup?). Monaghan winning Ulster made for a successful season whilst there is an honourable mention for Fermanagh with promotion to Division2 and the quarter final appearance. But what about the rest?

If the league is a means to an end for the majority, and the All Ireland and Provincial championships are regularly shared by the same teams, how do we measure the remainder’s performance? Or indeed how do we judge a team like Tyrone that got relegated, fell short in Ulster but rallied to get to the All Ireland semi-final? One way is to compare a team’s results against how bookmaker’s thought they should fare.

Bookmakers give odds on all games. The main markets are match odds and handicap. Any bookmaker worth their salt will tell you that though all odds can be converted into a percentage chance of winning this is not their primary aim when setting the line. They are not trying to exactly predict the likelihood of an outcome but rather set a line that will encourage multi way action on the game. This then enables them to have relatively evenly split betting on all outcomes and they can take the built in margin.

Still these lines are a very good proxy for how a team is expected to perform and the cumulative odds can thus be used to extract just how many games a team won above, or below, what was expected. Thus we create an Expected Wins (Exp Wins) metric.

Expected Wins

All odds for a game were converted to an Exp Win (see methodology in Note2 below) and then teams ranked according to how many wins they obtained in the League & Championship above this mark

Exp Win Top10

It comes as no surprise that seven of the top ten teams in pure win percentage appear in the top ten based on Exp Wins. Fermanagh and Monaghan are up there given their aforementioned successful seasons. Longford also had a good year winning 9 of their 13 games. In fact on pure winning percentage they finished second in the country behind Dublin’s 75%.

But what of the remainder? The biggest surprise by far was Limerick. They only won three games in total, ranking them in the bottom third on pure wins alone, but were 7th when compared to their Exp Wins. How so?

Limerick breakdownv2

They were the outsider in all seven of their league games but won three. From those seven games the bookmakers expected them to win 1.87. They outperformed their expected wins by more than a full game. In the Championship they lost by two points away to Clare in a game that had Clare favoured by two and then walked into Tyrone in the first round of the back door. The positive Exp Win total they accumulated in the league was not too badly dented by these two losses – especially the Tyrone one where they were huge outsiders.

Sligo were a bit of a surprise given that they only won four games but again they were quite large underdogs when beating Roscommon in the Championship and complete outsiders in the next two games against Tyrone & Mayo. Given the very low combined Exp Wins from those three games (0.39) that one victory against Roscommon puts them in positive territory for the Championship alone.

Against the Spread

Another way of tracking a team’s performance is to see if they covered the bookmaker’s handicap; or what their ATS (against the spread) was in American parlance. We would expect some cross over with the best performers in the Expected Win list but crucially you don’t have to win a game to beat this performance metric – only play above an expected standard

ATS Top 10

Again six of the teams that appeared in the Exp Wins top ten re-appear. A number of the teams, such as Limerick, Sligo, Fermanagh & Monaghan we have touched upon previously but there are a few surprises. Mayo, despite being a very high profile team, would have been a profitable one to follow on the handicap. Cork, for all the negativity following the losses to Kerry & Kildare, were also profitable but it is London & Leitrim that jump out. Between them they won four games all season but it could be argued they had a pretty good year; their performance exceeded expectations in 12 of their combined 18 games.

London only won one of their nine games all year but managed to cover the handicap on six occasions. Narrow that further and they covered the handicap in five of their seven league games including all three that they played away. You would never state that London had a good season but from a performance perspective we should probably cut them some slack. They performed well above expectation.

Worst Performances

Exp Win Bottom5

Originally the above table was going to be the bottom five but I expanded it to catch two of the bigger fish.

Some of the lower lights – Carlow, Wicklow & Waterford – being down here is not really a surprise given just how few games they won. However it does indicate that perhaps the bookmakers were generally over rating them despite their poor form.

Laois were particularly poor but looking purely at their Championship form they beat Carlow when their Exp Win was 0.86 so get very little credit for that and then had a further three games failing to win any of them when the combined Exp Win was 1.75.

Given they were relegated from Division 1 with just the one win from seven it is perhaps no surprise to see Tyrone down here.

Kerry won seven games throughout the year but were expected to win eight. Creating a league/Championship split Kerry had an Expected win of -0.81 in the league and -0.19 in the Championship. Their Championship was slightly less underwhelming than their league (I kid – sort of!)

ATS Bottom 5

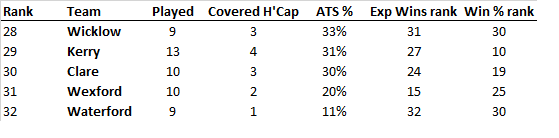
Three of those that appeared in the worst Exp Win table re-appear when we look at the worst performances against the handicap. Wicklow and Waterford not only failed to win enough games but also played poorly in their losses covering a combined four handicaps over 18 games. Given that they won seven games but were only an outsider once during the year – and that a slight outsider in the final against Dublin – it is no surprise that Kerry are again represented.

They had, all told, a good year but were consistently over valued by the bookmakers. Or conversely the bookmakers kept their odds short as the public’s perception of Kerry was that they were performing better than they actually were.

APPENDIX

Note 1; there can be quite a difference in bookmaker’s odds. The odds used for this piece were taken primarily from Paddy Power rather than taking the best prices available across all bookmakers. The main reason for this was laziness on my part as it meant just one source rather than hopping around sites.

When you take the price can also be important. Lines do move. However they were generally taken on Saturday or Sunday morning when any early moves had been accounted for.

Note2; generally speaking the margin on GAA match odds is 109% with lesser games getting up to 112%. A typical line in a close game would be 10/11 (home team), 15/2 (draw) & 6/5 (away team) which equals a book of 109.6%. To make this, and all games, come in at 100% – and remove the bookmaker’s margin – I extracted 3% from each outcome. There is a valid argument that this should be more nuanced (take less off the draw perhaps) but for now it’s fine.

Exp Win Explanation

The home team has a 52.4% chance of winning on the odds. We know this is inflated to account for the bookmaker’s margin. Take 3% away from each of the three outcomes to account for this and the home team now has a 49.4% chance of winning. So using the above quoted odds we get an Exp win of 0.49 for the home team (priced at 10/11) and 0.42 for the away team (priced at 6/5).

Do this for all games for a particular team and you have created an Expected Wins metric.

Dublin V Longford 2015 Leinster Championship

June 4, 2015

For those new to the blog, or who haven’t been here for a while, please find a refresher on the definitions and how the numbers are compiled here

Overall

Team Possessions Attacks Attack % Shots Shot % Scores Success % Weighting
Dublin 67 48 72% 39 81% 29 74% +10.297
Longford 49 29 59% 23 79% 10 43% -1.405
Avg 37.0 28.7 77.7% 14.7 51.2%

Some of the numbers that Dublin posted are just phenomenal

• A 74% Success Rate is the highest since the start of 2012 – the previous best being Donegal’s 67% against Tyrone in 2013
• Obviously a very high Success Rate will feed into a very high weighting. Mayo’s performance when demolishing Donegal in the 2013 quarter final had the top weighting at +6.813. Dublin just smashed this with a heretofore unthinkable +10.297
• Both B Brogan (3rd) and D Rock (6th) enter the top 10 individual performances from play and deadballs respectively.

Dublin completely overwhelmed Longford. Their opening stat line was 2-14 from 18 shots (82% Success Rate) with the two misses being a B Brogan shot wide right that was touched round the post for a 45 and Kilkenny’s near effort that hit the post – not exactly wild wides!

Now the claim will be that there was no resistance – and there is merit to that argument. Of the 16 shots from play attempted in that first half – when the game should have been competitive – I noted only 25% (4 of the 16) of as being attempted when under pressure. If we had opponent adjustments I have no doubt that the weighting would be a lot lower (as an aside there are no opponent adjustments as we don’t see teams often enough. Since ’12 this is only Longford’s 2nd TV game – how would you adjust?) however I’m not sure Donegal in that 2013 QF provided Mayo any sterner a defence than Longford did to Dublin. And Dublin were miles more accurate. Similarly in 2014 when Dublin had way more attacks (57 then versus 48 here) and shots (48 versus 39) against Meath than they did here they couldn’t put up anywhere near as good a performance.

It’s a truism but Dublin beat poor opposition – but they produced an unnervingly accurate performance in doing so.

Shots from Play

Team Shots Scores Success % Weighting
Dublin 35 25 71% +8.725
Longford 18 5 28% -2.932
Avgs 21.4 9.7 45.3%

B Brogan now has two entries in the top3 performances from play. His 1-06 from nine attempts (+2.806) puts this performance behind only O’Donoghue’s demolition of Cork in 2014 and his own display against Louth in 2012.

He played much closer in to goal than has been the norm with seven of his eight point attempts being attempted whilst in or around the 13m line. It happened so often I began to think the line was acting as a trigger for him to shoot. As an aside his only shot from outside the 20m line was a speculative effort from the right that led to a 45.

It was also good to see a genuinely two footed player put on a show – 3 with the left and six with the right.

Paul Flynn had another super-efficient game scoring 1-03 from his 4 attempts whilst Rock & McManamon combined for 1-04 from their combined 7 attempts.

Shots from deadballs

Player Shots Scores Success % Weighting
D Rock (Dublin) 4 4 100% +1.572
B Kavanagh (Longford) 4 4 100% +1.021
P Collum (Longford) 1 1 100% +0.506
team avgs 7.2 4.9 68.7%

Rock’s four from four included two 45s. With Cluxton in the ranks this is almost a luxury weapon for Dublin. Up until yesterday Cluxton had three of the top six performances from deadballs – if Rock wants to keep the 45s he’ll have to keep producing performances like this.

If he does stay in the team, and continues to convert deadballs at this rate, he will soon challenge the very top performances. As it is this game sees him slot in 6th on the overall deadball top10.

Kickouts

Dublin’s kickouts Won % Turned into an attack % Shot %
Dublin 12 92% 7 58% 6 50%
Longford 1 8% 1 100% 1 100%
Longford’s kickouts Won % Turned into an attack % Shot %
Dublin 19 56% 16 84% 13 68%
Longford 15 44% 10 67% 8 53%

Nothing much on the Dublin side as they only had 13 kickouts throughout the whole game – though it was strange to see Cluxton fluff a short one and present the ball on a plate to Kavanagh. Still better it happen now than in a more meaningful game.

Longford almost refused to go short. They did quite well on kickouts that dropped short of the 65 but once they went long they were absolutely wiped out losing the possession battle 16 – 3. Dublin launched attack after attack from Longford’s long kickouts scoring 3-04 from those 16 possessions.

Turnovers

Team giving up the ball Pass In the Tackle Shot Other
Dublin 16 7 3 5
Longford 15 8 7 3

If there is one area that Jim Gavin may wish to emphasise in the post-match briefing it will be ball retention and Dublin’s relatively high turnover rate. In a match that they completely dominated they gave the ball away as frequently as Longford did.

Although 16 passes going astray is quite high 12 different players contributed to that 16. It would appear to have been a team trait, or malaise, rather than any one player. Maybe it can be written off as “one of those things” as players tried to force the ball in quickly against inferior opponents.

Shot Charts

Dublin’s shooting
Dublin shooting (v Longford)

Longford’s shooting
Longford shooting (v Dublin)
x = missed, disc = score, yellow = deadball, black = 1st half from play, white = 2nd half from play,

Players with >= 3 shots from play

Shots Scores Success % Weighting
B Brogan (Dublin) 9 7 78% +2.806
B Kavanagh (Longford) 5 1 20% -1.454
P Flynn (Dublin) 4 4 100% +2.292
D Rock (Dublin) 4 3 75% +1.104
C Kilkenny (Dublin) 4 3 75% +0.656
R Connor (Longford) 3 3 100% +1.618
K McManamon (Dublin) 3 2 67% +0.782

Longford Vs Wexford

June 6, 2012
Team Possessions Shots Shot Rate Scores Success Rate Return Vs Expected
Longford 29 22 76% 11 50% -0.66
Wexford 38 29 76% 15 52% +2.09
avg 41.8 28.3 67.7% 14.1 49.8% 0.00

The perceived wisdom was that Wexford had too many scoring forwards for Longford to handle. One of Lyng, Brosnan or Barry would step forward for the free scoring Yellowbellies and see them through.

The above table would seem to bear this out with Wexford having more chances and performing better in front of goal. This didn’t come come from the expected sources however. Apart from half-back Adrian Flynn (see player tables below) Wexford’s shooting was bang on average. Take out Flynn’s shooting, & Brosnan’s deadballs, and they would have an Expected Return of -1.14.

Longford’s shooting was poor. Like Wexford they had a “big three” up front in Kavanagh, McCormack & Paul Barden. However unlike Wexford one of them stepped up with Kavanagh scoring 4 points from 5 shots with an Expected Return of +1.94. Of course what this means is that the rest of the team had a derisory Expected Return of -2.60 between them.

From play

Team Shots Scores Success Rate Vs Expected
Longford 17 8 47% +0.11
Wexford 25 11 44% +0.92
avg 21.1 9.3 44.0% 0.00

From deadballs

Players Shots Scores Success Rate Vs Expected
B Brosnan (Wex) 3 3 100% +1.11
C Lyng (Wex) 1 1 100% +0.06
S McCormack (Long) 4 3 75% -0.26
M Quinn (Long) 1 0 0% -0.51
game avgs 7.3 4.8 66.5% 0.00

Excellent free taking from Wexford though if Longford want to progress in the replay they will have to improve on their deadball striking – especially given how few shots they actually take.

The above shows how disciplined the defences were by only giving away 8 “scoreable” frees. This is especially so of Longford when you look at the disparity in possessions.

Players with >= 3 shots from play

Shots Scores Success Rate Vs Expected
A Flynn (Wex) 7 5 71% +2.12
B Kavanagh (Long) 5 4 80% +1.94
C Lyng (Wex) 5 2 40% -0.03
S McCormack (Long) 5 1 20% -1.13
P Barden (Long) 4 2 50% +0.07
R Barry (Wex) 3 2 67% +0.95
B Brosnan (Wex) 2 0 0% -0.75
PJ Banville (Wex) 2 0 0% -0.74
E Bradley (Wex) 2 1 50% +0.10
N Mulligan (Long) 2 1 50% +0.18

One point to note is the disparity in the volume of shooters. 82% of Longford’s shots from play came from their “big three” (Kavanagh, McCormack & P Barden) whilst 40% of Wexford’s shots from play came from Brosnan, Barry & Lyng.

To prevail in the replay Longford need Kavanagh to produce another excellent game, step up on their deadball shooting, stay disciplined in defence so that they don’t give Brosnan frees and ensure Wexford’s big three are as anaemic again. Simple!!