Posts Tagged ‘ulster’

Glen v Errigal Ciaran 2022 Ulster Club QF

November 17, 2022

A brilliant game with numerous talking points. From a pure numbers perspective Glen had 23 shots producing 13 scores and 0.44 points per possession (ppp). Errigal Ciaran had 22 shots producing 13 scores and 0.41 ppp. Those numbers do not, generally, lead to a four-point win unless one of the oldest maxims in the game comes to the forefront – goals win games.

Glen had four attempts on goal scoring 2 – 01 whilst also converting two (poor?) dropping shots into 1 – 01. Errigal Ciaran had two shots at goal scoring one and hammering the crossbar with the other. To rub salt into the goal attempt wound the follow up scramble, after the ball hit the crossbar, saw a palmed goal ruled out for a square ball.

There were two main areas where the teams differed – kickouts and the spread of shooters.

Kickouts

Glen won the kickout possession battle 24 – 15. When the ball travelled past the 45 (“mid” and “long” combined) they won the possession battle 14 – 10. Included in this were four of five Errigal kickouts in their dominant 10 minutes just after half time.

Winning the Errigal kickout was huge for Glen. All eight won outside Errigal’s 45 (“mid”/ ”long”) were turned into a shot with six of the eight being quick strikes where only four players controlled the ball prior to the shot. Win and punish.

Errigal not pushing up hard on the Glen kickout worked out. Unlike when they won an Errigal kickout Glen only progressed five of their own nine short ones to an attack (controlling the ball inside Errigal’s 45) with just the two shots.

Looking forward I thought that this might be a form of weakness. Glen had 23 possessions starting inside their own 45 (own short kickouts and turnovers picked up inside the 45) producing eight shots. A shot every 2.33 possessions. Elsewhere they got a shot off every 1.42 possessions. Did they struggle to create shots against set defences?

Not really. In their Ulster QF & SF vs Scotstown & Kilcoo in the 2021 campaign they produced a shot every 1.86 possessions (starting inside the 45) and 1.35 elsewhere. The 2022 average to date is a shot every 2.07 possessions for balls collected inside your own 45 and 1.58 for everything else. 

This was just variance.

Spread of shooters

Glen had ten different players attempt a shot with no one attempting more than four. They also had an impact off the bench with their two main subs (McGonigle came on for just two minutes at the death) getting 0 – 02 from three shots in a combined 50 minutes on the pitch

Errigal Ciaran, on the other hand, just had the five players attempt a shot with the three Canavans combining for 18 shots and 1 – 09. Their three main subs had a combined 55 minutes on the pitch producing just the one primary assist.

Derry v Tyrone 2017 Ulster

May 30, 2017

For those new to the blog, or who haven’t been here for a while, please find a refresher on the definitions and how the numbers are compiled here

Team Possessions Attacks Shots Scores Exp Pts
Derry 44 38 26 0 – 11 13.81
Tyrone 53 49 42 0 – 22 23.59

That is as comfortable a game as a team is likely to have. Tyrone had 9 more possessions, 11 more attacks and a whopping 16 more shots than Derry. There are examples of such disparities where teams begin to rack up numbers towards the back end of a game, as the competitive edge has gone out of the encounter, but (sadly) this was not the case here. When the game was – notionally – at its most competitive in the first half Tyrone had six more attacks and eight more shots.

Derry shooting
Although each game takes on a life of its own there are some stark similarities to the 2016 meeting (see here) . Then the gap in Expt Pts was ~8.5pts. Here it was just under 10pts. Below is a straight lift from the 2016 game review …

Derry had 18 attempts for a point from play throughout the game; only two of those came from inside the prime scoring zone (extending from the D in towards the goal) with none at all in the 2nd half. Outside of this only one other point attempt came from inside the 20m line. Derry’s fundamental lack of attacking speed allowed Tyrone to set defensively which in turn aided them in repelling Derry away from the most productive shooting zones. Derry were then forced to try less productive long range efforts.

Below are the Derry point attempts from play in the first half. Their whole game shot chart is in the Appendix. You can’t keep doing the same thing over and over and expect different results.

Tyrone shooting
Tyrone had their way with the Derry defence returning a 92% Attack Rate & an 86% Shot Rate. This was off an already enlarged possession total. What will (should!) concern them however is – as ever – their shooting. A score of 0 – 22 looks very impressive but with the chances they had they should have scored more (total Ext Pts of -1.59) – the high score was as a result of volume rather than accuracy.

It could be argued that this view – that they had a poor shooting outing – is on the harsh end as the negative Expt Pts return includes their two goal attempts being blocked/saved as well as some simple frees being missed (Harte’s left footed effort in the first minute being a prime example). When we only review point attempts from play the view is somewhat rosier; 0 – 13 from 27 attempts (an average. conversion rate of 48% but a positive Expt Pts of +1.11 indicating harder shots were converted).

Dig a little deeper though and 21 of those 27 shots were taken under no – or very little – pressure (another indictment of the Derry defence). Yes the next day their frees, or goal chances, might compensate for more pressurised point attempts. But what happens in August when they don’t get a goal, get five frees instead of 11 in a game and their shooting comes under a lot more pressure?

Tyrone free taking
Free taking has been a problem for Tyrone. Over the last 3 Championships they have returned a poor 61% (0 – 39 from 64; Expt Pts -4.00).

Shots Scores Conversion % Expt Pts Vs Expt Pts
D McCurry 17 0 – 10 59% 11.24 -1.24
N Morgan 14 0 – 06 43% 7.05 -1.05
C McAlliskey 11 0 – 09 82% 7.84 1.16
R O’Neill 10 0 – 05 50% 8.15 -3.15
S Cavanagh 7 0 – 06 86% 5.22 0.78
P Harte 5 0 – 03 60% 3.50 -0.50

This 61% is in stark contrast to a combined 84% from Rock & C O’Connor over the last two years.

Against Derry they were 73% (0 – 08 from 11; Expt Pts -0.50). Again – in a game with little or no pressure – their shooting was below average. The one bright spark was Séan Cavanagh who hit 0 – 06 from7 (86%; Expt Pts +0.38). As the above table shows he hasn’t taken many frees of late but when he did he was accurate. That flowed through to this game.

As a designated starter, and given Tyrone’s travails of late, it may be best for Tyrone’s to leave him on the frees. If he does nothing more than hit average then this will be an improvement.

Appendix

Derry’s shot chart

Tyrone’s shot chart

x = missed, disc = score, yellow = deadball, black = 1st half from play, white = 2nd half, red = goal attempt

Donegal v Monaghan 2016 Ulster

June 28, 2016

For those new to the blog, or who haven’t been here for a while, please find a refresher on the definitions and how the numbers are compiled here

Team Possessions Attacks Shots Scores Exp Pts
Donegal 44 39 27 1 – 11 16.86
Monaghan 47 37 26 0 – 14 15.14

At a macro level the returns for both teams are very similar with just three possessions, 2 attacks & 1 shot separating them. Nothing untoward or unexpected given the recent history of these two teams. What did differ however was just how bad Donegal’s shooting was. It was much more erratic than Monaghan’s evidenced by the low conversion rate of 44% and leaving >2.5 points behind them.

Donegal managed to create three good goal opportunities through Gillespie, McBrearty and MacNiallais. Those goal attempts returned an Expt Pts tally of +0.43. Given this was a positive, and the overall return was a negative then Donegal’s point taking is shown up as poor, bordering on feeble. Donegal scored 0-10 from 24 point attempts (42% conversion rate) with a combined Expt Pts of -3.29. Their shooting from play was below average (38% with an Expt Pts of -0.62) but not terrible – it was their free taking that really let them down.

Before we turn to Donegal’s deadballs we need to touch on Monaghan. They will be very concerned with their last quarter as, after the red card in the ~55th minute, they only managed to create two shots more than Donegal and more worryingly they only created the one shot from play in those final 20 minutes.

Deadballs
McManus was outstanding from frees converting 78% (7 from 9) with an Expt Pts tally of +0.93. The raw numbers do not do justice to his performance however as his 6th and 7th points were both converted from outside the 45, in injury time, whilst one of the misses was basically on the 20m flag from the right with the right foot.

Possibly of more importance for Monaghan, looking towards the replay, was the 33% conversion rate of the supporting cast. Monaghan rely on deadballs more than any team so to see K Hughes & R Beggan miss their only free – both from the right as was one of McManus’s misses – will be of slight concern to Malachy O’Rourke and his management team.

Whatever concerns Monaghan may have in this area will pale into insignificance compared with those of Donegal. McBrearty & Murphy were 45% from 11 attempts and had a combined Expt Pts of –2.53. In such a tight encounter you cannot leave that many points behind you.

On raw returns McBrearty would escape much of the blame scoring 0-03 from his four attempts however the one he missed was on the top of the D and should be converted 70-80% of the time.

Murphy was very poor scoring 0-02 from 7 attempts. There are mitigating circumstances in that two of his misses were outside the 45m line whilst a third was just inside the 45 from wide on the left. Even if you were to be generous, and exclude these three attempts, his returns were 0-02 from four with an Expt Pts tally of -0.67. Include them and the Expt Pts tally rises to -2.12.

We know Murphy is better than that. History has shown us that he is an above average deadball striker. Donegal will need him to (re)find his accuracy in the replay.

Kickouts
Much was made of the kickouts – especially Donegal’s – at half time in the Sky coverage. The gist being that the fact they had lost 4 of their 12 first half kickouts (whereas Monaghan lost just one of their nine) showed a poor kickout strategy.

At the time I was a bit dismissive of this as Donegal had netted 0 – 03 (Donegal scored 0-04 from the 8 they won whilst Monaghan scored 0-01 from the 4 they won) from their own kickouts whilst Monaghan had scored 0-01. However when we look at shots created from kickout possessions it was level at 5 apiece at half time. Extend that out to the 70mins and Monaghan created 10 shots from the kickouts they won to Donegal’s 7.

The loss of Durcan does appear to have robbed Donegal of some of their subtlety on kickouts and what is easily decipherable can also be easily targeted.

The Goal
Finally a quick note on the goal. Donegal had just gone down to 14 men and this was the first Donegal possession after this. Timely indeed but given the game situation it was surprising to see MacNiallais in acres of space in front of goal.
 
Don goal v Mon 2016
 
As can be seen above MacNiallais got a helping hand to create this space. Fintan Kelly (18) was marking MacNiallais (9) whilst Gillespie was also being man marked. MacNiallais got free however as Gillespie managed to step across Kelly and “help” him to the ground thus freeing MacNiallais up and giving himself a yard on his marker to receive the ball.

As Ciaran McMonagle (@CiaranMcMonagle – a good follow) said on Twitter “illegal but clever”

Appendix

Shot Charts

Donegal’s shooting

Cavan shooting (V Armagh 16)

Monaghan’s shooting
Monaghan shooting (V Donegal 16)
x = missed, disc = score, yellow = deadball, black = 1st half from play, white = 2nd half, red = goal attempt

Fermanagh v Antrim 2016 Ulster

May 17, 2016

For those new to the blog, or who haven’t been here for a while, please find a refresher on the definitions and how the numbers are compiled here

Team Possessions Attacks Shots Scores Exp Pts
Fermanagh 48 34 28 1 – 12 14.17
Antrim 41 25 23 0 – 09 13.18

Fermanagh will have areas to work on in the run up to their Ulster QF with Donegal but here, against Antrim over 70 minutes, they were by far the stronger in all the key metrics – more possessions, more attacks and more shots.

One of the areas of concern will undoubtedly be their shooting. Yes they outperformed their Expt Pts (how many points the average team would return from the shots attempted) but this was greatly aided by the conversion of their only goal chance and two magnificent sideline points. When going for a point from play they were very poor scoring on just 33% of attempts (0 – 05 from 15 shots). Outside Tomás Corrigan & Séan Quigley they were a paltry 18% (2 from 11 with a combined Expt Pts of -3.02)

Another area will be their conversion of possessions to attacks which, at 71%, was quite poor. Against Dublin last year for instance they produced, considering the opposition, a much more impressive 73%. The low attack rate may be easier to rectify than the shooting however as it was directly linked to their extremely poor opening 30 minutes in the second half. During that period Fermanagh managed only seven attacks (from 15 possessions – an attack rate of just 47%) and four shots opening up the possibility of an unlikely Antrim comeback. In the first half their attack rate was 81% from 26 possessions. Pete McGrath and his backroom team will hope the first half, when the team was at the pitch of the game, is a truer reflection of Fermanagh’s attack.

Antrim

Fermanagh - Antrim Exp Pts

What of Antrim? They had an awful opening 20 minutes, as the above chart highlights, from which they were never able to recover. Three of their first four possessions saw quick, indiscriminate long balls into the forward line that did not stick. This was then followed by six scatter gun shots that failed to find the target. Only Tomás McCann’s missed free kick in the 8th minute came from anything resembling a central position. Coming out of that opening period they were already six points down and the game was effectively over as a contest.

To their credit Antrim did perform much better in the second half, scoring 0 – 07 from 12 shots (two more shots than Fermanagh and a respectable 58% Conversion Rate) but whether this was a truer reflection of Antrim, or a direct correlation to the aforementioned anaemic display of Fermanagh, only the rest of the year’s Championship will confirm.

Kickouts

Again looking forward to the Donegal game one area of note will be the kickouts. At a very high level Fermanagh will be satisfied with their overall returns. They won 78% (14 of 18) of their own kickouts and 39% (9 of 23) of Antrim’s. Indeed their overall possession advantage of seven is nearly all contained within their kickout success. But therein lies a concern. To attain such a healthy win percentage Fermanagh went short on eight of their kickouts but did not manage to score anything from those possessions. Indeed they only manufactured four shots. When the kickout went past the 45 the result was a less convincing 6 – 4 to Fermanagh. Antrim only went short twice; of all their kickouts that travelled past the 45 the result was 13 – 8 in Antrim’s favour.

Donegal will not go as long as Antrim did. Over the last two Championships Donegal have gone short on 29% of their kickouts. This will immediately wipe out the possession advantage Fermanagh enjoyed in this game and place more pressure on securing their own kickout. They did a very good job of that here however they will have to do more, in terms of shots and scores from these possessions, than was the case here.

Tomás Corrigan

Finally we cannot pass without mentioning Tomás Corrigan’s display. He accounted for 58% of Fermanagh’s shots but his day will probably be best remembered for the two acute sideline points mid-way through the first half. Looking at historical results the chances of converting two back to back sidelines is just under 8% but getting and converting two within 90 seconds? That is slim enough to already warrant entry into “moment of the Championship”.

And yet his contribution does not end there; he was 3 from 3 from play converting two with his left and one with the right. Outside the three sideline attempts – as well as the two converted in the first half he attempted one with the last kick of the game – he was 67% on frees scoring 0 – 04 from six attempts which is more or less in line with the Expt Pts (3.88 for the six frees combines). All round an excellent, accurate and classy display.

Appendix

Shot Charts

Fermanagh’s shooting
Fermanagh shooting (V Antrim 16)

Antrim’s shooting
Antrim shooting (V Fermanagh 16)
x = missed, disc = score, yellow = deadball, black = 1st half from play, white = 2nd half, red = goal attempt


Players with >= 3 shots from play

Shots Scores Success Rate Exp Pts
T Corrigan (Fermanagh) 3 0 – 03 100% 1.55
T McCann (Antrim) 3 0 – 02 67% 1.93
A Breen (Fermanagh) 3 0 – 01 33% 1.21
B Mulrone (Fermanagh) 3 0 – 00 0% 1.35

Derry V Down 2015 Ulster Championship

June 10, 2015

For those new to the blog, or who haven’t been here for a while, please find a refresher on the definitions and how the numbers are compiled here

Overall

Team Possessions Attacks Attack % Shots Shot % Scores Success % Weighting
Derry 45 35 78% 21 60% 12 57% -0.736
Down 44 33 75% 24 76% 11 44% -2.819
Avg 37.0 28.7 77.7% 14.7 51.2%

Despite being reduced to 14 men for 35 minutes this will surely be a game that Down will bitterly regret. They had ample opportunity to win – manufacturing four more shots – but their shooting boots were just not on. Especially from play.

Below are the outcomes from running the two team’s shots through 20000 simulations.

Outcome simulation

Down win the game 57% of the time with Derry winning 31%. It is not so much that Derry were “lucky” – this is after all why the games are played on the pitch and not on a spreadsheet – but Down will be kicking themselves. Yes being down to 14 men for the entire second half probably fed into mental & physical fatigue – reflected in poor shooting options – but even with the poor options Down should have scored 0 – 14. They *should* have won.

What of Derry? In that second half they had 8 shots from 21 possessions. Down’s 14 men had 14 shots from 22 possessions. There really is no way you should be that far behind in terms of the headline metrics playing a full half with an extra man. Just a very poor second half outing from them.

Shots from Play

Team Shots Scores Success % Weighting
Derry 11 7 64% +1.180
Down 16 4 25% -3.285
Avgs 21.4 9.7 45.3%

Neither team had a shot at goal – nor looked like manufacturing one.

As mentioned Down’s shooting from play was very poor. Kevin McKernan hit two superb points in the first half but outside of that Down were 14% (2 from 14) with a combined weighting of -4.439 including some horrendous shot selection and execution.

Lynch’s shooting was wonderful (3 from 4; weighting of +0.996) for Derry – especially those two points late in the first half that opened up the gap coming up to half time. What should be of great concern however is the fact that Derry only managed 4 shots from play in that second half. Yes they were fouled on their way through but even accounting for frees Derry only managed 8 shots in the entire second half. Against 14 men. The average is 14.

Speaking of frees … let me preface the following by stating I am not an advocate of cynical play. I’m not. It is just that I am very sensitive to last minute scores following Kildare’s collapse at home to Tyrone in the ’14 league. If you are going to attempt to stop a winning score in the final minute then Down went about it in a way designed to inflict most damage on themselves.

The first picture below shows the pitch opening up after Bradley shrugged off the trailing Down player. Given that Down were willing to take a black card later in this move anyway then it was most advantageous to take it here – out the pitch where they still have a chance to regroup. That Down player just had to get Bradley to the ground when you see the wide open spaces in front of him.

Derry 1

Derry2

The second picture is taken a split second before the foul that led to the black card and ultimately the winning point. You couldn’t do it at a worse moment. You are beaten – by taking the player down you actually increase the chance of Derry scoring as they have a free that is converted at ~94%. Also, and almost more importantly, you waste a precious minute as the ref issues the black card and the opposition settles over the free. Just let the Derry man shoot – there’s less probability of a score plus you get an extra minute to get the equaliser.

Exhausted players making split second decisions at the death I know but that’s when you have to be at your sharpest mentally.

Shots from deadballs

Player Shots Scores Success % Weighting
M Lynch (Derry) 5 2 40% -1.501
E Bradley (Derry) 4 3 75% -0.015
B Heron (Derry) 1 0 0% -0.400
P Devlin (Down) 8 6 75% 0.069
D O’Hare (Down) 1 1 100% +0.397
team avgs 7.2 4.9 68.7%

Watching the game it felt that every other shot was a free and up until ~53 minute it was. At that stage there had been 19 shots from play and 16 from frees. The volume of shots did not exceed those from play until the 33rd minute.
Still that relative lull in the last 20 minutes only places this game on a par with Cavan – Monaghan this year for the second most shots from frees in a game – the *honour* of that title still lies with Meath – Tyrone in 2013.

As noted above Lynch as excellent from play but his deadball shooting was poor missing one from the middle in two “gettable” shots from the wing in either half.

On paper Devlin had a good day getting 0 – 06 from frees however his weighting shows that given where the attempts originated he was bang on average. His high tally had more to do with volume of shots rather than deadly accuracy on his part.

Kickouts

Derry’s kickouts Won % Turned into an attack % Shot %
Derry 17 74% 14 82% 9 53%
Down 6 26% 3 50% 3 100%
Down’s kickouts Won % Turned into an attack % Shot %
Derry 7 37% 7 100% 4 57%
Down 12 63% 10 83% 7 58%

As with other Ulster games we missed a number of instances where the ball landed so I’m loathe to read too deeply into how teams went about securing possession. I’m sure my need to see the kickout battle is not the producer’s target audience but man I really don’t need to see any more lingering shots of managers prowling the sideline – or the subs bench – when the game is on. Anyway ….

Pretty even all told. Derry won six more possessions but that is because they had four more kickouts. When you look at the percentage of kickouts converted to shots all 4 instances have a return in the mid 50 percentile

Shot Charts

Derry’s shooting
Derry shooting (v Down ) 15

Down’s shooting
Down shooting (V Down) 15

x = missed, disc = score, yellow = deadball, black = 1st half from play, white = 2nd half from play,

Players with >= 3 shots from play

Shots Scores Success % Weighting
M Lynch (Derry) 4 3 75% 0.996
K McKernan (Down) 3 2 67% +0.782

Cavan V Monaghan 2015 Ulster Championship

May 25, 2015

For those new to the blog, or who haven’t been here for a while, please find a refresher on the definitions and how the numbers are compiled here

Overall

Team Possessions Attacks Attack % Shots Shot % Scores Success % Weighting
Cavan 49 34 69% 25 74% 15 60% +0.741
Monaghan 43 35 81% 24 69% 16 67% +2.306
Avg 37.0 28.7 77.7% 14.7 51.2%

Cavan had every opportunity to take this game. They had more six more possessions and one more shot than Monaghan. Their shooting didn’t let them down as it was above average – it was just that Monaghan’s shooting was deadly accurate. Especially from frees.

Indeed if we just look at the expected return from the shots that both teams attempted, and run 20,000 simulations of same, Cavan win the game 45% of the time with Monaghan 43% and a draw 12%.

Cav - Mon outcomesv3

That first line “six more possessions and one more shot” does indicate that Cavan had problems converting primary ball into an attack (and a subsequent shot). Converting 69% of your ball into an attack (possession inside the opposition’s 45) is low. This is due in the main to the way that Cavan played launching long balls in to Argue.

In and of itself that is fine but it does mean you have to maximise your opportunities (as there will generally be less of them). And get a goal. Cavan didn’t manage one attempt on goal. There were instances where a break could have fallen their way but that’s the gamble you take with the long ball strategy.

Monaghan? On the whole they’ll be pleased. They went away from home and came away with a win. Job done. Move on. But their reliance on deadballs, and specific individuals, hasn’t moved on from the last two years. Remember how Dublin attacked them down the left when Walshe went off in last year’s QF? If a team is disciplined can they manufacture the chances from play? Can they chase a game with no great goal threat?

Shots from Play

Team Shots Scores Success % Weighting
Cavan 15 8 53% +0.471
Monaghan 13 7 54% +1.056
Avgs 21.4 9.7 45.3%

Monaghan’s accuracy was very good but their volume of shots from play would be a worry. Yes this was in part due to Cavan fouling however they only managed three shots from play in the first half and all from the top left (see shot chart below). That’s very poor.

They managed a much healthier ten shots in the second half and converted some absolute stunners (Dessie Mone hanging one on the wind from the left and McManus from a tight angle top of the right being another) but their lack of firepower (McManus aside) can be exploited if a defence is disciplined.

Monaghan only managed one shot on goal – Hughes’ pile driver over the bar – which is a recurrent theme. In their five Championship games last year they managed eight attempts at goal with two of those being long range shots from outside the 20m line. I took two snapshots when the camera panned back showing the huge open spaces in front of the opposition’s goal – it’s no wonder they are not prolific on the goal front!

PhotoGrid_1432493662612

Shots from deadballs

Player Shots Scores Success % Weighting
C McManus (Monaghan) 5 5 100% +1.448
N McDermott (Cavan) 4 4 100% +0.885
P Finlay (Monaghan) 3 3 100% +0.291
R Galligan (Cavan) 3 1 33% -0.442
R Beggan (Monaghan) 2 0 0% -0.669
K Hughes (Monaghan) 1 1 100% +0.180
M Dunne (Cavan) 1 1 100% +0.163
C Mackay (Cavan) 1 1 100% +0.064
M Reilly (Cavan) 1 0 0% -0.400
team avgs 7.2 4.9 68.7%

21 shots from deadballs is a lot. It places this game second only to the Meath – Tyrone game in 2013 which had a combined 23.

McManus (5 from 5) and McDermott (4 from 4) were the main protagonists converting all of their attempts however the weighting shows that McManus’s conversions were of the more difficult type.

During the off season we showed that McManus’s conversion rate was second only to Cillian O’Connor over the previous three years. It would appear he will challenge O’Connor for the top marksman accolades this year – his free from the left on the 20m line in the second half was a peach – as was Kieran Hughes’ from the right. With McManus, Hughes, Finlay & Beggan Monaghan have a lethal deadball arsenal.

There has been much commentary about Galligan’s two misses at the end however we forget the one he converted in the first half. Of the three kicks he would only be expected to convert more than one a little over half (~52%) the time. The misses were magnified by the timing and the game state. Indeed Rory Beggan missed both his long range efforts. His misses won’t come under the same level of scrutiny as Galligan’s however when viewed over the entirety of the game they were every bit as important, and of a similar ilk, to the two that Galligan missed.

Kickouts

Cavan’s kickouts Won % Turned into an attack % Shot %
Cavan 18 86% 14 78% 9 50%
Monaghan 3 14% 3 100% 3 100%
Monaghan’s kickouts Won % Turned into an attack % Shot %
Cavan 7 29% 6 86% 3 43%
Monaghan 17 71% 15 88% 9 53%

A word of warning when reviewing these. A lot of the immediate kickout aftermath – where the ball was aimed, who won it and how etc. was missed by the TV coverage. Not too sure why this may be – there were various lingering shots of players leaving the field and entering the subs bench when the game was progressing!

Shot Charts

Cavan’s shooting
Cavan shooting (V Monaghan)

Monaghan’s shooting
Monaghan shooting (V Cavan)

x = missed, disc = score, yellow = deadball, black = 1st half from play, white = 2nd half from play,

Players with >= 3 shots from play

Shots Scores Success % Weighting
C McManus (Monaghan) 3 2 67% +0.737
G McKiernan (Monaghan) 3 2 67% +0.479
M Argue (Cavan) 3 2 67% +0.114

Donegal V Tyrone 2015 Ulster Championship

May 18, 2015

For those new to the blog, or who haven’t been here for a while, please find a refresher on the definitions and how the numbers are compiled here

Overall

Team Possessions Attacks Attack % Shots Shot % Scores Success % Weighting
Donegal 41 31 76% 25 81% 14 56% +2.102
Tyrone 48 43 90% 27 63% 11 41% -2.477
Avg 37.0 28.7 77.7% 14.7 51.2%

Tyrone had their chances. They had two more shots than Donegal, after engineering 12 more attacks, but ultimately it was Donegal’s superior shooting and efficiency that saw them through. Sound familiar? Below are the returns from the 2013 game. Eerily similar. The faces may change (Joe McMahon, Stephen O’Neill, Rory Kavanagh, Leo McLoone, Jim McGuinness) put the pattern remains.

Overall

Team Possessions Attacks Attack % Shots Shot % Scores Success % Weighting
Donegal 43 29 67% 18 62% 12 67% +2.761
Tyrone 49 37 76% 29 78% 10 41% -3.015

Both teams went about accumulating their shots in very different manners. Donegal dropped back not engaging Tyrone until they crossed their 45. This enabled Tyrone to convert a very high proportion (90%) of their possessions to an attack. Tyrone on the other hand were more inclined to press thus stopping Donegal getting vast sways of their possession into an attacking position. As we have seen however, both in the corresponding 2013 fixture and throughout this team’s existence, Donegal are deadly efficient when they are at their best.

Shots from Play

Team Shots Scores Success % Weighting
Donegal 21 11 52% +1.183
Tyrone 21 8 38% -1.169
Avgs 21.4 9.7 45.3%

One might think that a large part of Tyrone’s inefficiencies here came from their goal attempts. They did have six shots at goal with only McCurry’s attempt registering however when they went for points they were only average – a combined stat line of 7 from 15 (47%) with a weighting of -0.141. Looking at the shot charts below there weren’t too many outlandish speculative attempts – it was just average shooting from average positions.

Donegal on the other hand were 59% (10 from 17) with a combined weighting of +1.535 when going for a point.

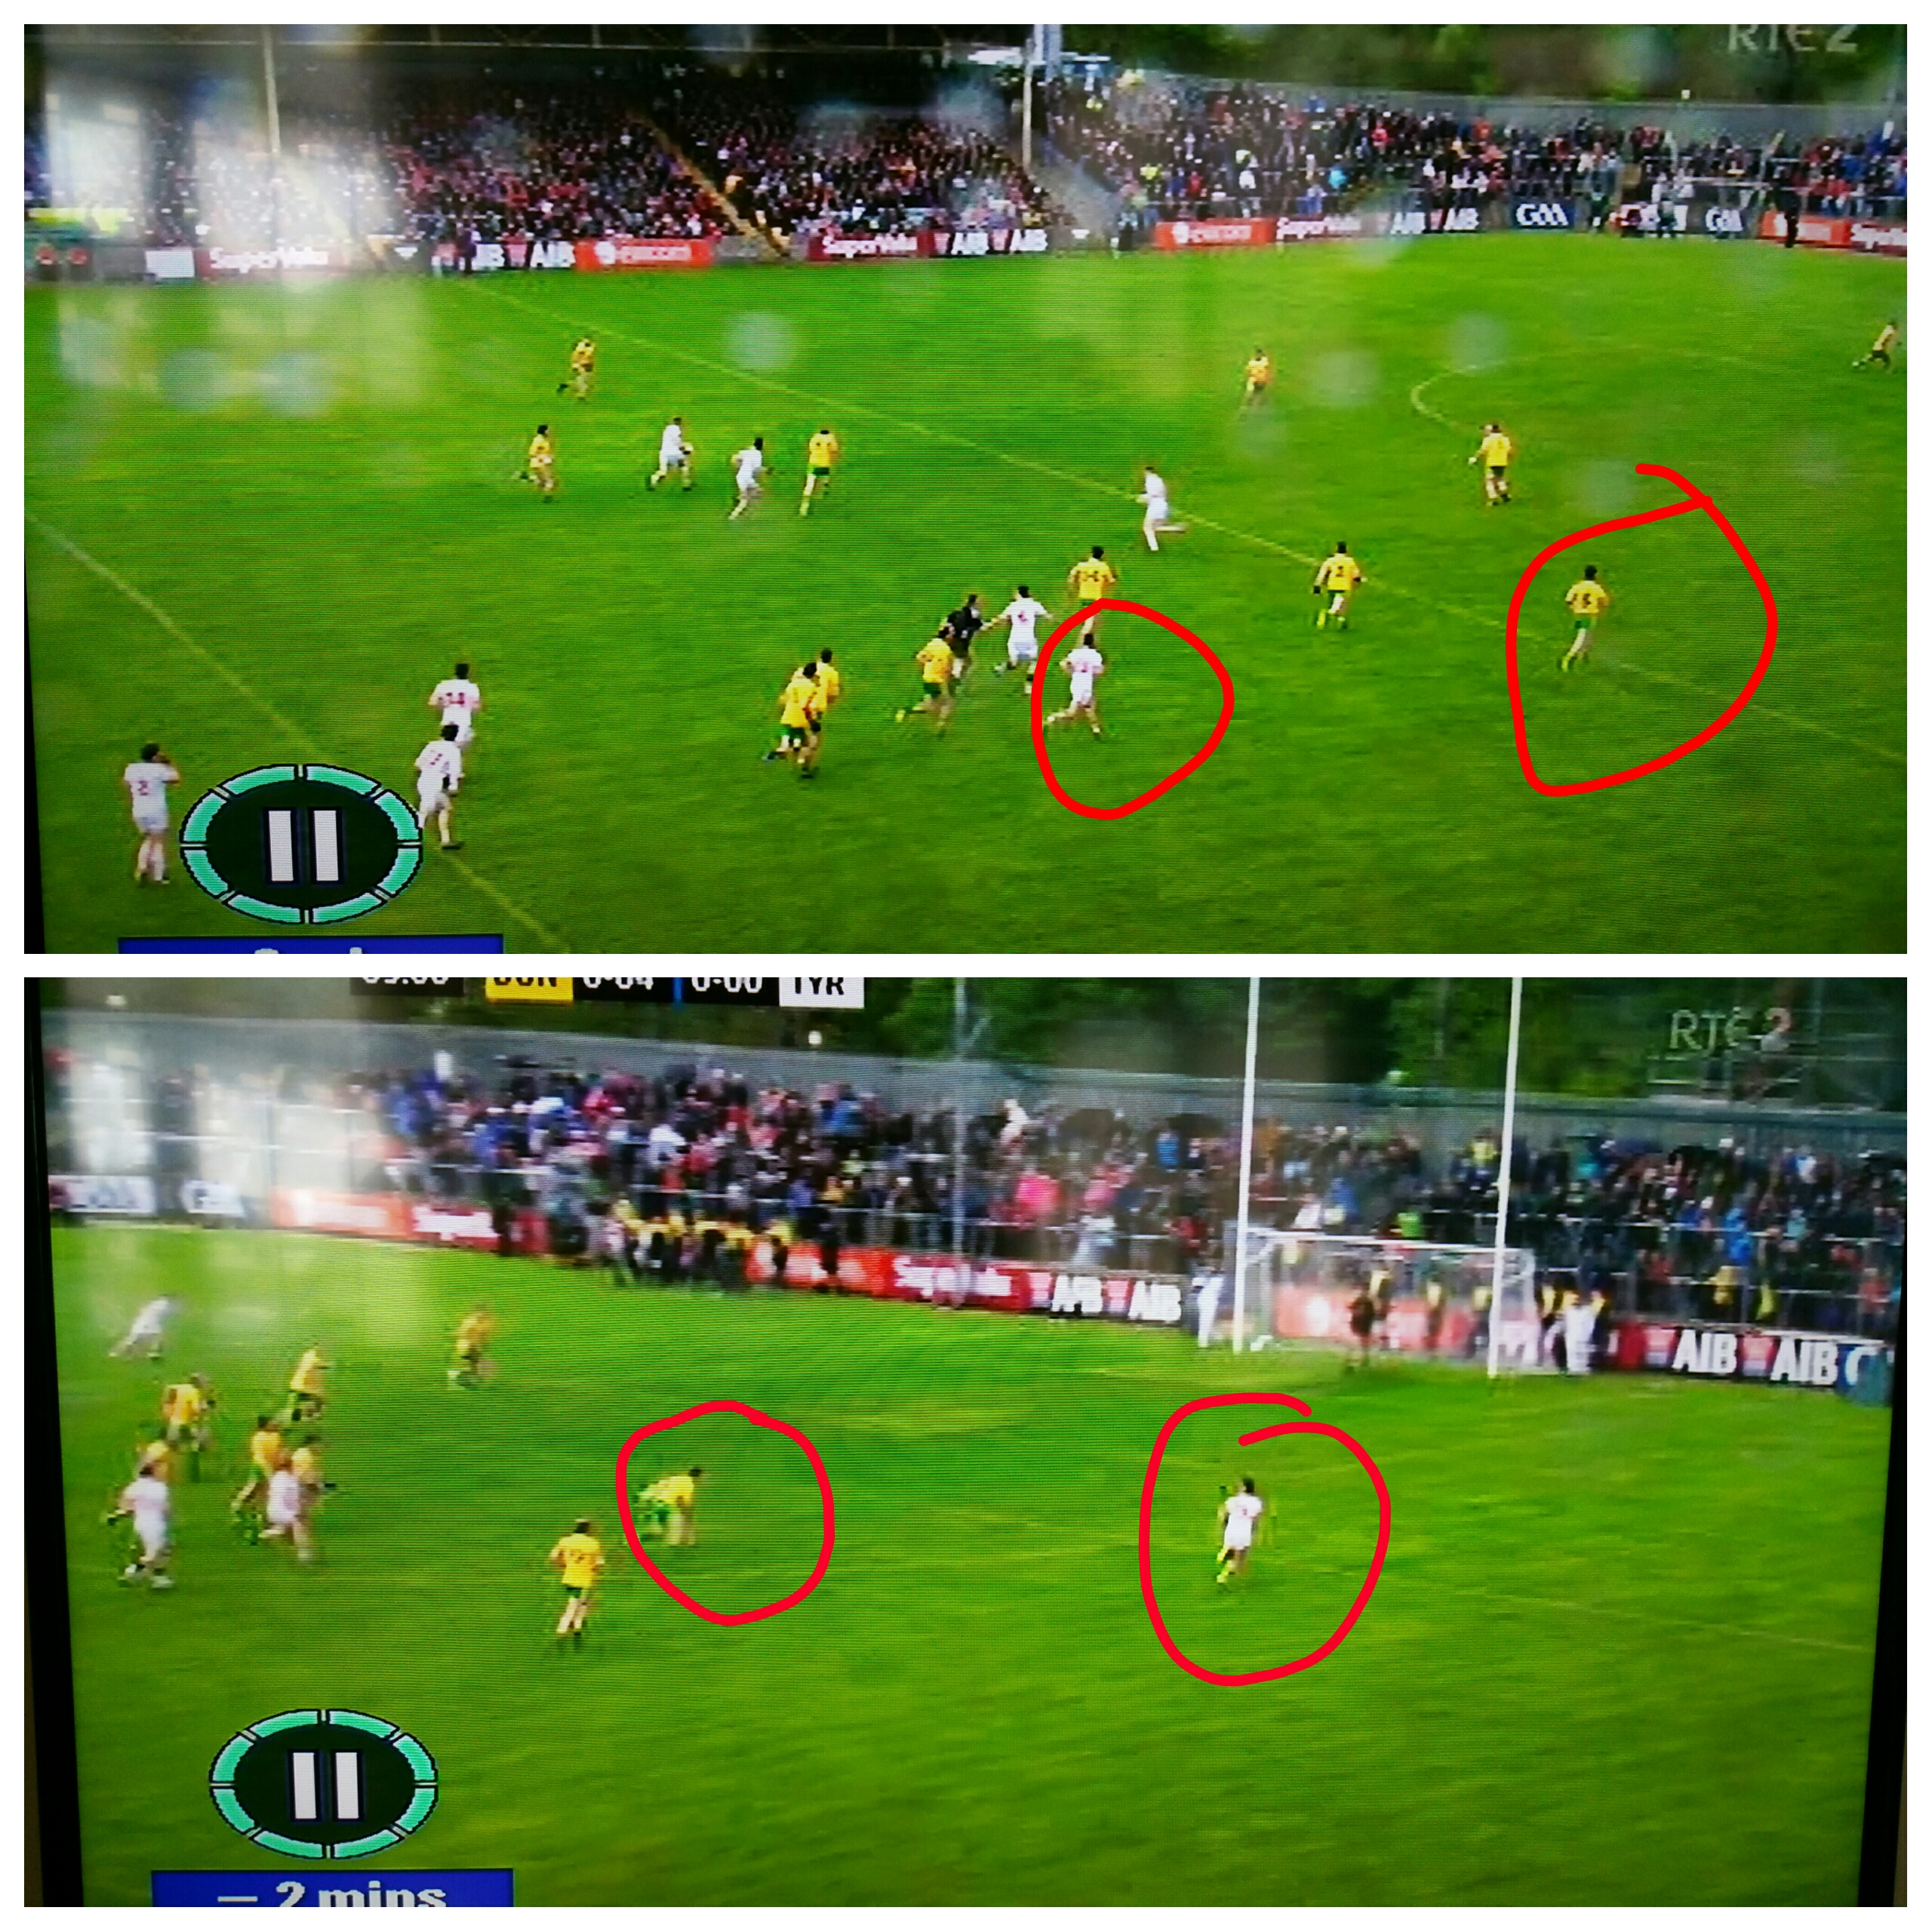
One area Donegal will review is the Tyrone goal. McCurry found himself in acres of space after drifting in behind the defence following a quick free in the middle of the park. Excuse the poor drawing (!) but you can see in the below snapshots that Donegal had plenty of men back but Ryan McHugh got sucked into the ball allowing the space to appear.

PhotoGrid_1431876004273

Shots from deadballs

Player Shots Scores Success % Weighting
M Murphy (Donegal) 4 3 75% +0.919
S Cavanagh (Tyrone) 3 3 100% +0.624
D McCurry (Tyrone) 3 0 0% -1.932
team avgs 7.2 4.9 68.7%

All the regulation frees were converted.

Séan Cavanagh’s placed ball day was good getting the two in front of goal you would expect any intercounty layer to convert whilst also swinging over the only difficult one he had from the left.

In 2013 Niall Morgan had a poor day converting one from six however he was in the main attempting very difficult long range “boomers” that are missed more often than they are converted. Although McCurry only missed three frees, compared to Morgan’s five, his day was perhaps even worse given that two of his frees were relatively easy. Granted the one in the second half was against the wind but he missed on the *near* side.

It was to Tyrone’s credit that Donegal’s first attempt at a score from a free was not until the 51st minute. Murphy missed that one but then took over converting two long range efforts including a 45 near to the right sideline – the *wrong* side for a right footer.

Turnovers

Team “coughing up” possession Volume Shots from Turnovers %
Donegal 20 10 50%
Tyrone 24 13 54%

One area that Donegal will no doubt review is their turnovers. Not necessarily the volume but where they gave them away. Of the 20 turnovers given up four were within their own 65. Tyrone only managed one point from this but in another tight outing – against Armagh or possibly Monaghan – that could yield precious scores.

Perhaps even more surprising is that Karl Lacey gave up three of those four. I’m guessing he won’t like this week’s video review session!

Kickouts

Donegal’s kickouts Won % Turned into an attack % Shot %
Donegal 11 52% 6 55% 5 45%
Tyrone 10 48% 9 90% 6 83%
Tyrone’s kickouts Won % Turned into an attack % Shot %
Donegal 5 25% 4 80% 4 80%
Tyrone 15 75% 14 93% 9 60%

At a macro level Tyrone won the kickout battle. Donegal’s kickout, from a volume & shot perspective, was a washout whilst Tyrone kept the ball by going short on their own. Strike out the short kickouts – which are not really contestable – and Tyrone win the kickout battle 15 – 12. Not as comprehensive but still a position of strength.

Donegal went short on four of their kickouts; of the 17 that crossed the 45 Tyrone got their hands on ten. Once they got ahead Donegal did not go short once.

On the opposite end of the scale Tyrone went short with 50% (10 out of 20) of their kickouts. Of those that passed the 45 the teams were split 50:50 (5 apiece) in terms of who came up with the ball. Against the wind in the second half they went short with 78% (7 out of 9) of their kickouts – this was obviously aided by Donegal who were dropping back to protect the lead.

Shot Charts

Donegal’s shooting
Donegal shooting (V Tyrone 15)

Note; I’m not sure if it was an issue with my feed or RTE but there was a blue screen for one of McElhinney’s attempts at a point. We know it went wide but we do not know where it was taken from so it is not represented in the above chart. For weighting purposes it is assumed the shot was taken from Sector 4 as the camera panned to McElhinney trotting back to midfield from the right hand side post shot.

Tyrone’s shooting
Tyrone shooting (V Donegal 15)

x = missed, disc = score, yellow = deadball, black = 1st half from play, white = 2nd half from play,

Players with >= 3 shots from play

Nothing earth shattering though it is noteworthy that McFadden got two of his three attempts. As noted (here) he had a very poor 2014. It was nice to see him back converting one lovely one with the outside of the left just before half time as well as jinking through for a shot at goal that was ultimately called back for a foul he incurred on his way through.

Shots Scores Success % Weighting
M McElhinney (Donegal) 5 3 60% +0.658
C McAliskey (Tyrone) 4 3 75% +1.040
C Toye (Donegal) 4 2 50% -0.004
P McBrearty (Donegal) 3 2 67% +0.894
C McFadden (Donegal) 3 2 67% +0.442
S Cavanagh (Tyrone) 3 2 33% -0.218

Cavan V Armagh 2013

May 23, 2013

For those new to the blog, or who haven’t been here for a while, please find a refresher on the definitions and how the numbers are compiled here

Overall

Team Possessions Shots Shot Rate Scores Success Rate Weighting
Cavan 34 32 94% 16 50% -0.3958
Armagh 40 29 73% 12 41% -2.167
2012 avg 35.28 27.02 76.6% 13.96 51.67%

What has been a recurring theme in the commentary on this game, and will be laced throughout this piece, is Armagh’s defensive tactics. The effect of this can be seen in a number of areas and none more so than in Cavan’s 94% shot rate.

In all bar two occasions when Cavan got the ball into Armagh’s 45 they got a shot off. This is phenomenal and an indicator of the lack of pressure the Cavan forwards were under. They were rarely tackled by multiple defenders nor forced to spray the ball back and forth across the line looking for a gap. Armagh left lots of space; the ball was played into it, gathered and a shot taken. Cavan’s slightly below average weighting shows that, Dunne apart, their execution left a lot to be desired.

Armagh did have their chances, with above average possession and shots, but their execution let them down.

Shots from play

Team Shots Scores Success Rate Weighting
Cavan 27 14 52% +0.9291
Armagh 23 7 30% -2.033
2012 avg 20.14 9.36 46.47%

Dunne and Keating had 19 shots from play between them scoring 10 points. Dunne was a lot more efficient (73% Success Rate (8/11) & Weighting of +2.41) than Keating (25% (2/8) weighting of -1.87) however the supply to both really had to be shut down.

Armagh’s shooting from play was very poor. Cavan marked Clarke out of it ensuring he only had one effort, apart from the ghost goal, which was knocked out of his hands. Unfortunately for Armagh none of his teammates stood up to take his place

Shots from deadballs

Player Shots Scores Success Rate Weighting
M Dunne (Cavan) 3 1 33% -0.961
N McDermott (Cavan) 1 1 100% +0.159
C Gilsenan (Cavan) 1 0 0% -0.519
S Forker (Armagh) 3 2 67% -0.611
A Kernan (Armagh) 2 2 100% +0.310
T Kernan (Armagh) 1 1 100% +0.167
2012 team avgs 6.88 4.6 66.9%

Apart from Tony Kernan’s wonderful sideline point there was nothing of note here – except perhaps Dunne missing two very easy frees in the first half.

Shot charts
Look at how close to goal all of Cavan’s shots are. Armagh’s man marking ensured that there was no “press” on the ball – Cavan could just get the ball in, turn and shoot.

Armagh, for all their failings, got the ball into the right area. They missed 6 shots from play from in and around Sector 5 – take the average from this sector and they are right there.

It is quite instructive to compare the two shot charts here with Mayo’s against Galway (here) and compare the accuracy from in front of the posts.

Cavan’s shooting

Cavan shooting

Armagh’s shooting

Armagh shooting

x = missed, disc = score, red = free/sideline, white = play, yellow = 45

Kickouts

Cavan-Armagh kickouts

Armagh had a +9 differential on winning kickouts but only turned this into a +3 differential in terms of shots. This was due, in the main, to Cavan’s excellent shot rate – every kickout they turned into a possession also became a shot.

Although on the surface a -3 differential on shots from kickouts won is not a bad days work this will be an area of concern for Cavan. They will surely not meet a defence as accommodating again. If they continue to win just 40% of kickouts we can expect the conversion to possessions, and then shots, to drop. Were this to happen it would provide a huge platform for their opponents.

Players with >= 2 shots from play
Eugene Keating had a bad day but he was stellar against Donegal last year (here). I think it is safe to assume that both he and Dunne will regress to the mean – if this does happen then Cavan will be looking for more production from the rest of the team.

Shots Scores Success Rate Weighting
M Dunne (Cavan) 11 8 73% +2.407
E Keating (Cavan) 8 2 25% -1.869
S Forker (Armagh) 4 2 50% +0.606
T Kernan (Armagh) 4 1 25% -0.358
E Rafferty (Armagh) 3 1 33% -0.135
M Shields (Armagh) 3 1 33% -0.177
N McDermott (Cavan) 3 1 33% -0.382
C Rafferty (Armagh) 2 1 50% +0.215
K Dyas (Armagh) 2 0 0% -0.926