Archive for the ‘2017’ Category

2017 Expt Wins

January 22, 2018

So in what is now becoming an annual exercise let’s review the 2017 season through the prism of Expected Wins (Expt Wins).The 2015 and 2016 versions of this article can be found here and here

For the uninitiated Expt Wins uses bookmaker’s odds (note 1), as a sort of independent arbiter, to see which teams over (or under!) performed versus what was expected on a game by game basis. It is a much better fairer view than sheer win percentages given (a) how relatively short the season is for most teams and (b) how uneven the Championship can be in terms of the quality of teams facing off against each other.

Table 1; 2017’s best and brightest

Unsurprisingly the top10 is peppered with teams that were promoted. This makes sense as for the majority of teams the league makes up at least two thirds of their season.

Carlow had an excellent season – but it was no fluke; they were also top5 in 2016. Over the past two seasons they have won 11 games when they were only expected to win ~7.7. And they managed to top the 2017 table despite losing as 1/16 home favourites against London. 1/16, without accounting for the bookmaker’s margin (see note1), implies a 94% win probability. Win that game and their “above Expt Wins” total would be twice that of second placed Louth. That loss is the shortest price loss in the database and must be one they desperately want back. There is no guarantee that Carlow would have gained promotion had they beaten London – as Wexford no doubt would have put greater emphasis on their final two games – but they must be absolutely kicking themselves every time they think of that game. And yet – they still topped the 2017 table despite this loss.

Now I am by no means an expert on the ins and outs of Louth football – and you have to think they have a good ‘un in Pete McGrath – but you have to feel for Colin Kelly. Back to back promotions. A 59% win rate over that period which lands them 5th on that metric behind the likes of Dublin, Tyrone, Kerry and Kildare (themselves aided by back to back promotions) and along with Carlow the only team to finish in the top5 Expt wins both years.

The two Championship campaigns were poor in comparison (played 6 won 3 with three loses of 4, 6 and 9 when stepping up against Derry and Meath) but still … be careful what you wish for.

In 2016 Tyrone and Cavan were in the top10 following successful promotions from Division2 and the trend holds true for Galway and Kildare. Division2 is always very tight – just under half (27 of 56) of all games in the last two years had a zero or one point handicap. Extend that to two points and 80% of the games are covered. Win enough games to gain promotion in these tight contests and you are well on your way to outperforming expectations for the season.

Table 2; 2017’s laggards

This is a mixed bunch of
1. Division4 teams who struggled to register wins and who are perennially down the bottom of these rankings – Limerick, Waterford, Wicklow
2. Teams that had a disastrous season – Cavan, Laois, Derry
3. Very good teams that didn’t get the job done enough – Kerry & Mayo
4. Cork!

Taking the four cohorts in order

1. The worst team in 2017 was (subjectively) Wicklow but no matter how bad you are when you play your peers in the league you are always given “some” chance. Wicklow’s seven league appearances saw them chalked up at odds of 8/11, 3/1, 5/6, 10/3, 11/2, 6/5 and 6/1. When we remove the bookmaker’s margin that equates to an expectation of two wins. And that’s for the “worst team”. Limerick’s odds were 8/13, 11/10, 13/8, 1/10, 8/15, 11/8 and 1/10 which comes out at just over four wins.

No matter how poorly you are viewed under Expt Wins you will always be expected to notch up at least two wins and maybe four or five … if you struggle to win games full stop you will always be down the bottom end of this table.

2. All three of Cavan, Laois and Derry were relegated and whilst combined they won 4 of 10 Championship games three of those victories came against Division4 teams when they were heavily favoured. At a very high level this cohort win the games they are expected to win, lost the ones they were expected to lose and came out the wrong side of way too many 50:50 calls

3. Mayo being so low on the table is easy enough to explain; in the three games that they drew Mayo were 1/5, 1/6 and 23/10 – those three games alone account for their negative Expt Wins. Kerry are slightly different. They may have finally managed to beat Dublin in the Division1 final but outside of that they failed to win half their games – with three of those games coming against Mayo when a good favourite (2/5, 1/2 and 8/13). They were almost prohibitively favoured at 1/20, 1/5 & 1/6 in the three Championship games that they won. That mixture (winning when big favourite, losing/drawing when favouritism is less obvious) is a recipe for a poor Expt Wins season

4. Cork. Ah Cork. For the second year in a row they appear in the bottom5 but can you imagine how poor they would look had Waterford managed to tack on one more point when Cork were 1/50? Cork were middle of the pack on win ratio (winning 41% of their games) but were overturned by Tipperary as a 7 point favourite in the 2016 Championship whilst also losing at odds of 1/3, 4/11 and 4/11 over the two league campaigns. They never won a game as underdog to balance these losses.

Is it predictive?
Although there are outliers – notably Carlow, Louth and Cork – I would lean towards no. There is just too much volatility as teams yo-yo up and down the table; Kerry from 27th in 2015 to equal 6th in 2016 and then back down to 28th in 2017; Cavan from 9th to 31st, Armagh from 32nd to 5th. Good luck trying to pick which of this year’s top5 will stay there!

Note1; calculating Expt Wins

Using the All Ireland final as an example. Paddy Power’s odds for the game were Dublin 4/9, Mayo 3/1 with the draw being 9/1. All that these fractional odds are is another way of expressing probabilities. To work out the probability any odds equate to you use the following formula (B/ (A+B)). For Dublin’s 4/9 the B here = 9 and the A = 4 so the probability of a Dublin win = (9/ (4+9)) which equals 0.692 or 69.2%. Do this for all three odds and you get

Dublin = (9/ (4+9)) = 69.2%
Mayo = (1/ (1+3)) = 25.0%
Draw = (1/ (1+9)) = 10.0%

The total percentages add up to 104.2%. Now we know that there are only the three outcomes for any game – team1 wins, team2 wins and draw – so anything above 100% for these three outcomes is the bookmaker’s margin. To get a truer understanding of the probabilities we strip out the margin equally across the three outcomes and come up with an Expt Win for each team. Dublin in this instance = 67.8% or 0.678 (69.2%-((104.2%-100%)/3)); Mayo = 23.6% or 0.236 (25.0%-((104.2%-100%)/3))

Note2; the odds
All odds are taken from Paddy Power and tend to be taken towards the back end of the week (Friday night/Saturday morning) to let any movements settle down. It is possible that injury news etc. changes the odds between what was taken and what they were at throw in but I’m comfortable enough that this would be a rare enough occurrence not to have too big an impact.

Dublin v Mayo AI Final 2017

September 19, 2017

Unfortunately I won’t be in a position to do a half decent write up until much later in the week so below are the usual battery of stats/tables. I will do up a write up at some stage and post it here – mainly for reference when these teams meet in 2018!!!

Listening and reading to some of the coverage post the final what jumps out to me is

O’Connor’s free at the end was outside his range – see the preview. It is so harsh on O’Connor that he takes a hit for stepping up to cover his team’s deficiencies and in some way lessens what he does elsewhere – see his brilliant long range point to draw the game level at the end.

Take a look at the assists table for players who had hugely impactful, under the radar, game

Mayo’s shooting was not poor! It was better than both 2016 AI Finals … it was just that Dublin’s shooting was exceptional. At one stage in the second half they were 0 – 11 from 12 for a Conversion Rate of 92%. Collective ice in their veins.

Overview

Kickouts

Dublin attack

Shot Chart

Shooting Table

Assists

Mayo attack

Shot Chart

Shooting Table

Assists

Dublin v Mayo 2017 All ireland preview

September 14, 2017

Immediate post-game reactions and numbers from the 2016 final can be found here (drawn game) and here (replay). Both will be referenced heavily below

Dublin Attack

We’ll get into the constituent parts below but as a collective Dublin have returned a whopping 61% Conversion Rate so far in 2017. The 188 shots they have attempted has netted them 19 points more (Expt Pts +19.05) than the average intercounty team would have scored. This Dublin attack is rolling.

Point attempts from play

Table 1 in the Appendix shows the breakdown per player but as a collective over two thirds (+13.87) of Dublin’s positive Expt Pts has come from their point attempts from play. The average Conversion Rate over the past 5 years has been 46%; thus far Dublin have returned 56%. The question is not how good they are – we know they are exceptional – but whether they can maintain that level of production?

And it is an open question as we have seen this before. Coming into both the 2015 and 2016 finals Dublin’s forwards were also flying with pre final Conversion Rates of 57% in 2015 (Expt Pts +17.63) and 51% in 2016 (Expt Pts +8.25). In the 2015 final they were impressive in maintaining their high returns with a 57% Conversion Rate (0 – 08 from 14) and a one game Expt Pts of +1.57 (in poor weather it must be remembered). However in the two games against Mayo last year they stumbled to a very poor 37% (0 – 14 from 38; Expt Pts -4.72).

The question is whether this stumble was induced by facing Mayo or was it more of a Dublin blip? There is no way to categorically state either way but looking from the outside I would give Mayo a great deal of credit. Coming into the 2016 final Mayo, in their six games, had allowed a Conversion Rate of 41% (0 – 45 from 109) as opposed to the 51% Dublin had been putting up. Across the two games the 37% Dublin achieved was much more in line with what Mayo had been allowing.

We have a similar scenario this year. Dublin are flying with the aforementioned Conversion Rate of 56% but again over a nine game span Mayo’s defence have only allowed a Conversion Rate of 41% (which, as an aside, shows remarkable consistency year to year). Can Mayo repeat their 2016 trick and “drag” Dublin’s Conversion Rate down in the final?

In an effort to explain the drop in Dublin’s shooting I created a pressure index (see Note1) and noted that Mayo were consistent across the two games in applying strong or severe pressure to just under half of Dublin’s point attempts (45% in the drawn game and 44% in the replay). In 2017 – across the nine games – Mayo have applied strong or severe pressure to 46% of their opponents point attempts. This has risen to 59% in the last four games.

So we know that Dublin can shoot and that they can carry it over (2015 final) however we also know that Mayo stymied them in both games last year and that the pressure index for their 2017 season is trending upwards.

One difference, for Dublin, observed when comparing this year to the last two All Irelands is just who is taking the shots. Below are the top 5 point takers coming into the last three finals and whilst there was a change from ’15 to ’16 the new entrants then were generally known quantities in McManamon & Rock. With Connolly suspended and Brogan & McManamon mainly coming off the bench there is a newer, fresher, look to the Dublin strike force.

Mannion & Andrews are well known to the Mayo defenders at this stage but O’Callaghan – despite there being a mountain of video evidence on him – is new and may cause the Mayo defenders to sit off initially; remember it was the relatively unknown Costelloe off the bench that did the damage in last year’s replay.

Deadballs

Given their experience, both last year and in their run to the final this year, Mayo may believe that they can handle the Dublin forwards. But what they will have to be very conscious of is fouling. Rock had a poor day in last year’s drawn game (0 – 03 from 7 (43%); Expt Pts of -1.58) but was then devastating in the replay (0 – 07 from 7 with an Expt Pts of +1.58).

He, and Dublin as a whole, have maintained this form throughout the 2017 Championship returning a barely credible 94% Conversion Rate (0 – 33 from 35) with an Expt Pts of +6.43 (see Chart 1 in the Appendix).
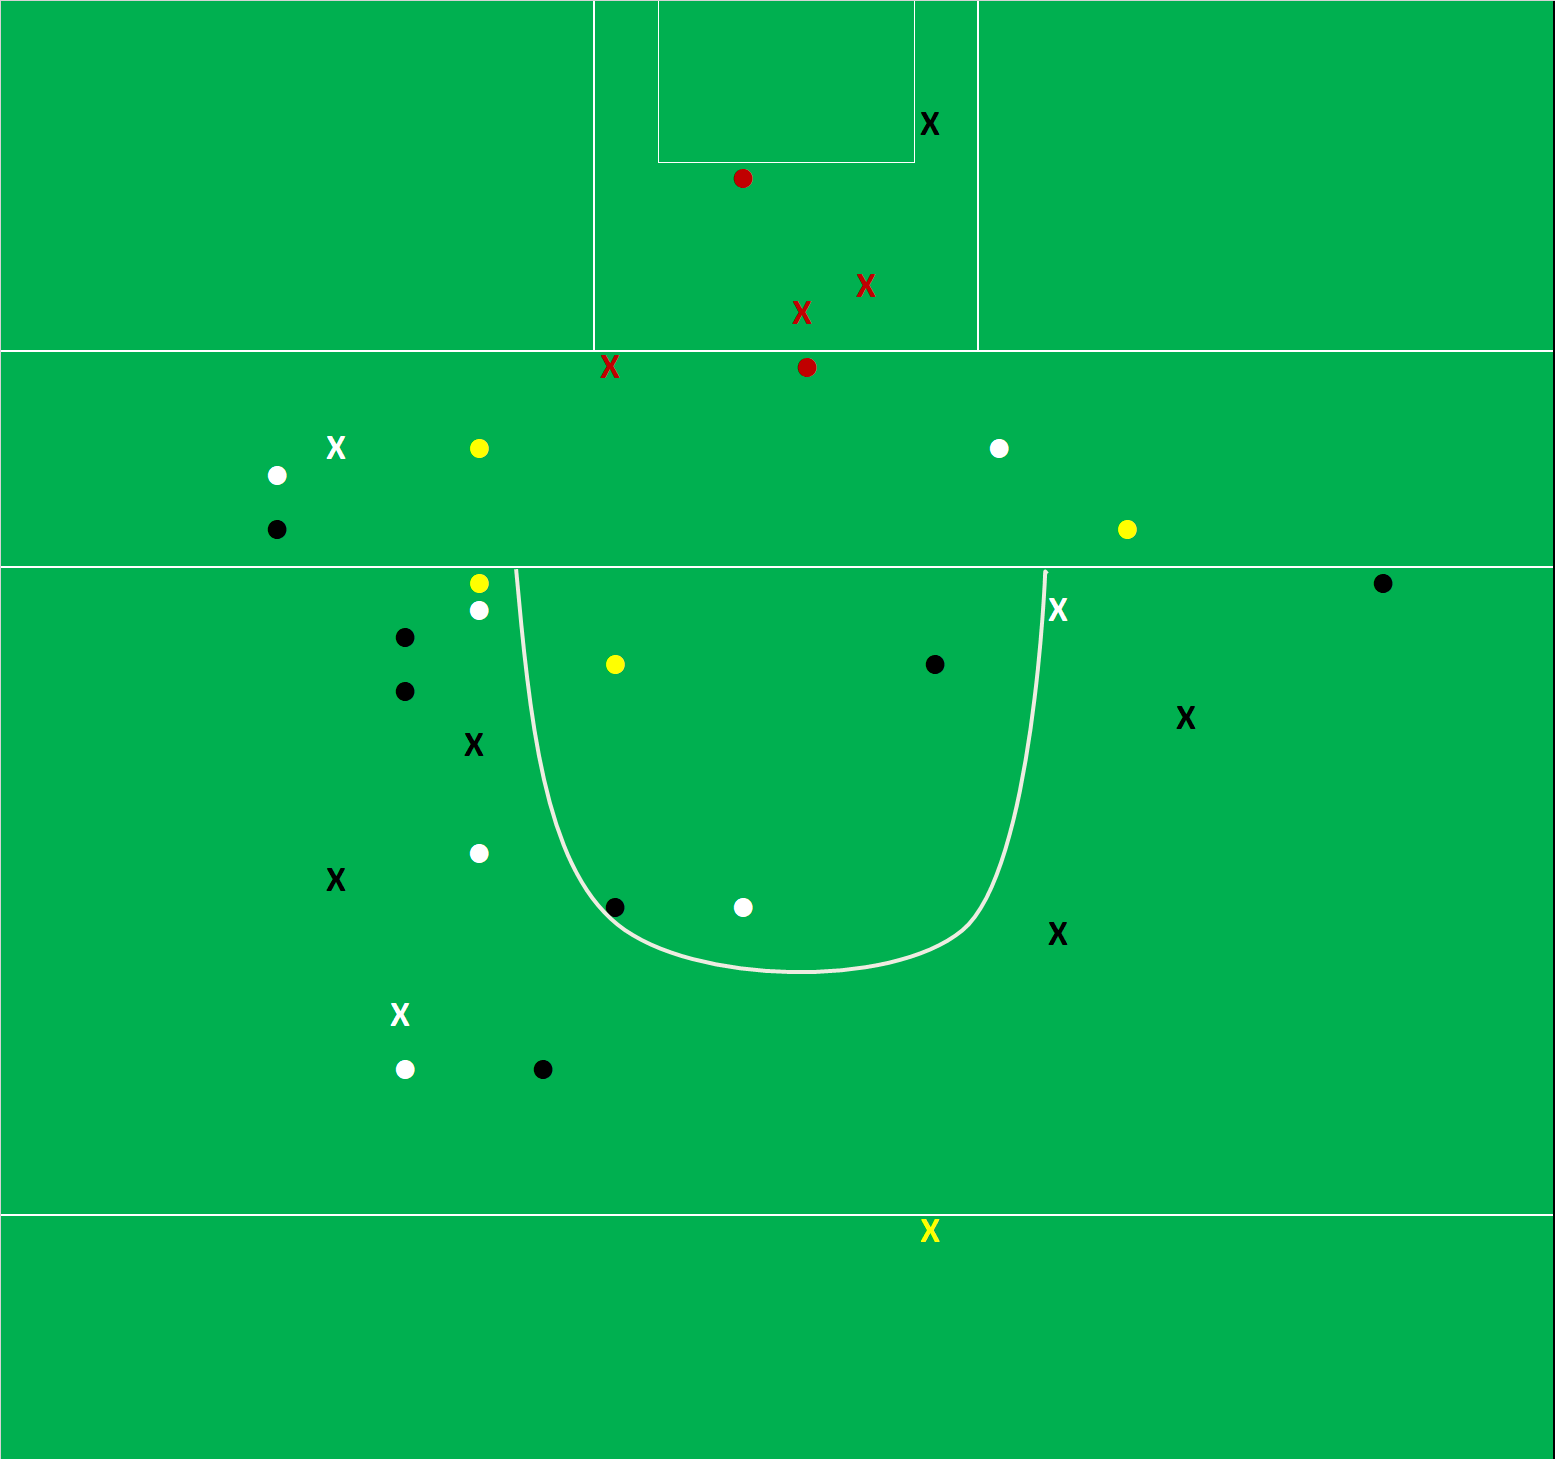
A special note of praise for Rock here. Although he had an off day in the 2016 drawn final he has been phenomenal since basically being removed from free taking duties at the back end of 2015. In 11 Championship games since the start of 2016 he is 92% and as the below graphic shows he is not only consistent “inside” where he is 96% but also outside (75%). Not only has he accuracy but he has accuracy with length.

Mayo cannot hope that the Rock from the drawn 2016 final appears. Instead they must expect that the Rock we have seen from the start of 2016, and in the 2016 replay, shows up. They gave up seven scoreable frees in the replay; in 2017 they have given up an average of 6.6 shots at goal from frees. Unless defending a lead their target has to be to minimise Rock’s opportunities from frees to seven or less.

Goal attempts

Dublin have – surprisingly given their opposition and reputation – only been average on goal attempts. In 2015 they were averaging 6.0 shots at goal per game but had a phenomenal 60% Conversion Rate (18 – 04 from 30). In 2016 this reduced dramatically to 2.2 attempts & a 46% (5 – 00 from 11) Conversion Rate. So far this year it is back up to 5.0 attempts a game but with a basically average Conversion Rate of 36% (9 – 01 from 25). In the 2015 final they manufactured 4 goal attempts but couldn’t convert any whilst in the two 2016 games they only created four distinct attempts at goal – but did manage to score in the most unconventional manner!

It’s all a bit of a rollercoaster. I think it is fair to say that Dublin are a lot less goal hungry than previous incarnations but this year has seen them somewhat pick up their attempts per game.

Mayo attack

Whereas Dublin are on fire Mayo have been hotter and colder, both from game to game and within games, than any other team. They returned a Conversion Rate of 41% against Galway and 71% against Cork; they scored 1 – 09 from just 12 shots in extra time against Derry after producing 0 – 01 from 15 attempts in a 25 minute spell in the second half. Against Cork they scored 0 -14 from their first 15 point attempts from play.

Mayo are the walking embodiment of the fact that you can twist stats to back up any argument

Point attempts from play

Looking at the nine games in the round (see Table 2 in the appendix) however we can say that their point taking has been just above average (50% Conversion Rate; +2.21 Expt Pts). But this is a step up on their 2016 campaign (46% Conversion Rate; +1.62).

There’s a slight anomaly in the above figures in that Mayo’s Conversion Rate has increased but the Expt Pts has remained more or less static. That’s because Mayo have attempted much more shots from central locations this year compared to last year. In a most Un-Mayo like fashion they have made life easier on themselves!

If we run an imaginary line vertically from the outer edges of the D to the 45m line we create a central channel. In 2016 34% of Mayo’s point attempts came from inside this channel. In 2017 this has risen to 51%.

A lot has been made of Mayo’s reliance on Moran and C O’Connor. Between them they have attempted 32% of Mayo’s point attempts returning 34% of their scores however in truth this is not too far removed from Dublin’s spread. Dublin have relied on O’Callaghan & Mannion for 29% of their point attempts and 30% of their scores. Now the argument can be made that Dublin have more alternatives in Connolly, Brogan, Kilkenny, Rock, Andrews et al should you shut the front two down – and that’s fair – but there are only so many shots to go around. And as good a unit as Kerry’s defence couldn’t shut them down. Moran & C O’Connor took 28% of Mayo’s point attempts across the two semi-finals with a combined Conversion Rate of 72% and Expt Pts of +2.89

Another notable point re Mayo’s shooting is that the “back-up”, the next ten players by shot volume (see Table2 in the Appendix), have been as accurate as Moran & C O’Connor with a 53% Conversion Rate (0 – 55 from 104) compared to Moran/C O’Connor’s 54% (0-34 from 63). Have Mayo got two top shooters? Yes. Have they ready-made, volume based replacements if they are shut down? No. Can the workload be spread and the efficiency maintained if they are shut down? Yes.

What of the Dublin defence? Coming into the 2016 final Mayo were running at an about average Conversion Rate of 45% (Expt Pts +0.89). For the two finals their combined numbers were 0 – 14 from 31 (Conversion Rate of 45%; Expt Pts of +0.22). The sample size is small but Dublin’s defence had no real additional effect on Mayo’s efficiency – Mayo carried over their conversion rate. Where they did have an effect however was in limiting the attempts Mayo had. Coming into the 2016 final Mayo had taken 20.7 point attempts per game. In the final this dropped to 15.5.

This year so far Mayo have averaged (again with remarkable consistency) 20.5 point attempts per game. In 2016 Dublin – prior to the final – had allowed the opposition to take 16.6 point attempts per game but this has risen to 18.6 in 2017. So not only has Mayo’s efficiency on the same volume of shots increased but Dublin are allowing more shots and (in 2016 at least) didn’t have an effect on Mayo’s efficiency.

Deadballs

C O’Connor has been rock steady on frees throughout his career converting, when the pressure has been at its most intense, 86% (0-55 from 64 Expt Pts of +4.99) in semi-final and finals alone from 2012 to 2016. His range does appear to have shortened however.

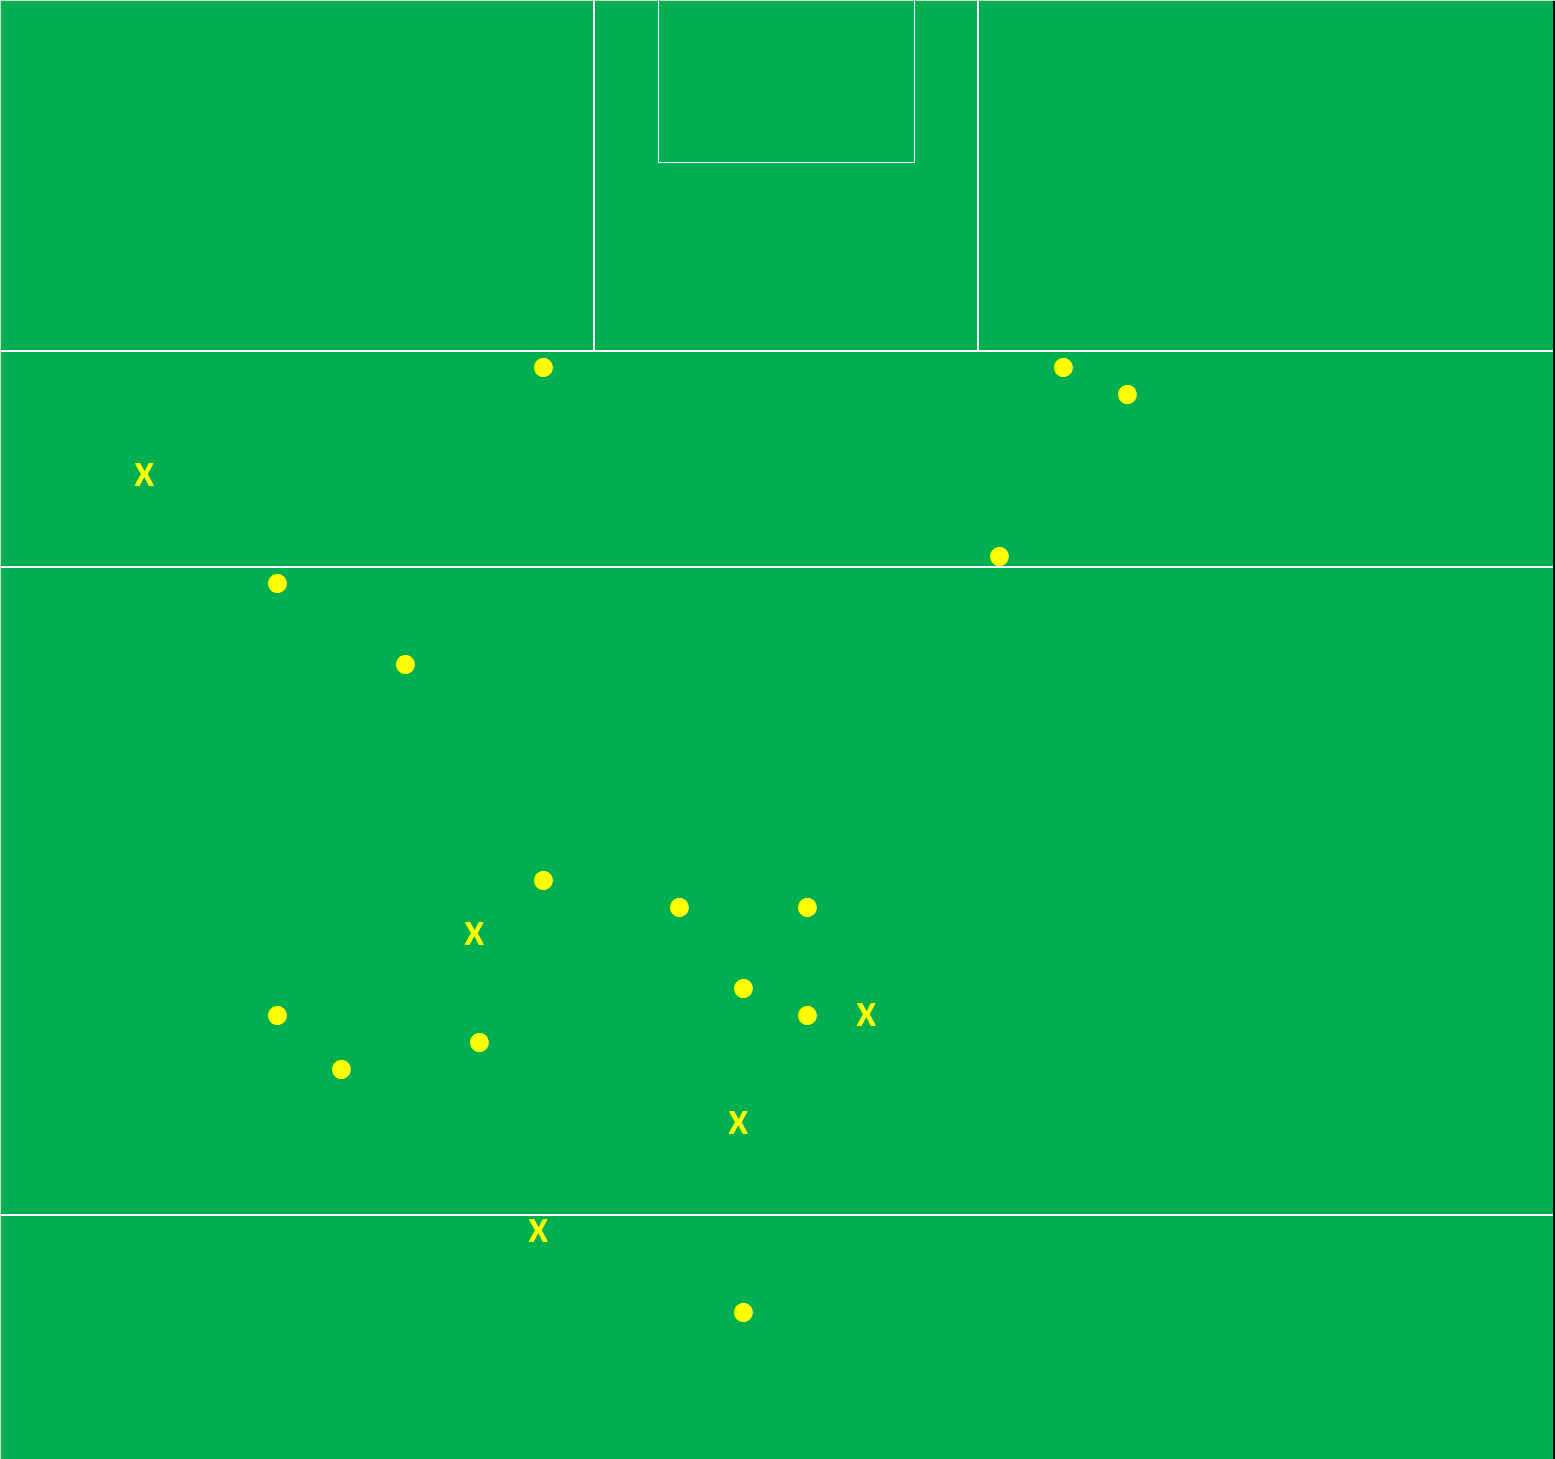
The above chart shows C O’Connor’s 2017 frees in yellow and using the same boundaries as the Rock chart above we can see that O’Connor is as good as ever “inside”. He has recorded very similar numbers to Rock at 95% (0 – 35 from 37) however he has definitely struggled “outside” recording a very poor (relatively speaking) 35%.
The two black dots on the chart are Jason Doherty’s attempts in the semi-final replay versus Kerry whilst the red cross is the free that O’Connor missed at the death in last year’s replay. As discussed at the time you would not have wanted anyone else standing over that free given his performance in the most pressurised of stages previously but it was definitely on the outer edge of his range.

Given his range limitations, his record this year and how comfortable Doherty looked the last day surely there’s a case for handing over the longer range attempts?

Apart from C O’Connor’s range – which does look to have a ready-made alternative should Mayo wish to employ Doherty – another area of concern would be frees from the right. Attempts from this area are sparse in the above chart (C O’Connor handed the ball to Moran for at least one free from this area against Kerry) as you would imagine C O’Connor is only too aware of his limitations. The issue was only exasperated by McLoughlin missing his two frees from inside the 20m on the right against Derry and Sligo.

Everyone knows O’Connor doesn’t want to take frees from wide right whilst the alternative, in McLoughlin, has, being kind, been shaky. Mayo know this is a weakness. We know it. You can be damn well sure that the Dublin defence knows it too.

Goal attempts

Mayo have been slightly below Dublin in their attempts per game at 4.2 however have been ahead of Dublin with a Conversion Rate of 42% (16 – 03 from 38 attempts). In the round that’s 5.6pts per game from both for their goal attempts (Dublin 5.60, Mayo 5.67).

Kickouts

One of the most eagerly anticipated duals will be the kickouts. How successful will Mayo be at getting their, what at times look extremely dicey, short kickouts away? Will they push up on Dublin? Once won how good will each team be at manoeuvring the subsequent possession into a shot and score?

Dublin Kickouts

See appendix for raw numeric tables

To date Dublin have gone short (see Note 2) on 66% (63 from 96) of their kickouts winning them all and managing to produce a shot from 73% which resulted in 3-27. That’s 0.57 points for every kickout won. Which is incredible. The returns for all other kickouts won is 0.45 – which doesn’t account for the kickouts the lost when the ball went past the 45 – whilst Mayo are a net (unlike Dublin they have lost 9 of their own short kickouts which has resulted in the opposition getting 0 – 03) 0.33 points per short kickout.

You have to imagine that Mayo will look to disrupt this wherever they can. To date 50% of the opposition’s kickouts have gone short in Mayo games with the opposition getting 0.31 points per kickout won. Mayo have gotten their hands on 10% (12 out of 120) of the opposition’s kickouts and when they do they go for goal – scoring 2 – 03 off those 12.
In the two finals last year Dublin had a similar split to this year in that 65% of their kickouts went short but Mayo had much more success keeping Dublin to just 0.12 points per short kickout won (0 – 03 off 25). And that’s without referencing the two short ones that Mayo won.

When we compare this to what Dublin have done to date in the 2017 Championship you have to believe that whilst Mayo may not be able to stop Dublin completely, and may not be able to clamp down as rigidly as they did last year, they should at least provide a much more substantial obstacle than Dublin have faced hitherto fore.

Mayo kickouts

Across both 2016 games Mayo lost five (17%) of their 29 short kickouts against Dublin including two at the death of the drawn game that surely had a part to play in Clarke being dropped for the replay. Clarke is now firmly ensconced as Mayo’s No.1 but the short kickout roulette can still occur at any moment as they have lost 9 across six different games.

Mayo have been somewhat fortunate in that none of those 14 lost short kickouts (5 against Dublin and 9 this year) have resulted in a goal – instead 0 – 08 has come from them – but it is only a matter of time. But Mayo will continue to roll that dice, even in the face of the Dublin pressure, as it has served them well overall. Whilst not as spectacular as Dublin’s 0.57 Mayo have returned 0.39 points for every short kickout won this year.

That does rise to 0.43 for their own kickouts that they win past the 45 however they only win 63% of these – for all the anxiety they give their fans on the short ones they are still winning 90%. It’s almost a no brainer. No matter how many palpitations they give you if your returns are the same on the short ones as on the longer ones but you win more of the short ones – well you keep going short. That is until you give away the inevitable calamitous goal … let’s hope for Mayo’s sake their luck holds for one more game.


Appendix

Table 1 – Dublin point attempts by player

Chart 1 – Dublin 2017 deadballs

Table 2 – Mayo point attempts by player

Table 3 – Dublin 2017 kickout overview

Table 4 – Mayo 2017 kickout overview

Note 1 – Pressure Index explanation; this is a subjective metric where the pressure applied to a shot from play is given a range from 0 to 3. Very generally
• 0 = no pressure applied,
• 1 = very little (e.g. a player running alongside but not tackling)
• 2 = strong (e.g. on the shoulder, catching the shooters eye by flying in to tackle)
• 3 = intense (e.g. a block, delivering a shoulder just as the shot is being taken)

It does come with a warning as it is subjective but seeing as there is only one person applying the metric you would expect that there would be a level of consistency when a large enough volume of shots is reviewed.

Note 2 – Kickout definition
• Short = ball landing inside the 45
• Mid = ball landing between the 45 & 65
• Long – ball landing past the 65

Again some judgement is required for contested balls around the 45/65 but on a large enough dataset any kinks will be lost to the averages

Dublin v Tyrone 2017 AI SF

September 5, 2017

Unfortuantely I haven’t been able to get to the game and at this stage there really is nothing I can add to the commentary that is already out there.

Instead I will just leave the raw outputs here in case anyone wants them

Game overview

Dublin attack

Shot Chart

Assists & shooting overview

Tyrone attack

Shot chart

Assists & shooting overview

Kickout overview

Mayo v Kerry 2017 AI SF Replay

August 28, 2017

Styles make fights. It’s an old adage but one that has endured because there is such an element of truth in it. How else to explain away how a game between two teams differs so much from one week to the next. In the drawn tie there were a total of 103 possessions with 47 turnovers. Kerry won the possession battle 54 – 49. Here there was a total of 87 possessions – with Mayo winning that battle 47 to 40 – and 31 turnovers. There was just 9 (9!!) turnovers in the first 35 minutes.

There are many minor elements throughout a game that will lead to such variances but the main variable that changes was in how Kerry set up. They started with an extra man back to cut off the kicked ball into Mayo’s forwards. The knock effect of this was that (a) Mayo’s kickouts were less frantic and (b) Mayo countered by playing more of a possession game. Both elements ensuring there were less turnovers.

More on the kickouts later but to my mind Mayo showed their collective football intelligence by changing their style to suit the additional element of Kerry playing one back. They played a game we don’t normally associate with them – keep ball. In the drawn game they had just the four (8% of all possessions) team possessions where there were at least 12 player possessions. Only one occurred in the first half of that game. In the replay that rose to eight (17%) with five in the first half.

Now 12 is an arbitrary number used to illustrate a point but that point is further bolstered by the fact that in the seven games prior to the semi-final that percentage (of team possessions with >12 player touches) was just over 8%. Mayo changed their natural game to play what was in front of them. And executed it with intelligence and no small degree of precision.

Mayo attack

A very clinical outing from Mayo scoring 0 -04 more than would have been expected from the shots they attempted. From an Expt Pts perspective the majority of the gains came from their goal attempts where three shots produced 2 – 00. Over the two games Mayo had eight shots on goal scoring 4 – 01 with an Expt Pts of +3.22 (Note; Expt Pts is less reliable on goal attempts than point attempts – as will be seen when we come onto Kerry). Even if they don’t manage to maintain the same high conversion rate Mayo will want to carry the volume of attempts through to the final as this was a weakness against Dublin last year. Over the 140 minutes of the replay and drawn game against Dublin they only manufactured three shots at goal returning 1- 01.

Another area that Mayo will be happier with now is their deadball striking. In the first game C O’Connor hit just
25% off a very low volume (0 – 01 from four; free x3 & 1 x 45) whilst his returns for the year badly lagged previous seasons (67% Success Rate & Expt Pts of -3.87).

Here he was 0 – 06 from seven attempts (86%) though with an Expt Pts return of +0.19 he would have been expected to score 0 – 06. His one missed attempt was again outside his range in being a 45 to the left of centre.

Jason Doherty’s two points (0 – 02 from 2; Expt Pts +0.66) were excellent – especially the first free from the left as Kerry had reduced the gap to four points at that stage by scoring the previous two and would have gotten a huge lift if Mayo had missed an opportunity through their main free taker being off the field.

Given O’Connor’s long distance travails the consummate ease with which he converted the second attempt, a 45, might give Mayo management a decision to make on the longer ones come the final.

In the drawn game Mayo’s point attempts were very good returning 52% (0 – 12 from 23; Expt Pts +1.03). They stepped back ever so slightly here returning 50% (0 – 08 from 16; Expt Pts of +0.78) but not to any degree that would be alarming.

Although their shooting form has waxed and waned throughout the campaign, and indeed throughout certain games, they have been very consistent at a macro level. In the seven games coming into the semi-final they were converting point attempts at a 49% clip (Combined Expt Pts of -0.40). In the two SFs here they were a combined 51% (Ext Pts of +1.83). In the final they will be looking to hold onto this 50% as a minimum – over the 140 minutes against Dublin last year they were 45% (0 – 14 from 31; Expt Pts -0.22). Marginal gains and all but … that uplift from 45% to 51% could be the difference in a one point defeat over 140 minutes and a one point victory in 70 minutes.

Kerry’s attack

Kerry’s numbers are an absolute contradiction with a very high conversion rate at 59% but a horrible Expt Pts of -5.29. The negative Expt Pts can be entirely explained through their goal attempts. They had four separate instances where they were through on goal, producing six shots, but came away empty handed. Of the six only Peter Crowley’s attempt – immediately after Mayo’s first goal – could be considered anyway clear cut. Geaney’s movement, in such a confined space, was nothing short of remarkable for the attempt that Boyle stopped on the line but it was far from what could be described as a “gilt edged” opportunity. Similarly the three attempts around the 45th minute that Clarke, and a plethora of defenders, kept out were, in the main, instinctive snap shots. Geaney had another attempt from out wide at the death but there again there was a whole host of Mayo bodies in the way.

Looking ahead to the final this will (should!) be an area of concern for Mayo. Although the quality of attempts here was low the six shots do add to the four Kerry had in the first game. We know how devastating Dublin can be when they scythe through teams – Mayo cannot afford to offer up four/five/six shots on goal to Dublin as they did to Kerry. (On the credit side of this argument is that Mayo only faced 11 goal attempts in their seven matches pre the semi-final and four in the two games against Dublin last year)

Leaving the goal attempts to one side Kerry were an incredible 74% (0 – 17 from 23; Expt Pts +1.97) on the remainder of the shots. We have seen that Mayo – on a combined 51% – had a combined Expt Pt close to Kerry’s with a 74% Success Rate. How so? Kerry achieved their 74% on very simple shots. The complete shot chart is in the appendix but below are all their 2nd half attempts – it comprises of goal attempts, tap overs and simple frees. There is only one shot from outside ~25metres. They went for goal too soon and too often.

Kerry struggled collectively the last day on their point taking (40%; 0 – 08 from 20) but coming into the semi-final they were on fire with a combined 71%. Yes the defences they faced were of a lesser variety than Mayo’s but they really should have been in a position to back themselves and keep the scoreboard ticking over.

Kickouts

Mayo (when compared with the outputs from the drawn game) wiped the floor with Kerry. They got 15 of their 23 kickouts away short with, unlike in the drawn game, quite a number coming under little or no pressure. That first game saw them score 1 – 06 from the 13 short ones that they won. They were less productive here scoring “just” the 0 – 04 on their own short kickouts but where they really dominated was on the mid/long range.

In total there were 19 kickouts that went past the 45 – with Mayo winning 13 (six on their own kickout to just one for Kerry and seven on Kerry’s kickout to just the five for Kerry). And when they won them they went for the jugular getting nine shots off and scoring 1 – 05. That’s 1 – 09 from kickouts both days. Why the turnaround? It is very hard to say watching TV footage but there appears to have been a convergence of Kerry getting caught between roles following their decision to play with an extra back plus Mayo going back to brass tacks (if you get a chance to re-watch Peter Canavan’s piece on Sky on how simple some of the “bunched” routines were it is well worth it).

One area that might give Mayo something to ponder is the fact that Kerry moved the ball quite well from their own short kickouts. Kerry won 11 converting eight to shots and scoring 0 – 06. Or 0.55 points per kickout won. In fairness this appears to be a blip as Mayo were giving up 0.28 points per short kickout in the prior eight games this year but still there are always those edges to be gained ….

APPENDIX

Game overview

Kerry’s shot chart

Mayo’s shot chart

x = missed, disc = score, yellow = deadball, black = 1st half from play, white = 2nd half, red = goal attempt

Mayo v Kerry 2017 AI SF

August 22, 2017

Kerry’s attack

Coming into the game one of the biggest disparities was in Kerry’s Conversion Rate versus what Mayo had allowed up to that point. In their three 2017 Championship games Kerry were running at a massively impressive 67% clip (both on total shots attempted as well as on point attempts from play) whilst Mayo were giving up 49% (a meagre 39% from play). Something had to give.

Kerry ended up with 2-14, a Conversion Rate of 50% and an Expt Pts tally of +0.37; not often you would consider letting in 2-14 a good result but Kerry’s returns were essentially average. On top of the overall lower conversion rate Kerry only hit 40% (0 – 08 from 20) on their point attempts. Advantage Mayo’s defence. Mayo did however give up eight shots from frees whilst Kerry created three clear cut goal opportunities (three shots on goal and Buckley’s converted follow up). So maybe more of an honourable draw with Mayo shading it.

Again coming into the game P Geaney & J O’Donoghue were the Kerry forwards’ standard bearers taking 40% of Kerry’s point attempts with a combined 64% Conversion Rate (Expt Pts of +4.44). Mayo managed to keep a lid on them as together Geaney & O’Donoghue “only” accounted for 30% of Kerry’s point attempts though their accuracy was as good as ever (0 – 04 from 6; 67% Conversion Rate & Expt pts of +1.44). That “keeping a lid” does come with a qualifier however; 0 – 03 came directly from frees where either were fouled.

There is plenty of commentary on the merit or otherwise of placing A O’Shea on Donaghy. Looking purely at the figures coming into the game Donaghy had taken just three shots in 124 minutes of action – scoring 1-2 mind – whilst also having eight primary and three secondary assists. Here in just over 70 minutes he scored just 0 – 01 but managed three shots and as can be seen from the assists table below he was Kerry’s puppet master with six primary and two secondary assists.

Kerry assist table

Undoubtedly the three shots were from less productive areas as Donaghy roamed given that Kerry had switched away from the high ball – but that is a minimal gain. Donaghy had a hand in all three goal opportunities and was the dominant Kerry presence in the forwards.

Mayo’s attack

Coming into the game Mayo had converted 53% of their shots (49% of point attempts) whilst Kerry had allowed 47% (40% on point attempts). Here Mayo had a combined 50% with 52% from point attempts. Advantage Mayo

Moran & O’Connor’s accuracy up front was excellent scoring 0 – 07 from 8 point attempts (88% Conversion Rate with an Expt Pts of +3.21) whilst overall, when including goal chances, they produced a combined 75% Conversion Rate (1 – 08 from 12) and Expt Pts of +2.37. You will go a long way to find better returns from a front two in such a big game.

Of course (there’s always a caveat!) if O’Connor & Moran were sublime, but Mayo were more or less bang on average, that means that there were issues elsewhere. The most noticeable was their deadball accuracy. They had three frees and one 45 with O’Connor only converting 1.

This is – worryingly for Mayo – now becoming a trend. Attached are all O’Connor’s deadball attempts this year with the ones in the Kerry game highlighted in black. Previously we highlighted that O’Connor has a definite arc outside of which he is vulnerable. That arc is as evident in 2017 as it ever was.

O’Connor 2017 deadball chart

Outside of Moran & O’Connor Mayo were 33% (0- 05 from 15; Expt Pts of -2.18) which is well down on how they were doing coming into the game (49% & an Expt Pts +0.97). It is hard to see Moran & O’Connor being as productive the next day but even if they do “slack” somewhat the expectation is that the rest of the team will improve.

Areas of improvement for the replay

As already intimated Mayo will need more from the supporting cast from play whilst also getting more than just 0 – 01 from whatever deadballs they have. But there’s also the issue of their discipline. They gave up the eight shots from frees but some of those were, to use a technical term, just dumb – especially in the first half. After going ahead by 1 -01 they gave up an off the ball free just outside the D and then managed to give up an extra 13m for a free out towards the wing that brought the ball right onto the D. Two simple tap overs, lead halved and Kerry were up and running. This doesn’t account for the one where Vaughan dived at O’Donoghue’s feet from behind.

As an aside this is not the first time that 13m was tagged on to an important free – the equalising score for Cork came from a free just outside the 45 that had had 13m tagged on. Gotta cut out the dumb sh*t in the replay.

Kerry? They will be disappointed in their shooting. Dropping from 67% on point attempts in the three previous games to 40% here can be somewhat accounted for by the conditions and the step up in defensive quality however quite a bit of the drop can be credited to Kerry themselves.

Kerry pt attempts from play – pressure/no pressure

Of their 20 point attempts 45% were taken under little or no pressure (white in the above chart) with just a 33% Conversion Rate. The three converted were by P Geaney, BJ Keane and K Young (with his right!!) but it was the ones that were missed (Moran & Donaghy x2, Maher & Morley x1) that Kerry will need to tighten up on.

Kickouts

The main focus during the game was on Mayo’s kickouts where Kerry applied huge amounts of pressure pushing up on the short ones in an effort to force Mayo to go longer. When Clarke did have to go longer Kerry lorded it winning 8 of 11 (73%) that passed the 45. But the reason for Kerry pushing up so hard was evident in what Mayo did with the short ones they won. Of the 13 they got away they managed to get ten attacks, eight shots and scored 1- 06. Unbelievable returns.

Playing the short one as much as Mayo do – 109 so far in their eight games – they’ll always run the gauntlet of the calamitous one. Kerry got a point from the one short kickout they intercepted; to date Mayo have lost 9 (8% of all short kickouts taken) and given up 0 – 07. A goal will eventually come but the credit balance is such that Mayo really should just accept when it happens (though doing everything in their power to prevent it) and stick to the plan.

One point to note is how Mayo fared over the two halves. In the first half Mayo only got 46% (6 of 13) of kickouts away short but in the second half that rose to 73% (8 of 11). The high press game is very tiring and a combination of Kerry fatigue, and Mayo alertness to what they were doing, ensured a much more productive second half

Less newsworthy in the post-game reaction was how good Mayo were on Kerry’s kickouts. When Kerry went past the 45 Mayo essentially broke even (Kerry won 7 getting 5 shots; Mayo won 6 getting 4 shots from same) but they were more impressive in what they did to Kerry’s short ones. Kerry had 11 but only converted three to a shot.

APPENDIX

Game overview

Kerry’s shot chart

Mayo’s shot chart

x = missed, disc = score, yellow = deadball, black = 1st half from play, white = 2nd half, red = goal attempt

Mayo assists

Mayo v Roscommon 2017 AI QF

July 31, 2017

For those new to the blog, or who haven’t been here for a while, please find a refresher on the definitions and how the numbers are compiled here

Team Possessions Attacks Shots Scores Exp Pts
Roscommon 56 43 24 2 – 09 13.23
Mayo 54 42 29 1 – 12 14.46

Both teams had similar possession volumes (56 for Roscommon to Mayo’s 54) as well as Attack Rates (77% v 78%). Once inside the 45 there was a divergence however with Mayo getting more shots off (29 to Roscommon’s 25).

As an aside 110 possessions is high but not inordinately so. Across 54 games in 2015 and 2016 I have eight with a higher possession total including the 2015 final between Kerry & Dublin which was played in similarly wet conditions. The Connacht game ths year between Mayo & Galway had 113.

Mayo attack

As ever we start with Cillian O’Connor. One of his less auspicious days with a total Conversion Rate of 27% (0 – 03 from 11; Expt Pts – 2.91) and just 14% from play (0 – 01 from 7; Expt Pts -1.94). In eight games in 2016 he returned a combined conversion rate of 62% (0 – 44 from 71) with an Expt Pts tally of -0.93.

As ever his appetite for work and willingness to offer himself up as an option were evident as he took four of Mayo’s last six shots (Durcan took the other two) from the 65th minute onwards. One of these shots was a free from well outside his range whilst the other three were central enough however two were taken under strong or intense pressure. Indeed five of his seven attempts from play were heavily pressurised. If you’re Mayo you probably want O’Connor on the ball at the death but the opposition are well aware of this.

In a down game for O’Connor Lee Keegan almost single-handedly dragged Mayo back from the abyss scoring 1 – 03 from just five shots (80% Conversion Rate; Expt Pts +3.25). The goal was a prime example of split second decision making that can win/lose/decide games.

In the above Keegan’s (5) marker Enda Smith (9) gets sucked into the kickout melee unaware that Doherty has claimed a mark. Keegan sees it and immediately sets off behind Smith’s back. McDermott (Roscommon defender pointing) sees the danger but it is too late. Keegan is gone with nothing but open road in front of him.

The remainder of the Mayo team were average scoring 0 – 06 from 13 (46% Conversion Rate; Expt Pts of +0.10). None of the starting trio of McLoughlin, A O’Shea or S O’Shea managed a shot whilst only Tom Parsons produced one off the bench. Mayo will definitely be looking for more of a threat here the next day.

On McLoughlin & A O’Shea the fact that they didn’t get a shot off does not necessarily mean they had a poor game. Both were very involved higher up the pitch as evidenced by the assist chart.

Roscommon’s defence may be slightly disappointed in the fact that 46% (11 of 24) of Mayo’s shots were taken under little or no pressure however on the flip side they will be delighted in where they forced Mayo to shoot from. Mayo never really got through them or around the side – the vast majority of shots were from “outside”.

Roscommon attack

At a macro level Roscommon’s shooting was very good with them scoring ~1.7 points more than the shots they attempted would normally return. But their Conversion Rate was essentially average at 46% and therein lies a problem. Their high returns from goal attempts (2 – 00 from 2) masks how poor their shooting in general was. They had 16 point attempts from play and returned just 0 – 05 (31% Conversion Rate; Expt Pts -2.42).

It is quite possible, in a one off game in the replay, that they will again create more goal chances than Mayo and convert them all. It is much more likely however that they will revert to the mean on their goal attempt conversions and thus they will have to rely more heavily on the point taking (be that from play of from frees).

One point to note here is the affect that Mayo’s defence had on Roscommon. Above we showed how Roscommon helped themselves by keeping Mayo, in the main, on the outer perimeter. Roscommon got inside Mayo more often (see shot chart below) but the Mayo defense deserves credit as they heavily pressurised 75% (12 of 16) of Roscommon’s point attempts. This included a ~35 minute period post the second goal where they heavily pressurised 8 of Roscommon’s next 10 point attempts leading to Roscommon returns of 10% Conversion Rate (0 – 01 from 10) with a combined Expt Pts of -3.31.

Now undoubtedly there was “scoreboard pressure” as Mayo overturned the 7 point deficit that led to poor decisions and execution in the shots but Mayo definitely aided those poor decisions.

75% heavy pressure is high and at times they walked a bit of a tightrope offering up six attempts from a free with four coming inside the 45 – but you’ll take a combined return of 41% ( 0 – 09 from 22) from all point attempts.

Kickouts

Very even all told. 20 kickouts went passed the 45 with both teams winning 10 each. As with the general trend mentioned above Mayo were better at converting those possessions to shots.

In an interview post the Cork game Rochford mentioned, in assessing A O’Shea’s impact, how he had aided smaller things such as winning the throw in. Here Roscommon not only won both throw ins but scored off both as well.

APPENDIX
Roscommon’s shot chart

Mayo’s shot chart

x = missed, disc = score, yellow = deadball, black = 1st half from play, white = 2nd half, red = goal attempt

Galway v Mayo 2017 Connacht

June 13, 2017

For those new to the blog, or who haven’t been here for a while, please find a refresher on the definitions and how the numbers are compiled here

Team Possessions Attacks Shots Scores Exp Pts
Galway 59 37 28 0 – 15 15.23
Mayo 54 39 29 1 – 11 16.89

Outside of a few extra possessions both sides had an eerily similar outing to that of their 2016 encounter. In that game Galway had a 64% attack rate (v 63% here), 78% shot rate (v 76%) and a 52% conversion rate (v 54%) though their Expt Pts at ~11 was much lower in 2016 than the ~15 points here. Part of that divergence in Expt Pts was the fact that in 2016 Galway scored 1 – 01 from their two goal chances; here they missed the one lone attempt, from a relatively acute angle, by Gary O’Donnell early in the second half. Those three shots alone equate to a swing of 2.79 Expt Pts.

What of Mayo? In 2016 they recorded an attack rate of 79% (v 72% here) and a shot rate of 66% (v 74%). A slight adjustment on how they moved the ball in that they got inside Galway’s 45 at a lesser rate but managed more shots whilst in there however ultimately the net result was the same – 29 shots in both games. Again there are similarities in their shooting; getting 12 scores in both games for a conversion rate of 41% whilst the Expt pts was -2.89 in 2017 and -3.20 in 2016.

The more things change the more they stay the same.

Mayo’s shooting

Mayo’s goal & deadball attempts were average – which given the prevailing conditions in Salthill was probably better than could be expected. They scored 1 goal from their three attempts whilst Cillian O’Connor returned 0 – 05 from his 7 deadball attempts with both misses coming from the 45 and beyond. As stated a reasonable, acceptable, standard day.

What let them down, badly, was their point taking. In total they scored 0 – 06 from 19 attempts for a conversion rate of 32% (Expt Pts of -2.78). You could blame the conditions – and they were very difficult – but Galway had a stat line of 0 – 07 from 17 (41% conversion rate; -0.30 Expt Pts. Basically average). You could also blame shot selection but again the Expt Pts shows that they should have returned 0 -10 from the shots attempted. Where they took their shots from was not an issue. There was a degree of difficulty added by the conditions but nothing that would compensate for such poor returns.

What adds to the fact that it was Mayo – and not some other criteria – is the fact that it mirrored 2016. Then Mayo scored 0 – 05 from 19 attempts (26% conversion rate; Ext Pts of -4.20). Mayo’s wider attacking malaise can be further illustrated by the fact that Cillian O’Connor had 10 attempts across the two games (26% of Mayo’s total) but only scored 0 – 01 (Ext Pts of -4.21). There’s no question re his fight, desire, willingness to go to the final minute but when he’s not converting Mayo will struggle as there is no one else to pick up the slack. Be that in a volume or an accuracy sense.

Galway’s defence

Can we attribute any of Mayo’s poor shooting to Galway’s defence? Surely it cannot be a coincidence that two of Mayo’s worst offensive displays – production wise – occurred against Galway?

Firstly Johnny Heaney was heroic here in blocking the two goal attempts – if either one of those go in the narrative (that dreaded word) around this game is very different. We can definitely chalk that up to the defence! Perhaps a more repeatable marker is that 13 of Mayo’s 19 (68%) point attempts were taken under strong or severe pressure. We have only just started to properly grade this pressure metric but as a reference Mayo recorded 50% & 44% “high” levels of pressure on Dublin’s point attempts in the 2016 final and replay. I’ve no doubt 66% will be on the high side come year end. Galway were excellent at pressurising the Mayo shooter.

… and yet it was not all down to Galway; Mayo missed all 6 attempts that were taken under little or no pressure ….

Galway’s shooting

Galway’s shooting from play was average; 0 – 07 from 17 attempts for a 41% Conversion Rate and an Expt Pts return of -0.30. Again given the condition this was quite good.

What was very good however was their deadball striking. In total they returned 0 – 08 from their 10 deadball attempts with Armstrong returning a very good 0 – 06 from 8 (including 3 from 3 on frees and an overall Expt Pts tally of +0.86; his excellent striking basically added 1pt above what an average day would have returned). Normally this would be a place to bash any defence that gave up 10 frees but in this instance 5 of those deadballs were 45s.
These can be attributed to player or defence on an individual basis but you are quite unlucky to give up 5 in a game where the opposition only has one shot on goal.

Kickouts

Both teams diced with death at times losing a combined 6 of their 26 short kickouts. Galway had the best ultimate return here however scoring 0 – 03 directly from these short kickouts. Mayo didn’t manage to return anything from the two Galway short ones they won.

14 (35%) of all the kickouts went past the 45 with honours being split evenly at 7 apiece. Unsurprisingly, given the high turnover rate within the game, only 3 of these 14 possessions progressed to a shot.

APPENDIX
Galway’s shot chart

Mayo’s shot chart

x = missed, disc = score, yellow = deadball, black = 1st half from play, white = 2nd half, red = goal attempt

Derry v Tyrone 2017 Ulster

May 30, 2017

For those new to the blog, or who haven’t been here for a while, please find a refresher on the definitions and how the numbers are compiled here

Team Possessions Attacks Shots Scores Exp Pts
Derry 44 38 26 0 – 11 13.81
Tyrone 53 49 42 0 – 22 23.59

That is as comfortable a game as a team is likely to have. Tyrone had 9 more possessions, 11 more attacks and a whopping 16 more shots than Derry. There are examples of such disparities where teams begin to rack up numbers towards the back end of a game, as the competitive edge has gone out of the encounter, but (sadly) this was not the case here. When the game was – notionally – at its most competitive in the first half Tyrone had six more attacks and eight more shots.

Derry shooting
Although each game takes on a life of its own there are some stark similarities to the 2016 meeting (see here) . Then the gap in Expt Pts was ~8.5pts. Here it was just under 10pts. Below is a straight lift from the 2016 game review …

Derry had 18 attempts for a point from play throughout the game; only two of those came from inside the prime scoring zone (extending from the D in towards the goal) with none at all in the 2nd half. Outside of this only one other point attempt came from inside the 20m line. Derry’s fundamental lack of attacking speed allowed Tyrone to set defensively which in turn aided them in repelling Derry away from the most productive shooting zones. Derry were then forced to try less productive long range efforts.

Below are the Derry point attempts from play in the first half. Their whole game shot chart is in the Appendix. You can’t keep doing the same thing over and over and expect different results.

Tyrone shooting
Tyrone had their way with the Derry defence returning a 92% Attack Rate & an 86% Shot Rate. This was off an already enlarged possession total. What will (should!) concern them however is – as ever – their shooting. A score of 0 – 22 looks very impressive but with the chances they had they should have scored more (total Ext Pts of -1.59) – the high score was as a result of volume rather than accuracy.

It could be argued that this view – that they had a poor shooting outing – is on the harsh end as the negative Expt Pts return includes their two goal attempts being blocked/saved as well as some simple frees being missed (Harte’s left footed effort in the first minute being a prime example). When we only review point attempts from play the view is somewhat rosier; 0 – 13 from 27 attempts (an average. conversion rate of 48% but a positive Expt Pts of +1.11 indicating harder shots were converted).

Dig a little deeper though and 21 of those 27 shots were taken under no – or very little – pressure (another indictment of the Derry defence). Yes the next day their frees, or goal chances, might compensate for more pressurised point attempts. But what happens in August when they don’t get a goal, get five frees instead of 11 in a game and their shooting comes under a lot more pressure?

Tyrone free taking
Free taking has been a problem for Tyrone. Over the last 3 Championships they have returned a poor 61% (0 – 39 from 64; Expt Pts -4.00).

Shots Scores Conversion % Expt Pts Vs Expt Pts
D McCurry 17 0 – 10 59% 11.24 -1.24
N Morgan 14 0 – 06 43% 7.05 -1.05
C McAlliskey 11 0 – 09 82% 7.84 1.16
R O’Neill 10 0 – 05 50% 8.15 -3.15
S Cavanagh 7 0 – 06 86% 5.22 0.78
P Harte 5 0 – 03 60% 3.50 -0.50

This 61% is in stark contrast to a combined 84% from Rock & C O’Connor over the last two years.

Against Derry they were 73% (0 – 08 from 11; Expt Pts -0.50). Again – in a game with little or no pressure – their shooting was below average. The one bright spark was Séan Cavanagh who hit 0 – 06 from7 (86%; Expt Pts +0.38). As the above table shows he hasn’t taken many frees of late but when he did he was accurate. That flowed through to this game.

As a designated starter, and given Tyrone’s travails of late, it may be best for Tyrone’s to leave him on the frees. If he does nothing more than hit average then this will be an improvement.

Appendix

Derry’s shot chart

Tyrone’s shot chart

x = missed, disc = score, yellow = deadball, black = 1st half from play, white = 2nd half, red = goal attempt

O’Connor & Rock from frees (Rd3 of league)

March 3, 2017

From an analysis and review standpoint I am forever railing against recency bias. This “railing” comes about however because of its pervasiveness. It’s an in-built near automatic response. And of course I fell into the trap myself.

Watching the Mayo – Roscommon game last week Cillian O’Connor missed a central free about 33metres out and I had immediate flashbacks to (a) a number of missed frees in the previous round against Kerry and (b) that missed free in last year’s All Ireland final.

Was this latest missed free a sign of some cliff having been reached? Was one of Mayo’s most consistent weapons beginning to malfunction? Of course not.

oconnor-post-rd3

In the three league games to date O’Connor has hit 79% of his frees. Well above the ~72% Championship average. On Expt Pts his tally is -0.39; he has basically scored what is expected. Now the argument could be made that someone with O’Connor’s reputation should be in positive Expt Pts territory. Fine. However we must always remember that the Expt Pts tally is based off Championship returns. Frees taken in (mainly) pristine weather on (mainly) pristine surfaces. O’Connor is fine. To be slightly off in the middle of the league is acceptable? For comparison Dean Rock is running at 75% conversion rate with an Expt Pts tally of -0.86.

rock-post-rd3

What I did argue however in last year’s All Ireland review is that O’Connor had an arc outside of which he was vulnerable (the missed free in the drawn All Ireland being right on this arc). Given weather, pitch conditions etc. it is fair to expect that arc to contract at this time of year and if we placed this contracted arc over O’Connor’s frees to date then I would suggest that arguement is still relevant. He has taken 6 frees on the edges of this constricted arc and converted 3 – 50% Success Rate. He has also missed his only 45.

So in conclusion – bloody recency bias!! But O’Connor is generally fine and still remains one of the most consistent free takers once within his range.