Archive for the ‘Connacht SFC’ Category

Mayo v Galway 2018 Connacht

May 15, 2018

For those new to the blog, or who haven’t been here for a while, please find a refresher on the definitions and how the numbers are compiled here

Team Possessions Attacks Shots Scores Exp Pts
Mayo 40 35 27 0 – 12 14.69
Galway 41 34 23 1 – 12 12.33

Overview

81 possessions in total is very low. In the 31 Championship games charted in 2017 only one – Carlow v Dublin at 79 possessions – came in lower whilst there were 106 total possessions in the 2016 meeting of these teams and 113 in 2017. The low possession total was very much aligned to the “new look” Galway which emerged during this year’s league campaign. In the five games involving Galway shown live on TV the possession totals were 77, 77, 78, 78 and 84.

Focusing on Mayo the positive is that they produced four more shots than Galway in a game where they, for various reasons, managed to get just over one full game from the two O’Connor brothers, Lee Keegan & Tom Parsons combined as well as playing with 14 men for more than half the game. The downside? Old failings, that have haunted them at various ports in this journey, are still evident. Poor conversion rates. Frees from the right. Ill-discipline.

Galway? Once again they won a game by hitting their marks. Progression from the league was maintained by continuing to condense games and converting at an above average rate. They may be concerned at just how long it took them to break down a team playing with 14 but somehow I doubt it. They played *their* game and won. Move on.

When Mayo had the ball

Overall Mayo were able to get shots off at a better rate than Galway (27 shots from 40 possessions as against 23 from 41 for Galway) however the execution was very poor. Perhaps surprisingly the majority of the damage was done *before* the sending off. Up until D O’Connor’s red card Mayo had attempted 12 shots scoring 0 – 05 (42%). Three of these points were from frees leaving their point attempts from play at a very poor 25% (0 – 02 from 8; Expt Pts of -1.971). When they went down to 14 their overall Conversion Rates improved to 46% (0 – 06 from 13; Expt Pts of +0.240). This improvement only dragged them up to average however and couldn’t “fix” the poor start.

This poor shooting is nothing new. Galway have proven to be kryptonite to Mayo’s forwards. In 2016 and 2017 combined Mayo were a very poor 28% (0 – 11 from 38) on point attempts from play. Here they were 38% (0 – 09 from 21).

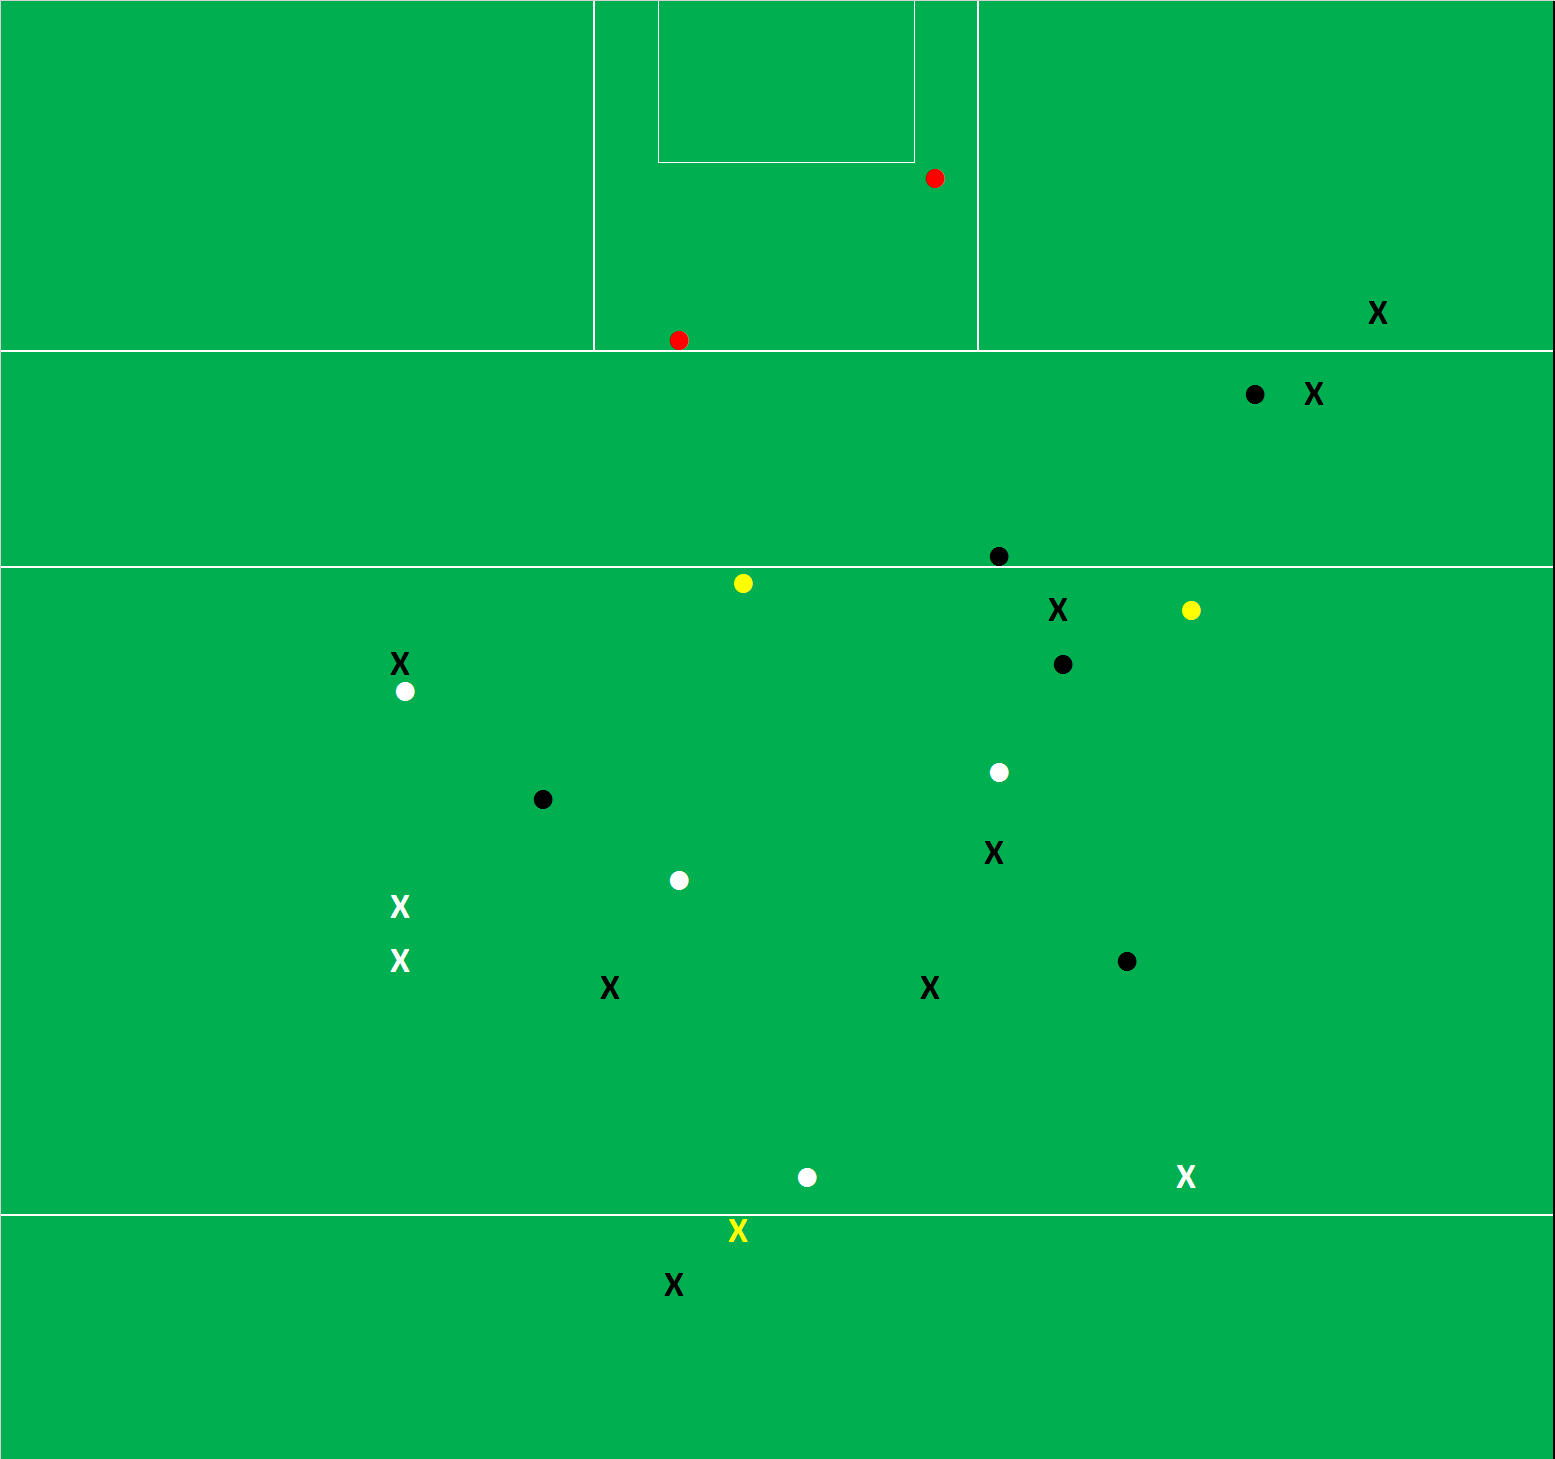
Below is the 2018 point attempts (in yellow) overlaid on the 2016 and 2017 shots (black). A couple of things are stand out. Lessons were learned in terms of shot location in that unlike the previous two years there were no wild shots this year from out on the wings (possibly aided by Galway’s inverted umbrella defence around the D allowing Mayo to get closer) however on the flipside Mayo were unable to get inside the cover during this year’s encounter.

From a shooting perspective no one stood out. Kevin McLoughlin converted his two shots from play but also missed two readily convertible frees from the right (he also turned down a difficult third free from the right wing on the 20m line).

A O’Shea had a quietly efficient game. He ended up with five primary assists for shots on goal – the next highest on either team was three.

The lack of offensive depth on the bench is a stick regularly used to beat Mayo with. They were already stretched given the above noted absences but again the last ~30 minutes were effectively left to the stalwarts. Those involved in the shots, from when Parsons went off and C O’Connor came on, were

Shots – A Moran x3, C O’Connor x2, K McLoughlin, C Boyle & J Durcan x1
Assists – K Higgins x3, A O’Shea & C O’Connor x2

Stretch it out to the 2nd last pass – where it mattered in the lead up to the shot – the players involved were C O’Connor x3, A O’Shea & J Doherty x.

Tough I know given that C O’Connor was a sub, and the defensive realignments allowed Higgins to move forward, but you want to see Loftus & Doherty more involved in this period when they were on the pitch. S Coen (though he won the free at the death) and P Durcan as well. One shot from J Durcan was the sum attacking involvement of the 2nd rank in that last 30 minutes.

When Galway had the ball

As intimated earlier the shape of the game was played out to Galway’s league template; low possessions high conversion rates.

The Conversion Rates, and high Expt Pts (+2.67), were aided greatly by McHugh’s two very good free kicks and them converting the only goal chance in the game. McHugh’s two frees were on the edge of the normal free taking range, or just outside it, and the conversion of both saw him bring his excellent league form (90%; 0 – 19 from 21 with an Expt Pts of +2.42) through to the Championship.

Galway’s point attempts were essentially average (47%; 0 – 09 from 19 Expt Pts of -0.416) with Comer (0 – 02 from 3) and Duggan (0 – 02 from 2) standing out.

Galway, unlike Mayo, managed to get a great kick from their bench. In the same period as noted above they got shots from P Cooke x2, S Kelly, E Brannigan and T Flynn after he came back on. Another player who stood out was Ian Burke. In his ~20 minutes on the pitch he was central to 1 – 02 of Galway’s late scoring providing a primary assist on three shots and was also the link man for Heaney’s goal.

Kickouts

Despite the intensity of the game, the nature of the teams, the pre-game talk about David Clarke’s kickouts, Galway’s league “form” in terms of eschewing short kickouts, this being the first televised Championship game under the new kickout rule – the kickouts were quite boring! The kickout team won 83% of the game’s kickouts. 62% (26 of 42) of kickouts were short with only one being won by the opposition.

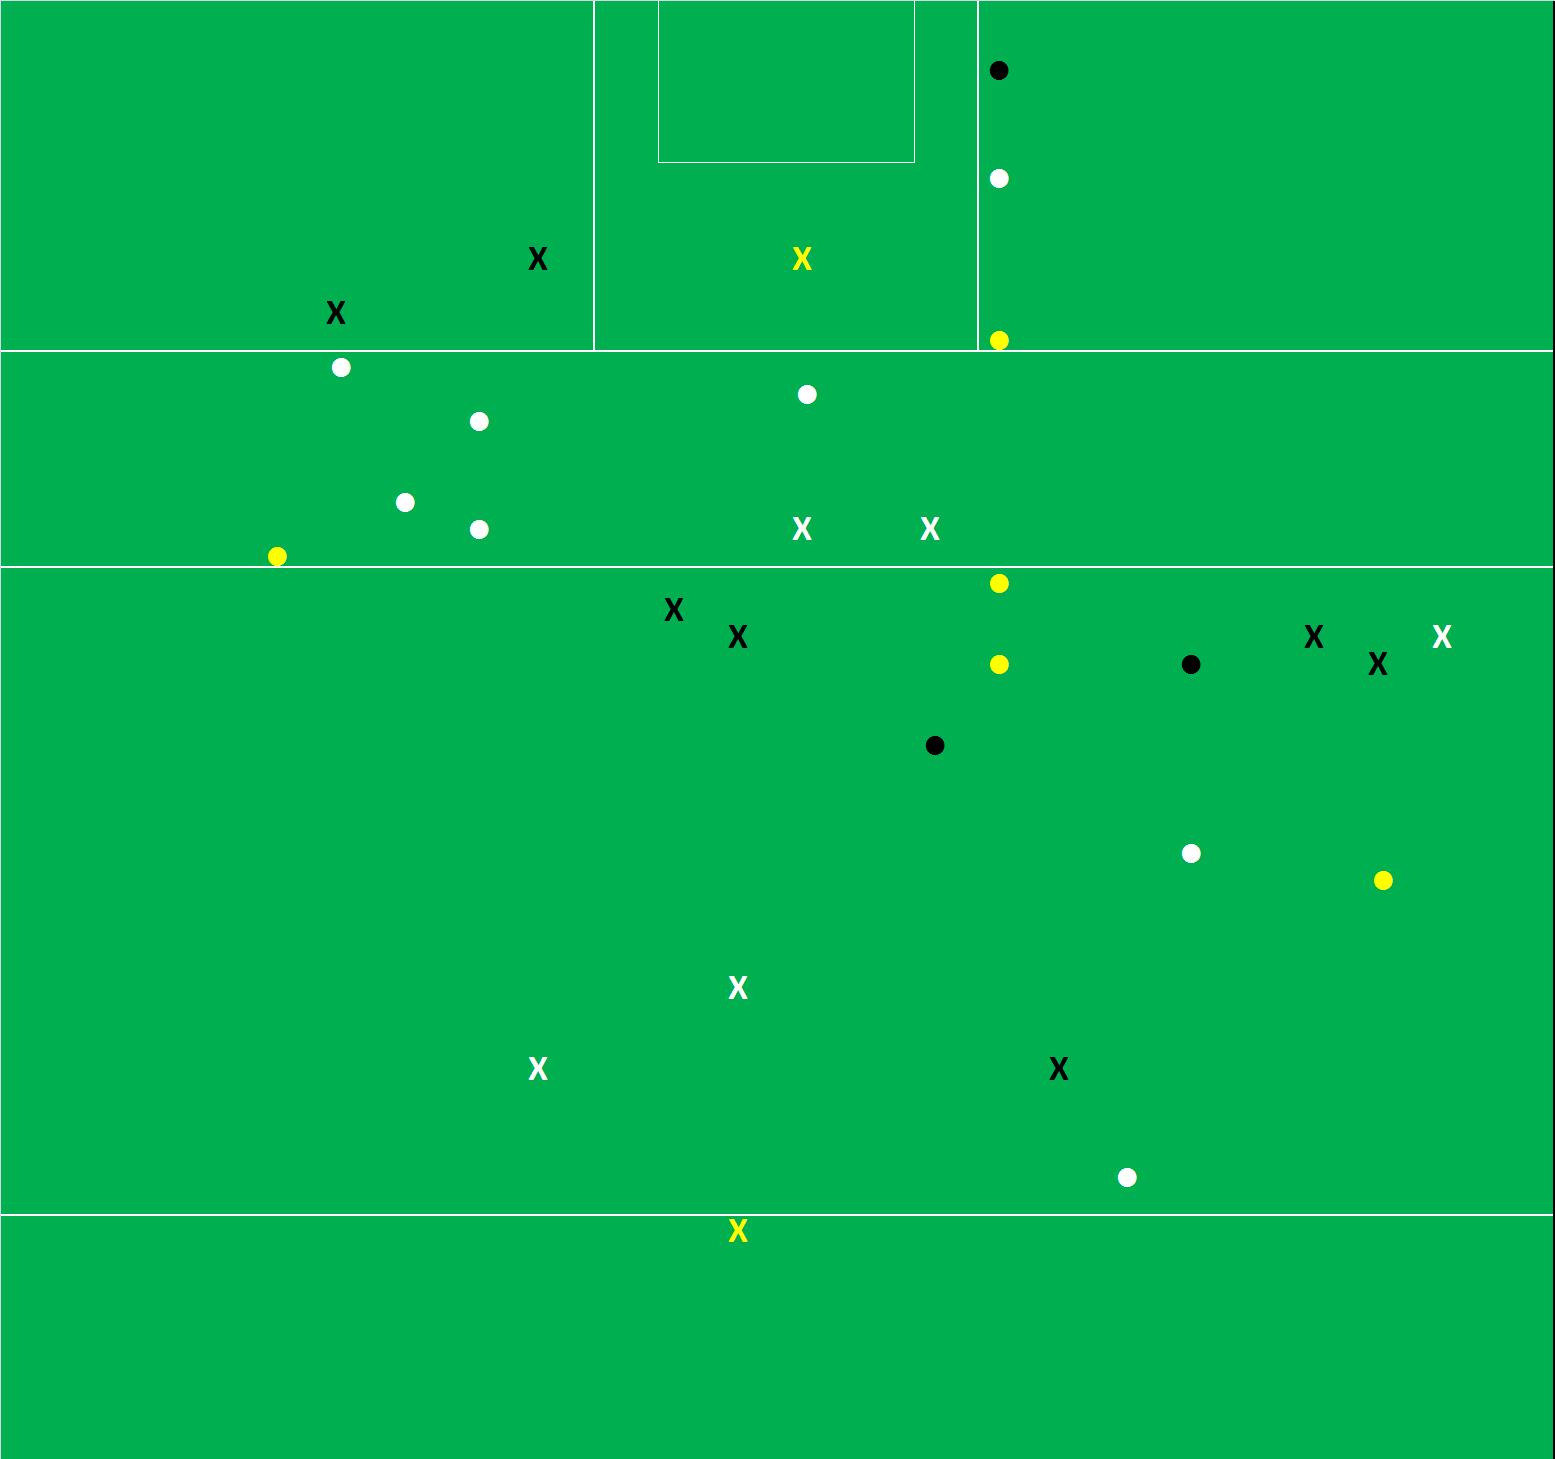
The red card played into this. Nine of Galway’s eleven second half kickouts went short to the left as Mayo dropped off. Looking at Mayo’s kickout chart it is perhaps surprising that Galway didn’t make hay on Mayo’s 2nd half kickouts. First half (black on the chart) were pulled mainly to Clarke’s left – Galway could easily have pushed up hard against 14 in the second half but didn’t manage to in any effective manner.

Galway v Mayo 2017 Connacht

June 13, 2017

For those new to the blog, or who haven’t been here for a while, please find a refresher on the definitions and how the numbers are compiled here

Team Possessions Attacks Shots Scores Exp Pts
Galway 59 37 28 0 – 15 15.23
Mayo 54 39 29 1 – 11 16.89

Outside of a few extra possessions both sides had an eerily similar outing to that of their 2016 encounter. In that game Galway had a 64% attack rate (v 63% here), 78% shot rate (v 76%) and a 52% conversion rate (v 54%) though their Expt Pts at ~11 was much lower in 2016 than the ~15 points here. Part of that divergence in Expt Pts was the fact that in 2016 Galway scored 1 – 01 from their two goal chances; here they missed the one lone attempt, from a relatively acute angle, by Gary O’Donnell early in the second half. Those three shots alone equate to a swing of 2.79 Expt Pts.

What of Mayo? In 2016 they recorded an attack rate of 79% (v 72% here) and a shot rate of 66% (v 74%). A slight adjustment on how they moved the ball in that they got inside Galway’s 45 at a lesser rate but managed more shots whilst in there however ultimately the net result was the same – 29 shots in both games. Again there are similarities in their shooting; getting 12 scores in both games for a conversion rate of 41% whilst the Expt pts was -2.89 in 2017 and -3.20 in 2016.

The more things change the more they stay the same.

Mayo’s shooting

Mayo’s goal & deadball attempts were average – which given the prevailing conditions in Salthill was probably better than could be expected. They scored 1 goal from their three attempts whilst Cillian O’Connor returned 0 – 05 from his 7 deadball attempts with both misses coming from the 45 and beyond. As stated a reasonable, acceptable, standard day.

What let them down, badly, was their point taking. In total they scored 0 – 06 from 19 attempts for a conversion rate of 32% (Expt Pts of -2.78). You could blame the conditions – and they were very difficult – but Galway had a stat line of 0 – 07 from 17 (41% conversion rate; -0.30 Expt Pts. Basically average). You could also blame shot selection but again the Expt Pts shows that they should have returned 0 -10 from the shots attempted. Where they took their shots from was not an issue. There was a degree of difficulty added by the conditions but nothing that would compensate for such poor returns.

What adds to the fact that it was Mayo – and not some other criteria – is the fact that it mirrored 2016. Then Mayo scored 0 – 05 from 19 attempts (26% conversion rate; Ext Pts of -4.20). Mayo’s wider attacking malaise can be further illustrated by the fact that Cillian O’Connor had 10 attempts across the two games (26% of Mayo’s total) but only scored 0 – 01 (Ext Pts of -4.21). There’s no question re his fight, desire, willingness to go to the final minute but when he’s not converting Mayo will struggle as there is no one else to pick up the slack. Be that in a volume or an accuracy sense.

Galway’s defence

Can we attribute any of Mayo’s poor shooting to Galway’s defence? Surely it cannot be a coincidence that two of Mayo’s worst offensive displays – production wise – occurred against Galway?

Firstly Johnny Heaney was heroic here in blocking the two goal attempts – if either one of those go in the narrative (that dreaded word) around this game is very different. We can definitely chalk that up to the defence! Perhaps a more repeatable marker is that 13 of Mayo’s 19 (68%) point attempts were taken under strong or severe pressure. We have only just started to properly grade this pressure metric but as a reference Mayo recorded 50% & 44% “high” levels of pressure on Dublin’s point attempts in the 2016 final and replay. I’ve no doubt 66% will be on the high side come year end. Galway were excellent at pressurising the Mayo shooter.

… and yet it was not all down to Galway; Mayo missed all 6 attempts that were taken under little or no pressure ….

Galway’s shooting

Galway’s shooting from play was average; 0 – 07 from 17 attempts for a 41% Conversion Rate and an Expt Pts return of -0.30. Again given the condition this was quite good.

What was very good however was their deadball striking. In total they returned 0 – 08 from their 10 deadball attempts with Armstrong returning a very good 0 – 06 from 8 (including 3 from 3 on frees and an overall Expt Pts tally of +0.86; his excellent striking basically added 1pt above what an average day would have returned). Normally this would be a place to bash any defence that gave up 10 frees but in this instance 5 of those deadballs were 45s.
These can be attributed to player or defence on an individual basis but you are quite unlucky to give up 5 in a game where the opposition only has one shot on goal.

Kickouts

Both teams diced with death at times losing a combined 6 of their 26 short kickouts. Galway had the best ultimate return here however scoring 0 – 03 directly from these short kickouts. Mayo didn’t manage to return anything from the two Galway short ones they won.

14 (35%) of all the kickouts went past the 45 with honours being split evenly at 7 apiece. Unsurprisingly, given the high turnover rate within the game, only 3 of these 14 possessions progressed to a shot.

APPENDIX
Galway’s shot chart

Mayo’s shot chart

x = missed, disc = score, yellow = deadball, black = 1st half from play, white = 2nd half, red = goal attempt

Galway v Roscommon 2016 Connacht final

July 13, 2016

For those new to the blog, or who haven’t been here for a while, please find a refresher on the definitions and how the numbers are compiled here

Team Possessions Attacks Shots Scores Exp Pts
Galway 50 39 27 0 – 13 12.81
Roscommon 49 38 22 1 – 10 11.17

Given the high scores Roscommon had racked up in their two Championship outings to date (01-15 against New York and 4-16 versus Sligo) it was somewhat surprising to see them produce five fewer shots than Galway. But we have to give the Galway defence some credit here. Yes the conditions on Sunday were atrocious but in their last three halves that defence has restricted the opposition to 9, 12 & 10 shots respectively for a combined Expt Pts of 16.36. That will not only keep you in games but win you a majority of them.

Attacking wise Galway are nothing if not consistent. Against Mayo they had 50 possessions with 25 shots and 13 scores. The goal the last day helped them outperform shooting wise (scoring 1-01 from your only two goal chances will do that) but here they produced an almost perfectly average display with a Conversion Rate of 48% and an Expt Pts return of +0.19. Perfectly average is in no way a slight given the conditions that those “average” returns were produced in.

Roscommon on the other hand had to overcome their relative lack of shots (as a point of reference they had 39 against Sligo and 33 against Kerry in the league semi-final) through accuracy with an Expt Pts return of +1.83. That statement is slightly misleading however as the positive return was entirely down to their goal (I say slightly as creating, and taking, goal chances is a huge skill in itself). When going for a point they were also bang on average with a Conversion Rate of 48% and an Expt Pts of +0.02.

Roscommon cannot rely on converting their only goal chance the next day. Their point taking has not been good enough to date (v Sligo their Conversion Rate was 52% with an Expt Pt of -0.02 when going for a point) to overcome another small shot volume – they need to create more opportunities. Galway on the other hand will look to continue doing what they do – produce average shooting displays, convert any goal chance that comes their way and play suffocating defence.

We saw in the Cavan Tyrone games that replays can take on an entirely different characteristic to the original game. Evidence to date suggests that Galway’s template is repeatable – can Roscommon “up it”?

Roscommon Kickouts

Roscommon had 21 kickouts winning 20 with the only loss being one that went over the sideline. It was surprising, from a number of aspects, to see Galway so passive on the Roscommon kickout. We know from previous games that the Roscommon kickout can take chances (end of the Monaghan league game, 3 kickouts picking wide open Sligo men the last day) and with the wind behind them in the second half I fully expected Galway to apply a full press and hem Roscommon in. Also Roscommon scored 1-08 from their short kickouts against Sligo. Galway should have been aware of their ability to use these possessions and tried to disrupt it – again here they scored 0-04.

Galway didn’t push up and indeed also gave Mayo the kickout. It is something they are obviously comfortable doing and, in the main, the results to date have borne fruit but you sense that their midfield would be better utilised by contesting long Roscommon kickouts which are obviously Roscommon’s least favoured option. The press would also force Roscommon to continue taking dicey short kickouts if they wished to avoid a midfield battle.

Roscommon’s anomalies

Attacking from deep
Roscommon’s attacking from deep was very poor. As noted above they scored 0 – 04 from 18 short kickouts (0.22 pts per possession) but were an abysmal 0-01 from 16 turnover possessions (0.06 pts per possession) that started inside their own 45m line.

Generally you would expect Galway to be more defensively set on the kickouts than the turnovers. Why did Roscommon struggle so much here? (There was a similar split against Sligo with Roscommon returning 0.61 pts per possession from their short kickouts and 0.40 pts from deep turnovers however that return from the kickouts was phenomenal rather than the attacking play from deep turnovers being poor)

I thought perhaps it may have had something to do with their slow build up play. The thinking being that they were set from kickouts and were used to the various player movements but that Galway’s defensive wall somehow stymied them on turnovers. Not so; there were on average 8.35 player touches per possession on their own kickout versus 9.60 for the deep turnovers. A gap yes – indicating slower build up play – but easily explained by the first recipient of the kickout being able to travel at least to half way.

It’s an odd one and given that there’s no simple explanation an area you would expect Roscommon to improve the next day simply by regressing to the mean.

Centrality of second half shooting

Roscommon point attempts from play
Roscommon shooting from play (v Gal)
x = missed, disc = score, black = 1st half from play (with wind), white = 2nd half (against wind)

The above chart shows Roscommon’s point attempts. Firstly we can see how clean Galway kept the sector immediately in front of goal. Secondly there is quite the variation by half in where Roscommon shot from. In the first half they were willing to launch the ball from difficult angles. In the second they were much more conservative whilst being poorer. From this juncture it is hard to tell if that second half conservatism was purely driven by the conditions or if it does indeed show a willingness to take the less certain shot on in such a close game.

What we can say is that there was no such divergence on Galway’s shooting. We need to acknowledge that they had the wind when the pressure was at its most intense in the second half but the lack of change is interesting in itself.

Galway point attempts from play
Galway shooting from play (v Ros)
x = missed, disc = score, black = 1st half from play (against wind), white = 2nd half (with wind)

Mayo v Galway 2016 Connacht

June 21, 2016

For those new to the blog, or who haven’t been here for a while, please find a refresher on the definitions and how the numbers are compiled here

Team Possessions Attacks Shots Scores Exp Pts
Mayo 56 44 29 0 – 12 15.20
Galway 50 32 25 1 – 12 10.99

As a whole Mayo’s shooting was very, very, poor returning 3 points less than would be expected. But even that does not tell the whole story.

Due to Jason Gibbons injury there were five extra minutes played at the end of the first half. During the last ten minutes of that half (from the 30th minute to half time) Mayo had nine possessions turning all nine into an attack and scoring 0 – 06 from 8 shots. A 10 minute blitzkrieg with an 89% Attack Rate, 88% Shot Rate, 75% Conversion and an Expt Pts return of +2.14. Essentially unstoppable. Either side of that 10 minute purple patch however was atrocious (or as Michael Lyster would say “wogious”. What a wonderful word!).

In the first 30 minutes Mayo had 20 possessions with an Attack Rate of 75% (15 of the 20) and a Shot Rate of 80% (12 of the 15). Both are in and around the average so nothing untoward there. However their shooting returned a paltry 17% (2 points from the 12 shots) and an Expt Pts tally of -4.15.

Galway’s defensive performance must be given some credit as apart from O’Connor’s first shot in the 3rd minute – that led to a pointed 45 – nothing from that first 30 minutes was from the central scoring zone. But even accounting for that you would have expected one, if not two, of the four uncontested shots that O’Connor & McLoughlin attempted to go over.

At least they were creating shooting opportunities in this period. In the second half Mayo had just nine shots at goal with one of those being almost an afterthought of an attempt from a sideline. Mayo managed just three shots from play all half with none after the 50th minute when they were chasing the game. As an aside Mayo did produce one half of football with less shots from play than this previously – the first half against Galway last year.

Mayo never managed a shot on goal either which, in the 20 Championship games I have for Mayo from 2012, is only the third time this has happened. The other two instances were also in Connacht games – 2014 against Roscommon and again last year’s outing against Galway. Looking at the 2015 game in light of this game, and specifically the poor shot volume and goal chance creation in both, maybe Galway just know a thing or two more about their near neighbour than we have given them credit for?

Galway

Galway also struggled to move the ball with only 64% of their possessions resulting in an attack. This was the 6th game completed so far in 2016 and for reference the other 10 returns were 76% & 77% (Derry – Tyrone), 84% & 80% (Cavan – Armagh), 86% & 70% (Monaghan – Down), 84% & 73% (Roscommon – Sligo), 83% & 77% (Dublin – Laois). 64% is a very poor return.

One of the reasons for such a poor Attack Rate was how and where Galway picked up the ball. Of their 50 possessions only 10 were picked up outside their own 65m line – 3 from Mayo kickouts, 6 from turnovers between the 65s and 1 from a shot that was re-gathered. By contrast Mayo picked up 21 such possessions (9 x Galway kickouts, 10 x turnovers received outside their own 65 & 2 x shots retrieved). Galway had much more to do with the ball to create an Attack.

Unless something dramatic happens it is easy to foresee something similar happening the next day against Roscommon. Roscommon will go short with their kickouts and Galway will let them have it. If Galway retreat as they did here, and try to turn over the ball once they engage Roscommon, they will again have to once again cover a lot of ground with the ball.

If you have a low attack rate then you had better have excellent production from what you do get. And Galway did just that – especially in the second half where they scored 1 – 06 from just 10 shots.

Like Mayo they had a very poor opening 20 minutes scoring 0 – 02 from 11 shots with a combined Expt Pts of -2.23. Thereafter however their shooting was immense; 1 – 10 from just 14 shots (a Conversion Rate of 79% which if sustained for 70 minutes would be one of the best recorded) and an Expt Pts tally of +6.44. Unlike Mayo they manufactured two good goal scoring opportunities taking 1 – 01 from them. Are these figures repeatable? Over an extended period of 5 or 6 games then you would have to emphatically say no but in a one off performance? Absolutely

Cillian O’Connor

A quick note on O’Connor’s day. My love for O’Connor – especially from deadballs – is well known but overall he did not have a good game here. His deadball striking was quite good hitting 6 from 8 (75%) with an Expt Pts return of +1.22. One of hi misses could be excused as it was a sideline attempt however the other was a surprising one – for him – from straight in front of the posts. Overall though his deadball striking was its usual self.
His shooting from play however was poor. He had five shots missing all five with three of those attempts not having any Galway defensive pressure applied.

Appendix

Shot Charts

Mayo’s shooting
Mayo shooting (V Galway 16)

Galway’s shooting
Galway shooting (V Mayo 16)
x = missed, disc = score, yellow = deadball, black = 1st half from play, white = 2nd half, red = goal attempt


Players with >= 3 shots from play

Shots Scores Success Rate Exp Pts
C O’Connor (Mayo) 5 0 – 00 0% 2.61
P Conroy (Galway) 5 0 – 02 40% 1.90
D Cummins (Galway) 3 0 – 01 33% 0.99
E Brannigan (Galway) 3 0 – 03 100% 1.07

Roscommon v Sligo 2016 Connacht

June 14, 2016

For those new to the blog, or who haven’t been here for a while, please find a refresher on the definitions and how the numbers are compiled here

Roscommon scoring 4-10 in the second half lends the game to the old “game of two halves” analysis. However whilst the scoreboard was lopsided in Sligo’s favour at half time (2 – 08 to 0 – 06) it was more a case of unsustainable Sligo accuracy – and no little profligacy from Roscommon – rather than anything in the game per se that created this gap.

1st Half

Team Possessions Attacks Shots Scores Exp Pts
Roscommon 27 21 15 0 – 06 10.64
Sligo 24 19 14 2 – 08 9.27

Roscommon had more attacks, one more shot and essentially easier shots than Sligo in that first half. I say easier as Roscommon had an Expt Pts value of ~1.5pts greater than Sligo despite only having that one extra shot. Scoring 2-08 from 14 shots, including 0-08 from 11 point attempts with 3 of those coming from outside the 45, will put a rosy tint on any game plan. But as can be seen from the above table, and the shot charts below, the signs were there. Sligo’s shooting was long range leading to lower Expt Pts. Roscommon’s was closer with 10 attempts from inside the 20m line. In a prelude to what happened in the second half Roscommon had three goal attempts. Unlike the second half they returned nothing from them.

2nd Half

Team Possessions Attacks Shots Scores Exp Pts
Roscommon 31 28 24 4 – 10 17.57
Sligo 21 14 11 0 – 05 5.71

Looking at the 2nd half numbers Sligo – shooting wise – did not fall off. They just returned slightly below what was expected. Where they did fall off was in ceding possession, and ultimately attacks, to Roscommon.

Roscommon had 10 more possessions in that second half and an incredible 14 more attacks. Sligo could not stop Roscommon coming at them in wave after wave. Sligo were at the very least co-authors in their own downfall through poor kick passing – I counted 8 kick passes (& 1 hand pass) going to a Roscommon man – and poor kickouts. Roscommon won seven of Sligo’s 18 kickouts in that second half. This was actually an improvement on the first half when Roscommon won six of Sligo’s nine kickouts. But again the signs were there.

Roscommon shooting

For all that Roscommon still had to use this possession. Their first half shooting was poor however in the second half they had a Dublin-esque seven shots on goal scoring 4-01. It was this that catapulted them ahead of Sligo as their point taking was average; 0-08 from 15 shots (53% Conversion Rate) with an Exp Pts tally of 7.14

We have been underestimating this Roscommon team all year but in the battles to come it is doubtful that they will have such a numerical advantage in terms of possessions & attacks. Can they continue to create this volume of goal attempts (10!! here)? If not can they up their point taking percentages which were average here (Conversion Rate of 48% and a total Exp Pts of -0.25)?

Kickouts

After the league semi final against Kerry I wrote the below paragraph

One final point to note on Roscommon is their short kickout routine. Short kickouts going astray is an occupational hazard for teams that employ the tactic but it was a short kickout that effectively cost them the game late on versus Monaghan and here again they found a Kerry man wiiiide open inside their own 45 on a short one (different keepers on both occasions). This doesn’t count the numerous instances that I visibly winced as a defender received the ball with the attackers bearing down on him.

Short kickouts are fine – and will go astray – but Roscommon seem to flirt with danger more than most.”

I was visibly wincing again here. Roscommon won 86% of their own kickouts however this was entirely due to the nature of those kickouts. The 18 they won all went short. They went past the 45 on three occasions and lost all three. Worse again all three went directly to a wiiiide open Sligo man who was immediately on the attack.

Those three losses happened in the first half in the midst of six shorts ones – two of which landed on Roscommon players under immense pressure. So when the battle was raging Roscommon lost three of their opening nine kickouts in alarming circumstances and won two in an incredibly dangerous fashion.

The flip side of this is that the remaining 12 passed off without any major incident helping them build the possession & attack momentum mentioned earlier. Roscommon scored 1-06 directly from those 12 possessions.

It is the eternal short kickout risk/reward conundrum. We have seen numerous instances of late where short kickouts have gone disastrously wrong. Roscommon play with the tiger’s tail more than most but yesterday it worked out once those early glitches were ironed out. But in games to come what happens when they get a full court press from the opposition? Will they continue to go short under pressure? Sligo got 0-02 here – will an early goal rattle them enough to change?

Roscommon’s kickouts, and what they do when they are confronted with a full press, is definitely one of those moments I am looking forward to in this year’s Championship.

Appendix

Shot Charts

Roscommon’s shooting

Roscommon shooting (V Sligo 16)

Sligo’s shooting
Sligo shooting (V Rocommon 16)
x = missed, disc = score, yellow = deadball, black = 1st half from play, white = 2nd half, red = goal attempt


Players with >= 3 shots from play

Shots Scores Success Rate Exp Pts
C Devaney (Roscommon) 7 0 – 03 43% 3.86
P Hughes (Sligo) 6 0 – 05 83% 2.28
D Shine (Roscommon) 5 0 – 02 40% 3.61
D Keenan (Roscommon) 4 0 – 03 75% 3.03
C Cregg (Roscommon) 4 0 – 00 0% 2.34
D Smith (Roscommon) 3 0 – 02 67% 2.63
N Murphy (Sligo) 3 0 – 02 67% 1.22

Sligo V Roscommon 2015 Connacht Championship

June 22, 2015

For those new to the blog, or who haven’t been here for a while, please find a refresher on the definitions and how the numbers are compiled here

Overall

Team Possessions Attacks Attack % Shots Shot % Scores Success % Weighting
Sligo 52 37 71% 28 76% 15 54% +1.531
Roscommon 55 39 71% 28 72% 13 48% -0.801
Avg 37.0 28.7 77.7% 14.7 51.2%

A relatively even set of returns. Though Roscommon had three more possessions (in the main due to their kickout supremacy) both teams transferred the ball into an attack and a subsequent shot at very similar rates. What difference there was came in the form of Sligo’s superior shooting – and the goal.

Shots from Play

Team Shots Scores Success % Weighting
Sligo 22 11 50% +1.599
Roscommon 22 10 45% +0.023
Avgs 21.4 9.7 45.3%

Adrian Marren had an absolute stormer scoring 0–04 from 5 attempts; two each on his left and right and all from outside the 20m line.

Outside of Marren there will be areas of concern. Although the rest of the team’s point attempts were average (44% Conversion Rate with a weighting of -0.126) you get the sense that average wont suffice against Mayo whilst the only goal attempts Sligo created were the penalty and a Kelly snapshot from a rebound. They didn’t really manufacture goal chances.

Roscommon had their Marren in Cathal Cregg who also scored 0-04 from outside the 20m line but none of the other forwards stood up (E Smith & S Kilbride combined for 0-02 from 9 attempts). Whereas Sligo had the two Breheny’s & Hughes contributing 0–02 each Roscommon relied on Cafferky & Daly coming up from the back to bolster their scoring.

Shots from deadballs

Player Shots Scores Success % Weighting
A Marren (Sligo) 6 4 67% -0.068
C Murtagh (Roscommon) 3 2 67% -0.229
F Cregg (Roscommon) 1 1 100% +0.397
D O’Malley (Roscommon) 1 0 0% -0.389
D Murtagh (Roscommon) 1 0 0% -0.603
team avgs 7.2 4.9 68.7%

Marren’s free taking was below average getting the two close in and converting one of three from >= 35m. His most important contribution was the penalty however. In the last three years ~82% of penalties have been converted however in a weekend when Munnelly missed one for Laois, as did Gollogly for Monaghan, their conversion should never be taken for granted.

Slight bit of a quirk in Roscommon’s deadballs in that they all came from the left. Four players combined for a Conversion Rate of 50% (4 from 6) and a weighting of -0.824. Hindsight is a great thing but in a game when you are behind, and time matters, bringing your goalie up to attempt an outrageously difficult 45 was the not the greatest idea.

Kickouts

Sligo’s kickouts Won % Turned into an attack % Shot %
Sligo 16 64% 10 63% 9 56%
Roscommon 9 36% 5 56% 3 33%
Roscommon’s kickouts Won % Turned into an attack % Shot %
Sligo 4 17% 2 50% 1 25%
Roscommon 19 83% 16 84% 11 58%

Roscommon lorded their own kickouts winning 83%. It could have been even more impressive as they gained possession on 18 of their first 19 kickouts but the introduction of Gilmartin seemed to add some beef to Sligo’s midfield.

Given Roscommon’s dominance it was no surprise to see Sligo going short. Almost one in three (8 of 25) of their kickouts went short whilst Devaney was also very good at finding men when they came open. Sligo won 8 of the 17 kickouts they sent past the 45 – 5 of those 8 were won relatively cleanly.

Turnovers

Team giving up the ball Pass In the Tackle from a Shot Other
Sligo 12 6 1 6
Roscommon 18 5 3 4

Roscommon’s passing was poor with 18 going astray including four passes into the forward line where the forwards lost a contested ball.

Sligo were much neater only giving the ball away in the pass 12 times

Shot Charts

Sligo’s shooting
Sligo shooting (V Roscommon 15)

Roscommon’s shooting
Roscommon shooting (V Sligo 15)
x = missed, disc = score, yellow = deadball, black = 1st half from play, white = 2nd half from play,

Players with >= 3 shots from play

Shots Scores Success % Weighting
C Gregg (Roscommon) 6 4 67% +1.589
E Smith (Roscommon) 6 2 33% -0.538
A Marren (Sligo) 5 4 80% +2.063
M Breheny (Sligo) 4 2 50% +0.398
P Hughes (Sligo) 4 2 50% -0.076
C Breheny (Sligo) 3 2 67% +0.757
D Kelly (Sligo) 3 1 33% -0.422
S Kilbride (Roscommon) 3 0 0% -1.115

Galway V Mayo 2015 Connacht Championship

June 18, 2015

For those new to the blog, or who haven’t been here for a while, please find a refresher on the definitions and how the numbers are compiled here

Overall

Team Possessions Attacks Attack % Shots Shot % Scores Success % Weighting
Galway 43 26 60% 21 81% 10 48% -1.726
Mayo 47 29 62% 22 76% 14 64% +0.688
Avg 37.0 28.7 77.7% 14.7 51.2%

First up some housekeeping – neither the own goal nor the Moran point in the first few minutes are represented in the above numbers (apart from a possession for Mayo on Moran’s point). Neither was a shot – irrespective of what Mayo fans might have you think!

Overall it was a poor enough game – 89 possessions is low. Whist this can be indicative of a defensive game, where both teams hold onto the ball probing the defences looking for an opening, this was not the case here. Both teams only managed to get ~60% of their possessions in to an attack not because of great defence but due to poor passing.

Mayo’s shooting looks exceptional with a Conversion Rate of 64% but this is almost entirely down to the volume of easy frees they had. And the very low volume of shots they took.

Shots from Play

Team Shots Scores Success % Weighting
Galway 15 5 33% -1.798
Mayo 9 6 67% +2.348
Avgs 21.4 9.7 45.3%

Galway had four attempts at goal scoring 2 – 00 however only converted 27% (3/11) of their point attempts. In the second half they only had three attempts at a point with all coming from inside the 20m line – they missed all three.

However sparse that may be Mayo only attempted 9 shots from play with the sub Ronaldson being the only player to try more than one. They didn’t manufacture a goal chance either (O’Shea was dispossessed prior to the own goal). I know they garnered a lot of frees from their attacks but still ….

From a Mayo perspective those four goal attempts will be a concern. Below is a snapshot just before Cummins’ fisted attempt at the back post. Although the effort came from a punt, and was not constructed per se, there is still no way the opposition’s main shooter should be so free four points up with 10 minutes to go

PhotoGrid_1434487024276

Shots from deadballs

Player Shots Scores Success % Weighting
C O’Connor (Mayo) 12 8 75% -1.039
K McLoughlin (Mayo) 1 0 0% -0.621
P Conroy (Galway) 3 3 100% +0.339
G Sice (Galway) 2 2 100% +0.227
D Comer (Galway) 1 0 0% -0.494
team avgs 7.2 4.9 68.7%

In the Derry – Down game there were 19 shots from deadballs. Ulster football eh?

Of the eleven frees that Mayo attempted A O’Shea was fouled five times (Hanley x3, O’Donnell & Duane x1 each). It was brainless from Galway at times as given O’Shea’s position the frees were always going to be tap overs. Frees in front of the goal are converted at ~94%.

O’Connor may have scored 0 – 08 from frees but he actually had quite a poor day. Six of his scores were from Sector8 in front of the goal with a further one coming from inside the 20m line. He attempted 5 shots from outside the 20m line missing 4.

So even though he had a high score he gets a poor weighting due to the mix of his frees – six simple ones but missing 3 “gettable” (we won’t count the sideline attempt as “gettable”)

Galway got the frees they were expected to and missed the one 50:50 – evens out as an average game.

Kickouts

Galway’s kickouts Won % Turned into an attack % Shot %
Galway 13 62% 6 46% 4 31%
Mayo 8 38% 5 63% 4 50%
Mayo’s kickouts Won % Turned into an attack % Shot %
Galway 5 29% 3 60% 3 60%
Mayo 12 71% 7 58% 6 50%

Although Galway won the majority of their own kickouts they had great difficulty in moving the ball into an attacking position. Ten of their 13 wins (on their own kickout) happened past the 45 – but they only managed to convert three of those into shots.

Mayo went short on three of their first four kickouts but then seemed to switch – the next 14 went past the 45. Of those 14 Mayo won 9 helping themselves to 0 – 04 directly from those possessions.

Shot Charts

Galway’s shooting
Galway shooting (V Mayo) 15

Mayo’s shooting
Mayo shooting (V Galway) 15
x = missed, disc = score, yellow = deadball, black = 1st half from play, white = 2nd half from play,

Players with >= 3 shots from play

Shots Scores Success % Weighting
D Cummins (Galway) 6 2 33% -0.773
G Sice (Galway) 4 2 50% +0.240
P Conroy (Galway) 3 0 0% -1.267

Mayo V Galway 2014 Championship

July 18, 2014

For those new to the blog, or who haven’t been here for a while, please find a refresher on the definitions and how the numbers are compiled here

Overall

Team Possessions Shots Shot Rate Scores Success Rate Weighting
Mayo 41 29 71% 17 59% +3.229
Galway 39 30 77% 16 53% +0.666
Champ (’12 & ’13 avg) 35.8 27.6 77.2% 14.1 51.0%

In a game that was never really close they are a fairly balanced set of figures.

From a Mayo perspective the one area of concern here may be the Shot Rate. 71% is poor but follows on the back of 64% against Roscommon. In their six games in the 2013 Championship the returns were 69%, 81%, 67%, 74%, 86% & 86% so there is a general level of fluctuation in this one metric but with a possible three games to go Mayo will want to better their recent production.

What Mayo will be please with is how they stamped out the Galway comeback at the start of the second half before it could gain momentum. In that first 15 minutes Galway had a lot of momentum gaining 0-05 from nine shots. Mayo were much more clinical however gaining 1-03 from five shots thus ensuring they stayed at arm’s length.

I have started to track where the attacks originate from. The results are below. There is nothing hugely different between the teams here, and no results to compare against, however it may throw up some interesting points in games to come. One of note is how often Galway received the ball from Mayo in the middle 3rd.

Opposition k/out Own k/out Ball received in Own 3rd Ball received in Mid 3rd Ball received in Opposition 3rd Other (throw-in, rebound etc.)
Mayo 9 12 12 2 3 3
Galway 8 8 14 5 2 2

Shots from Play

Team Shots Scores Success Rate Weighting
Mayo 22 12 55% +2.721
Galway 23 11 48% +0.561
Champ avgs (’12 & ’13) 20.3 9.2 45.4%

Again the returns are pretty similar but the main difference is in the clinical nature with which Mayo dispatched their goal shots. They had 5 in total netting 3-01. Galway had four and only managed 0-01.

Mayo’s point shooting as such was 47% (8 from 17) with a weighting of +0.757. Galway had a return of 50% (10 from 20) with a weighting of +0.783.

Within that Galway return there was a whole spectrum of individual performances. Cummins, Hoare & Walsh combined for a 31% Success Rate (4 from 13) with a weighting of -3.089 whilst Conroy & Armstrong scored on all six of their shots.

Shots from deadballs

Player Shots Scores Success Rate Weighting
C O’Connor (Mayo) 7 5 71% +0.508
S Walsh (Galway) 7 5 71% +0.105
team avgs (’12 & ’13 Champ) 7.3 4.9 66.7%

Walsh was having a good day, hitting 5 frees from 5 attempts for a weighting of +1.013, until the missed penalty. Impossible as it is to prove it is hard to argue with the commentary on the game that the penalty miss must have weighed on his mind when taking the subsequent 45. Would Galway have been better employed getting someone else to take that shot?

As for the penalty it was a great save from Hennelly, diving low to his left, rather than a miss from Walsh. Still I have the conversion rate for penalties running at 83% from 24 in the database (where a player went for goal). Of the 4 “missed” two were saved – so only 8% of penalties are saved.

O’Connor’s day was above average without being spectacular – he missed two relatively central kicks (one was a 45) towards the end when the result wasn’t in doubt.

Kickouts

Mayo’s kickouts Won % Turned into a possession % Shot %
Mayo 18 67% 12 67% 8 44%
Galway 9 33% 8 89% 7 78%
Galway’s kickouts Won % Turned into a possession % Shot %
Mayo 12 48% 9 75% 7 58%
Galway 13 52% 8 62% 6 46%

Much was made, in the TV commentary, of how poorly Galway did on their own kickouts with the onscreen statistics showing them only winning 2 out of their own kickouts in the first half. Whilst “winning” kickouts is all based on definition I am unsure how such a low number was arrived at. In those 15 kickouts in the first half I had Galway winning 6 of them. It is still a poor return mind but nowhere near as poor as communicated.

In the second half Galway recovered some of the lost ground and eventually broke even on their own kickouts.

Mayo were in control of their own kickouts especially the “directional” variety. 14 of their 27 kickouts dropped short of the 65m line with Mayo winning 79% (11 out of 14). When they went long they won 54% (7 from 13).

Turnovers

Team “coughing up” possession Shots from Turnovers %
Mayo 29 12 41%
Galway 24 12 50%


Misplaced Pass Tackled Shots not going dead Other
Mayo 15 8 1 5
Galway 19 2 1 2

The first half was a bit of a scrappy affair with 24 (11 from Mayo, 13 from Galway) passes going astray between the two teams – 7 of these were from frees. So the team with the ball in their hand kicked it to the opposition 7 times! 6 more were hand passes that went astray.

As a contrast there were only 10 passes (4 from Mayo) that went astray in the second half.

Shot Charts

Galway’s nest of shots on the left between the 13m & 20m line is unique – very rarely will you see so many shots from there and never will you see them all converted.

Their downfall was the shooting from the “easier” sectors – Sectors 5 & 8 in front of the goal. Galway only converted 36% (4 from 11) of all shots taken centrally.

Mayo’s shooting
Mayo shooting (V Galway)

Galway’s shooting
Galway shooting (V Mayo)
x = missed, disc = score, yellow = deadball, black = 1st half from play, white = 2nd half from play

Players with >= 2 shots from play

Shots Scores Success Rate Weighting
S Walsh (Galway) 5 2 40% -0.530
D Cummins (Galway) 5 1 20% -1.342
P Conroy (Galway) 4 4 100% +2.318
K McLoughlin (Mayo) 4 3 75% +1.449
C O’Connor (Mayo) 4 3 75% +1.448
L Keegan (Mayo) 3 2 67% +0.760
J Doherty (Mayo) 3 2 67% +0.525
A Dillon (Mayo) 3 1 33% -0.268
E Hoare (Galway) 3 0 0% -1.217
S Armstrong (Mayo) 2 2 100% +1.167
G Bradshaw (Galway) 2 1 50% +0.233
M Lundy (Galway) 2 1 50% -0.068

Roscommon V Mayo 2014 Championship

June 10, 2014

For those new to the blog, or who haven’t been here for a while, please find a refresher on the definitions and how the numbers are compiled here

Overall

Team Possessions Shots Shot Rate Scores Success Rate Weighting
Roscommon 37 27 73% 10 37% -2.368
Mayo 36 23 64% 13 57% +0.159
Champ avg (’12 & ’13) 35.8 27.6 77.2% 14.1 51.0%

Roscommon will be kicking themselves. They worked extremely hard to keep Mayo to a paltry 23 shots which is a lower than any team managed in Mayo’s run to the All Ireland final last year (returns of 27, 34, 33, 34, 37 & 31 in their six games). Included in those returns are the 37 shots that Mayo racked up against Roscommon in last year’s mauling.

Yes, like in last year’s encounter, Mayo had an excellent strike rate of 57% however from such a low base of 23 shots this should not have helped Mayo. And it wouldn’t have *if* Roscommon had had their shooting boots on. It was not as if Roscommon’s effort was purely defensive – they manufactured four more shots than Mayo – however they only converted a very poor 37% in total. Anywhere near the average of 51% and they would have won this game – even without Cafferkey’s goal.

Shots from Play

Team Shots Scores Success Rate Weighting
Roscommon 22 7 32% -2.401
Mayo 15 6 40% -0.970
Champ avg (’12 & ’13) 20.3 9.2 45.4%

Bad enough that Mayo only managed 15 shots from play but at one point it was looking a lot worse. They went 25 minutes in the 2nd half with just one shot from play – and that from Donie Vaughan. Granted O’Connor won four frees (in that time) which were all converted but such a fallow period from the rest of the forward line must be of huge concern to the Mayo selectors.

The stat line for Mayo from play at 60 minutes was a 22% Success Rate (2 from 9) with a weighting of -2.051 – it was looking horrendous with only their deadball accuracy keeping them in it. The one shaft of light they can take from the performance was that in that final ten minutes they stood up (4 scores from 6 shots with a weighting of +1.081).

In those 25 minutes at the start of the 2nd half, when Mayo had a combined 5 shots, Roscommon had 12 attempts at goal (10 from play & 2 from frees). They converted 1-05 (or 50%), which is the average, but it felt as though they were underperforming mainly due to the shot that they were attempting. Two of the three attempts were from outside the 45 whilst a further wider effort from Higgins hit the post.

On Kevin Higgins; he had a monster day in the middle of the park but his shooting options were poor. He had six attempts in total converting only one. None of his six attempts were from central zones and better options may have presented themselves if he had just retained the ball rather than shoot. But that’s hindsight.

Shots from deadballs

Player Shots Scores Success Rate Weighting
C O’Connor (Mayo) 6 5 83% +0.440
K McLoughlin (Mayo) 2 2 100% +0.685
D Shine (Roscommon) 2 1 50% +0.019
S Kilbride (Roscommon) 1 1 100% +0.227
D Murtagh (Roscommon) 1 1 100% +0.160
F Cregg (Roscommon) 1 0 0% -0.371
team avgs (’12 & ’13 Champ) 7.3 4.9 66.7%

Excellent strike rate from Mayo with the only miss coming from a free just inside the 45 for the right footed O’Connor from the right side. Considering he converted 83% of his frees O’Connor’s weighting might appear low however three of his frees were more or less in front of goals.

Whilst the weighting might be low he still converted the attempts – and this after being directly responsible for winning four of Mayo’s eight frees. A stat that will go unnoticed in most reports on the game.

Whilst Roscommon’s combined returns were average (converting 3 from 5 attempts with a weighting of +0.036) Mayo will be delighted with their defensive effort. Only two of those attempts came from fouls within the 45.

Kickouts

Roscommon’s kickouts Won % Turned into a possession % Shot %
Roscommon 15 60% 9 60% 7 47%
Mayo 10 40% 6 60% 2 20%
Mayo’s kickouts Won % Turned into a possession % Shot %
Roscommon 8 42% 8 100% 8 100%
Mayo 11 58% 8 73% 7 64%

Although the headline numbers show an even contest, with a 23-21 split of kickouts won in favour of Roscommon, when we look a bit deeper Roscommon had by far the better of this contest.

Roscommon managed to convert 65% (15 of 23 won) of their kickouts won to a shot whereas Mayo only converted 43% (9 of 21). Roscommon managed an extra six shots from kickouts.

As can be seen from above the difference is most pronounced on what the teams did with primary possession from the opposition’s kickouts. Roscommon won 8 of Mayo’s 19 (42%) kickouts – and converted them all to shots. Mayo won 10 of Roscommon’s 25 kickouts (40%) but only managed to convert two to a shot.

Perhaps the most surprising element of the kickout battle was how few short kickouts there were – only three combined from the 43 we could track in full (the cameras missed one of the early Roscommon kickouts).

Turnovers

Team “coughing up” possession Shots from Turnovers %
Roscommon 30 9 30%
Mayo 34 14 41%


Misplaced Pass Tackled Shots not going dead Mishandled possession Fouled ball
Roscommon 11 12 5 1 1
Mayo 19 8 3 4 0

Again it is Roscommon coming out on top generating four more turnovers and also converting more of the turnovers they engineered into shots.

The table showing how the turnovers occurred backs up the earlier point about Mayo’s defensive discipline – 40% of the turnovers they manufactured came from tackles. On the games where turnovers have been tracked that figure of 12 tackles looks good. Tyrone managed 11 (37% of all turnovers) in their game with Down whilst there was 13 combined between Derry & Donegal.

What will be of concern to Mayo is the fact that they “gave” away 56% of their turnovers through misdirected passes. This is within their own control.

Shot Charts
Mayo were remarkably unbalanced in their shooting from play with only the one shot, from Aidan O’Shea, coming from the left hand side Sectors (sectors 6 & 9). I cannot say that I have noticed this from Mayo before so will chalk it down as an aberration – but one worth monitoring.

Mayo’s shooting
Mayo shooting (V Roscommon)

Roscommon’s shooting
Roscommon (V Mayo)
x = missed, disc = score, yellow = deadball, black = 1st half from play, white = 2nd half from play

Players with >= 2 shots from play

Shots Scores Success Rate Weighting
Kevin Higgins (Roscommon) 6 1 17% -1.174
K McLoughlin (Mayo) 4 2 50% +0.008
D Murtagh (Roscommon) 3 2 67% +0.922
S Kilbride (Roscommon) 3 2 67% +0.224
A Moran (Mayo) 2 2 100% +1.003
J Doherty (Mayo) 2 1 50% +0.281
C Shine (Roscommon) 2 0 0% -0.719
C Murtagh (Roscommon) 2 0 0% -0.824
D O’Gara (Roscommon) 2 0 0% -0.858

Mayo V London 2013

August 3, 2013

For those new to the blog, or who haven’t been here for a while, please find a refresher on the definitions and how the numbers are compiled here

Overall

Team Possessions Shots Shot Rate Scores Success Rate Weighting
Mayo 46 34 74% 16 47% -0.9318
London 31 24 77% 10 42% -0.4077
2012 avg 35.28 27.02 76.6% 13.96 51.67%

Watching the game I had expected the Mayo returns to be worse than they were

Shots from Play

Team Shots Scores Success Rate Weighting
Mayo 29 11 38% -2.084
London 14 3 21% -3.386
2012 team avgs 20.14 9.36 46.5%

Very poor from Mayo. Their conversion rate for shots for points was 29% (7/24) and of the 17 that were missed ten had no pressure applied.

There was obviously a level of complacency around the Mayo attack but the concern would be whether this performance has them right for a quarter final.

Shots from deadballs

Player Shots Scores Success Rate Weighting
C O’Connor (Mayo) 4 4 100% +1.097
K McLaughlin (Mayo) 1 1 100% +0.0.56
L Mulvey (London) 7 6 86% +0.073
S Kelly (London) 2 1 50% -0.284
D Traynor (London) 1 0 0% -0.481
2012 team avgs 6.88 4.6 66.9%

Very good from O’Connor scoring 1-03 from 4 chances in the second half.

Mulvey got all the frees he was expected to get. His six conversions came from Sectors 5 & 8 with his only miss being the one shot from an angle in Sector6.

Shot Charts
Mayo’s shooting

Mayo shooting

London’s shooting

London shooting

x = missed, disc = score, yellow = deadball, white = play

Kickouts
Mayo-London kickouts

Won’t someone think of the London goalie – 35 kickouts!

It might come as a surprise that London won more of their own kickouts. Mayo won seven of London’s first ten but thereafter London started to mix it up and gained a foothold. This was again aided by them going short on eight kickouts.

Players with >= 2 shots from from play

Shots Scores Success Rate Weighting
D Coen (Mayo) 5 1 20% -1.279
C O’Connor (Mayo) 4 2 50% +0.305
L Mulvey (London) 4 1 25% -0.834
K McLaughlin (Mayo) 4 1 25% -1.341
A Freeman (Mayo) 3 3 100% +1.413
A O’Shea (Mayo) 3 0 0% -1.230
R Feeney (Mayo) 2 1 50% +1.076
L Keegan (Mayo) 2 2 100% +0.743
D Dunleavy (London) 2 1 50% -0.121
C Daly (London) 2 0 0% -0.680
E Varley (Mayo) 2 0 0% -0.750
C Magee (London) 2 0 0% -0.854
P Geraghty (London) 2 0 0% -0.980