Posts Tagged ‘roscommon’

Clann na nGael v St. Brigids; Roscommon SFC Final 2018

October 17, 2018

The above table is split by halves however it can also be taken as a proxy for before/after the red card (in the 40th minute)

It highlights two aspects; firstly how utterly dominant Clann na nGael were post the red card but also, and probably more importantly, how this was no fluke as the platform had been laid in that opening 40 minutes when it was 15v15.

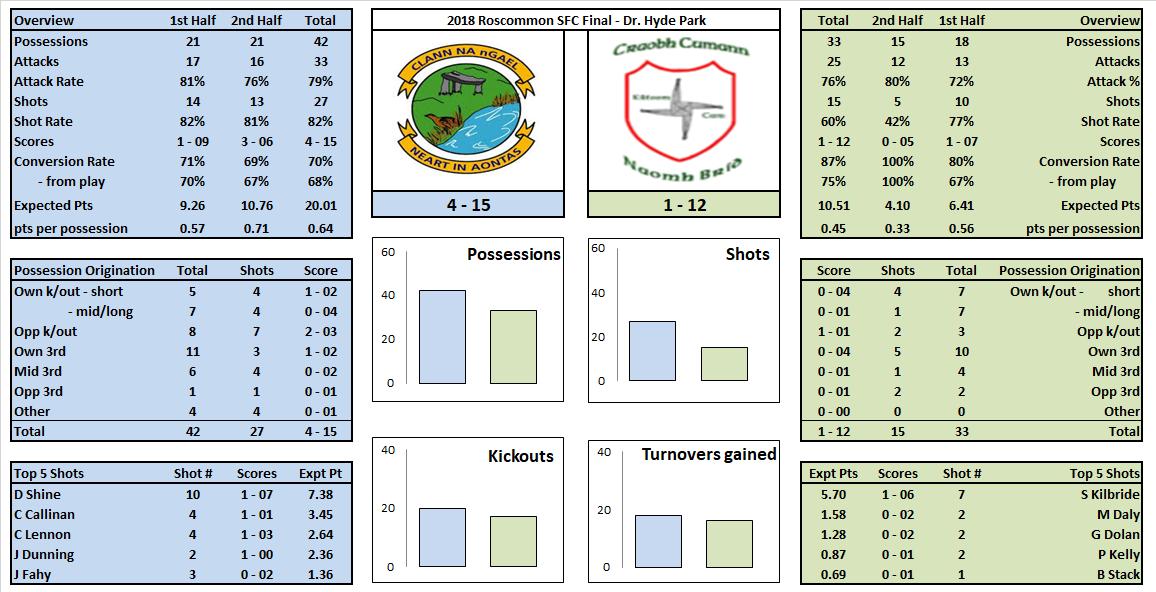
In those opening 40 minutes Clann na NGael had five more possessions and four more shots. Yes at the time of the red card there was only one point in it but that was due to excellent St. Brigids’ accuracy (83% Conversion Rate at that point with an Expt Pts of +3.57) more than anything else. Once the red card came the dam burst.

When Clann na nGael had the ball


Shot charts; disc = successful & “x” = unsuccessful. Yellow = deadball, red = attempt on goal, black = point attempt from play in the 1st half and white = point attempt from play in the 2nd half

… they were pretty devastating. 70% Conversion Rate and 0.68 points per possession are both excellent metrics. Every part of their attacking play was functioning but the game was cracked open with two goals in the 44th minute just after Brigids had levelled the game.

In total Clann had six shots at goal, with five different players having an attempt, returning 4 – 00 including the type of quick thinking from their sub Callinan for the 3rd goal (if anyone hasn’t seen it the clip is embedded here) which epitomised their all-round sharp display.

Scoring four goals means that to lose you either need to have a calamity on your remaining shooting or the opposition need to have an absolute worldly of a game. Neither happened here. Indeed the remainder of Clann’s shooting was as good as their shots at goal returning 69% (0 – 09 from 13; Expt pts +2.7) on point attempts which included two monsters from the two Shines. Donie Shine was also exemplary from deadballs scoring 0 – 06 from 8 on point attempts (including 0 – 02 from three 45s) as well as slotting a penalty. Indeed one of those misses was from the apex of the 20m line and sideline on the right with the right. Still not entirely convinced he was even going for a point with that looking at the angle!

Donie scoring 1 – 07 will rightly get the plaudits but he was ably supported on the attacking front by both Lennon & Fahy who combined for 1 – 05 from just 7 shots (86%; Expt Pts of +4.0). Apart from his shooting Fahy also had a quietly effective game as the link man providing three primary assists, setting up Dunning for the pivotal 2nd goal and winning a free for Shine to convert.

One aspect Clann may look at as they enter into the Connacht campaign was the fact that they got turned over six times outside the opposition’s 45. Brigids manufactured three shots and 0 – 02 from these six possessions but other teams will be more clinical.

When St. Brigids had the ball

In fairness to Brigids’ attacking unit they were also on point converting 87% (Expt Pts of +4.5). Their points per possession, in isolation, at 0.45 is very good. But the chasm between that and Clann’s 0.64, and the fact that they produced a lower return off an excellent Conversion Rate points to their deficiency; (a) they only scored one goal and (b) they just didn’t manufacture enough shots.

On the shot count; Brigids produced 12 fewer shots than Clann through a combination of having less possessions (33 to Clann’s 42) and a poorer Shot Rate (60% to Clann’s 82%).
They were in a hole to start with by having less possessions … they then dug further by not being able to convert those possessions they progressed into an attacking position into a shot.

Once they did pull the trigger they were every bit Clann’s equal with 71% (0 – 05 from 7; Expt Pts of +1.5) on point attempts, 1 – 01 from their two shots at goal and 100% (0 – 06 from 6) on their frees.

There just wasn’t enough shots

Senan Kilbride was very good early doors scoring 1 – 03 from 4 shots (including one free) in the first 15 minutes however the Clann defence got on top thereafter and he didn’t have another shot from play for the entire game.

A combination of the red card and Kilbride being marshalled saw Brigids attack being stifled to such an extent that they only produced two shots from play in the 2nd half

Kickouts

Clann na nGael absolutely destroyed Brigids on kickouts. The overall numbers show Clann na nGael gaining possession on 20 to Brigids 17 with the count being 12-10 on those that travelled past the 45. Nothing untoward there you might say but it was what came off the kickouts that was decisive.

Of the 20 kickouts they won Clann na Gael progressed 15 (75%) to a shot … Brigids manufactured seven shots off the 17 (41%) kickouts they won. Clann scored a barely creditable 3 – 09 directly off kickouts whilst only conceding 1 – 06.

Mayo v Roscommon 2017 AI QF

July 31, 2017

For those new to the blog, or who haven’t been here for a while, please find a refresher on the definitions and how the numbers are compiled here

Team Possessions Attacks Shots Scores Exp Pts
Roscommon 56 43 24 2 – 09 13.23
Mayo 54 42 29 1 – 12 14.46

Both teams had similar possession volumes (56 for Roscommon to Mayo’s 54) as well as Attack Rates (77% v 78%). Once inside the 45 there was a divergence however with Mayo getting more shots off (29 to Roscommon’s 25).

As an aside 110 possessions is high but not inordinately so. Across 54 games in 2015 and 2016 I have eight with a higher possession total including the 2015 final between Kerry & Dublin which was played in similarly wet conditions. The Connacht game ths year between Mayo & Galway had 113.

Mayo attack

As ever we start with Cillian O’Connor. One of his less auspicious days with a total Conversion Rate of 27% (0 – 03 from 11; Expt Pts – 2.91) and just 14% from play (0 – 01 from 7; Expt Pts -1.94). In eight games in 2016 he returned a combined conversion rate of 62% (0 – 44 from 71) with an Expt Pts tally of -0.93.

As ever his appetite for work and willingness to offer himself up as an option were evident as he took four of Mayo’s last six shots (Durcan took the other two) from the 65th minute onwards. One of these shots was a free from well outside his range whilst the other three were central enough however two were taken under strong or intense pressure. Indeed five of his seven attempts from play were heavily pressurised. If you’re Mayo you probably want O’Connor on the ball at the death but the opposition are well aware of this.

In a down game for O’Connor Lee Keegan almost single-handedly dragged Mayo back from the abyss scoring 1 – 03 from just five shots (80% Conversion Rate; Expt Pts +3.25). The goal was a prime example of split second decision making that can win/lose/decide games.

In the above Keegan’s (5) marker Enda Smith (9) gets sucked into the kickout melee unaware that Doherty has claimed a mark. Keegan sees it and immediately sets off behind Smith’s back. McDermott (Roscommon defender pointing) sees the danger but it is too late. Keegan is gone with nothing but open road in front of him.

The remainder of the Mayo team were average scoring 0 – 06 from 13 (46% Conversion Rate; Expt Pts of +0.10). None of the starting trio of McLoughlin, A O’Shea or S O’Shea managed a shot whilst only Tom Parsons produced one off the bench. Mayo will definitely be looking for more of a threat here the next day.

On McLoughlin & A O’Shea the fact that they didn’t get a shot off does not necessarily mean they had a poor game. Both were very involved higher up the pitch as evidenced by the assist chart.

Roscommon’s defence may be slightly disappointed in the fact that 46% (11 of 24) of Mayo’s shots were taken under little or no pressure however on the flip side they will be delighted in where they forced Mayo to shoot from. Mayo never really got through them or around the side – the vast majority of shots were from “outside”.

Roscommon attack

At a macro level Roscommon’s shooting was very good with them scoring ~1.7 points more than the shots they attempted would normally return. But their Conversion Rate was essentially average at 46% and therein lies a problem. Their high returns from goal attempts (2 – 00 from 2) masks how poor their shooting in general was. They had 16 point attempts from play and returned just 0 – 05 (31% Conversion Rate; Expt Pts -2.42).

It is quite possible, in a one off game in the replay, that they will again create more goal chances than Mayo and convert them all. It is much more likely however that they will revert to the mean on their goal attempt conversions and thus they will have to rely more heavily on the point taking (be that from play of from frees).

One point to note here is the affect that Mayo’s defence had on Roscommon. Above we showed how Roscommon helped themselves by keeping Mayo, in the main, on the outer perimeter. Roscommon got inside Mayo more often (see shot chart below) but the Mayo defense deserves credit as they heavily pressurised 75% (12 of 16) of Roscommon’s point attempts. This included a ~35 minute period post the second goal where they heavily pressurised 8 of Roscommon’s next 10 point attempts leading to Roscommon returns of 10% Conversion Rate (0 – 01 from 10) with a combined Expt Pts of -3.31.

Now undoubtedly there was “scoreboard pressure” as Mayo overturned the 7 point deficit that led to poor decisions and execution in the shots but Mayo definitely aided those poor decisions.

75% heavy pressure is high and at times they walked a bit of a tightrope offering up six attempts from a free with four coming inside the 45 – but you’ll take a combined return of 41% ( 0 – 09 from 22) from all point attempts.

Kickouts

Very even all told. 20 kickouts went passed the 45 with both teams winning 10 each. As with the general trend mentioned above Mayo were better at converting those possessions to shots.

In an interview post the Cork game Rochford mentioned, in assessing A O’Shea’s impact, how he had aided smaller things such as winning the throw in. Here Roscommon not only won both throw ins but scored off both as well.

APPENDIX
Roscommon’s shot chart

Mayo’s shot chart

x = missed, disc = score, yellow = deadball, black = 1st half from play, white = 2nd half, red = goal attempt

Clare v Roscommon 2016 AI Qualifiers

July 26, 2016

For those new to the blog, or who haven’t been here for a while, please find a refresher on the definitions and how the numbers are compiled here

Team Possessions Attacks Shots Scores Exp Pts
Clare 55 39 34 2 – 12 21.53
Roscommon 54 32 22 1 – 09 14.45

Combined the Expt Pts in this game was -5.98; the two teams scored six points less than an average intercounty team would be expected to score given the shots taken. It is going to be hard to take too many positives from a game with such numbers.

Clare Shooting

Clare’s shooting returns were poor with a Conversion Rate of just 41% (14 scores from 34 shots) and an Expt Pts tally of -3.53. Unfortunately for Clare no segmentation of the shooting shows a positive return
> Inside the 20m line; 42% (5 from 12) with an Expt Pts of -0.68
> Outside the 20m line; 36% (5 from 14) with an Expt Pts of -0.95
> Deadballs 50%; 50% (4 from 8) with an Expt Pts of -1.90

Undoubtedly there were some very poor misses – Cleary’s missed fisted point, a poor Ryan pass for Sexton in the first minute leading to a missed palmed effort – which Clare will hope to eradicate. And 12 shots from inside the 20m line is an indicator of their ability to create chances. But still that is poor.

This was our first Championship look at Clare (in the Division 3 league final they were more or less average with a 51% Conversion Rate and an Expt Pts tally if -0.99) so we cannot draw too many conclusions but they cannot be as profligate in the quarter final.

Kickouts

At a high level Clare won just 37% (17 of 46) of all kickouts and 63% of their own (12 from 19) with a net point difference of minus two points (Roscommon scored 0 – 06 from the kickouts they won with Clare similarly scoring 0 – 04).

Clare particularly struggled in this respect when playing against the wind in the first half. Seven first half kickouts travelled past the 45m line with Roscommon winning five; in the second half three went past the 45m line with Clare winning all three thus leaving Clare winning 50% of their own contestable kickouts.

They also had trouble with the short ones losing two of nine. They lost two short ones in the Kildare game as well. With limited data they appear to prefer the short kickout (60% of kickouts over the two games) but losing 15% (4 out of 27) is opening yourself up to potential disaster..

Roscommon

Roscommon had as many possessions as Clare but even given Clare’s very poor shooting Roscommon’s 0.22 points per possession was way below that of Clare. Indeed the 0.21 Mayo recorded against Galway was the only one worse this year.

The reason for such a poor return is twofold. Firstly Roscommon were anaemic in their efforts to get the ball in to Clare’s 45 with only 59% of their possessions ending up as an attack. This again was the second worst recorded this year behind Meath’s 57% against Dublin (as an aside the only other return below 70% was Galway’s against Mayo).

Secondly their shooting was also poor showing a Conversion Rate of 45% with an Expt Pts of -2.45. You can have low attacking volumes, or poor shooting, and survive. You cannot have both.

What struck me more than the shooting however was the way that Roscommon approached the game. The below picture shows the movement for Clare’s attack in the first minute.

PhotoGrid_1469349777236

I would have thought that Roscommon would be busting a gut to make amends after the Connacht final replay but Ryan’s pass and run are never tracked and Brennan is allowed to turn inside without a hand being laid on him thus drawing the cover and allowing Ryan in behind.

Now the question becomes is that a system issue (Smith should not be responsible for tracking a livewire like Ryan & Keenan did not have the strength for Brennan) or a player attitude/mental fatigue issue? That we cannot decipher but it was not the first time that this happened.

PhotoGrid_1469547131961

Above is the substitute McGrath taking a kickout in acres of space. Smith had just missed the goal chance in the 61st minute to bring the sides level. Roscommon’s tails were up and the Clare goalie had not rushed the kickout (32 seconds between Smith’s shot and the kickout). McGrath to be that open at that stage of the game is criminal. Roscommon were chasing the game so I can understand there being a lack of cover but even still for no one to lay a hand on him before taking a shot just outside the 20m line added injury to insult.

These were two incidents either end of the game. There were many more. It will be a long Winter for the Roscommon team.

Galway v Roscommon 2016 Connacht final

July 13, 2016

For those new to the blog, or who haven’t been here for a while, please find a refresher on the definitions and how the numbers are compiled here

Team Possessions Attacks Shots Scores Exp Pts
Galway 50 39 27 0 – 13 12.81
Roscommon 49 38 22 1 – 10 11.17

Given the high scores Roscommon had racked up in their two Championship outings to date (01-15 against New York and 4-16 versus Sligo) it was somewhat surprising to see them produce five fewer shots than Galway. But we have to give the Galway defence some credit here. Yes the conditions on Sunday were atrocious but in their last three halves that defence has restricted the opposition to 9, 12 & 10 shots respectively for a combined Expt Pts of 16.36. That will not only keep you in games but win you a majority of them.

Attacking wise Galway are nothing if not consistent. Against Mayo they had 50 possessions with 25 shots and 13 scores. The goal the last day helped them outperform shooting wise (scoring 1-01 from your only two goal chances will do that) but here they produced an almost perfectly average display with a Conversion Rate of 48% and an Expt Pts return of +0.19. Perfectly average is in no way a slight given the conditions that those “average” returns were produced in.

Roscommon on the other hand had to overcome their relative lack of shots (as a point of reference they had 39 against Sligo and 33 against Kerry in the league semi-final) through accuracy with an Expt Pts return of +1.83. That statement is slightly misleading however as the positive return was entirely down to their goal (I say slightly as creating, and taking, goal chances is a huge skill in itself). When going for a point they were also bang on average with a Conversion Rate of 48% and an Expt Pts of +0.02.

Roscommon cannot rely on converting their only goal chance the next day. Their point taking has not been good enough to date (v Sligo their Conversion Rate was 52% with an Expt Pt of -0.02 when going for a point) to overcome another small shot volume – they need to create more opportunities. Galway on the other hand will look to continue doing what they do – produce average shooting displays, convert any goal chance that comes their way and play suffocating defence.

We saw in the Cavan Tyrone games that replays can take on an entirely different characteristic to the original game. Evidence to date suggests that Galway’s template is repeatable – can Roscommon “up it”?

Roscommon Kickouts

Roscommon had 21 kickouts winning 20 with the only loss being one that went over the sideline. It was surprising, from a number of aspects, to see Galway so passive on the Roscommon kickout. We know from previous games that the Roscommon kickout can take chances (end of the Monaghan league game, 3 kickouts picking wide open Sligo men the last day) and with the wind behind them in the second half I fully expected Galway to apply a full press and hem Roscommon in. Also Roscommon scored 1-08 from their short kickouts against Sligo. Galway should have been aware of their ability to use these possessions and tried to disrupt it – again here they scored 0-04.

Galway didn’t push up and indeed also gave Mayo the kickout. It is something they are obviously comfortable doing and, in the main, the results to date have borne fruit but you sense that their midfield would be better utilised by contesting long Roscommon kickouts which are obviously Roscommon’s least favoured option. The press would also force Roscommon to continue taking dicey short kickouts if they wished to avoid a midfield battle.

Roscommon’s anomalies

Attacking from deep
Roscommon’s attacking from deep was very poor. As noted above they scored 0 – 04 from 18 short kickouts (0.22 pts per possession) but were an abysmal 0-01 from 16 turnover possessions (0.06 pts per possession) that started inside their own 45m line.

Generally you would expect Galway to be more defensively set on the kickouts than the turnovers. Why did Roscommon struggle so much here? (There was a similar split against Sligo with Roscommon returning 0.61 pts per possession from their short kickouts and 0.40 pts from deep turnovers however that return from the kickouts was phenomenal rather than the attacking play from deep turnovers being poor)

I thought perhaps it may have had something to do with their slow build up play. The thinking being that they were set from kickouts and were used to the various player movements but that Galway’s defensive wall somehow stymied them on turnovers. Not so; there were on average 8.35 player touches per possession on their own kickout versus 9.60 for the deep turnovers. A gap yes – indicating slower build up play – but easily explained by the first recipient of the kickout being able to travel at least to half way.

It’s an odd one and given that there’s no simple explanation an area you would expect Roscommon to improve the next day simply by regressing to the mean.

Centrality of second half shooting

Roscommon point attempts from play
Roscommon shooting from play (v Gal)
x = missed, disc = score, black = 1st half from play (with wind), white = 2nd half (against wind)

The above chart shows Roscommon’s point attempts. Firstly we can see how clean Galway kept the sector immediately in front of goal. Secondly there is quite the variation by half in where Roscommon shot from. In the first half they were willing to launch the ball from difficult angles. In the second they were much more conservative whilst being poorer. From this juncture it is hard to tell if that second half conservatism was purely driven by the conditions or if it does indeed show a willingness to take the less certain shot on in such a close game.

What we can say is that there was no such divergence on Galway’s shooting. We need to acknowledge that they had the wind when the pressure was at its most intense in the second half but the lack of change is interesting in itself.

Galway point attempts from play
Galway shooting from play (v Ros)
x = missed, disc = score, black = 1st half from play (against wind), white = 2nd half (with wind)

Roscommon v Sligo 2016 Connacht

June 14, 2016

For those new to the blog, or who haven’t been here for a while, please find a refresher on the definitions and how the numbers are compiled here

Roscommon scoring 4-10 in the second half lends the game to the old “game of two halves” analysis. However whilst the scoreboard was lopsided in Sligo’s favour at half time (2 – 08 to 0 – 06) it was more a case of unsustainable Sligo accuracy – and no little profligacy from Roscommon – rather than anything in the game per se that created this gap.

1st Half

Team Possessions Attacks Shots Scores Exp Pts
Roscommon 27 21 15 0 – 06 10.64
Sligo 24 19 14 2 – 08 9.27

Roscommon had more attacks, one more shot and essentially easier shots than Sligo in that first half. I say easier as Roscommon had an Expt Pts value of ~1.5pts greater than Sligo despite only having that one extra shot. Scoring 2-08 from 14 shots, including 0-08 from 11 point attempts with 3 of those coming from outside the 45, will put a rosy tint on any game plan. But as can be seen from the above table, and the shot charts below, the signs were there. Sligo’s shooting was long range leading to lower Expt Pts. Roscommon’s was closer with 10 attempts from inside the 20m line. In a prelude to what happened in the second half Roscommon had three goal attempts. Unlike the second half they returned nothing from them.

2nd Half

Team Possessions Attacks Shots Scores Exp Pts
Roscommon 31 28 24 4 – 10 17.57
Sligo 21 14 11 0 – 05 5.71

Looking at the 2nd half numbers Sligo – shooting wise – did not fall off. They just returned slightly below what was expected. Where they did fall off was in ceding possession, and ultimately attacks, to Roscommon.

Roscommon had 10 more possessions in that second half and an incredible 14 more attacks. Sligo could not stop Roscommon coming at them in wave after wave. Sligo were at the very least co-authors in their own downfall through poor kick passing – I counted 8 kick passes (& 1 hand pass) going to a Roscommon man – and poor kickouts. Roscommon won seven of Sligo’s 18 kickouts in that second half. This was actually an improvement on the first half when Roscommon won six of Sligo’s nine kickouts. But again the signs were there.

Roscommon shooting

For all that Roscommon still had to use this possession. Their first half shooting was poor however in the second half they had a Dublin-esque seven shots on goal scoring 4-01. It was this that catapulted them ahead of Sligo as their point taking was average; 0-08 from 15 shots (53% Conversion Rate) with an Exp Pts tally of 7.14

We have been underestimating this Roscommon team all year but in the battles to come it is doubtful that they will have such a numerical advantage in terms of possessions & attacks. Can they continue to create this volume of goal attempts (10!! here)? If not can they up their point taking percentages which were average here (Conversion Rate of 48% and a total Exp Pts of -0.25)?

Kickouts

After the league semi final against Kerry I wrote the below paragraph

One final point to note on Roscommon is their short kickout routine. Short kickouts going astray is an occupational hazard for teams that employ the tactic but it was a short kickout that effectively cost them the game late on versus Monaghan and here again they found a Kerry man wiiiide open inside their own 45 on a short one (different keepers on both occasions). This doesn’t count the numerous instances that I visibly winced as a defender received the ball with the attackers bearing down on him.

Short kickouts are fine – and will go astray – but Roscommon seem to flirt with danger more than most.”

I was visibly wincing again here. Roscommon won 86% of their own kickouts however this was entirely due to the nature of those kickouts. The 18 they won all went short. They went past the 45 on three occasions and lost all three. Worse again all three went directly to a wiiiide open Sligo man who was immediately on the attack.

Those three losses happened in the first half in the midst of six shorts ones – two of which landed on Roscommon players under immense pressure. So when the battle was raging Roscommon lost three of their opening nine kickouts in alarming circumstances and won two in an incredibly dangerous fashion.

The flip side of this is that the remaining 12 passed off without any major incident helping them build the possession & attack momentum mentioned earlier. Roscommon scored 1-06 directly from those 12 possessions.

It is the eternal short kickout risk/reward conundrum. We have seen numerous instances of late where short kickouts have gone disastrously wrong. Roscommon play with the tiger’s tail more than most but yesterday it worked out once those early glitches were ironed out. But in games to come what happens when they get a full court press from the opposition? Will they continue to go short under pressure? Sligo got 0-02 here – will an early goal rattle them enough to change?

Roscommon’s kickouts, and what they do when they are confronted with a full press, is definitely one of those moments I am looking forward to in this year’s Championship.

Appendix

Shot Charts

Roscommon’s shooting

Roscommon shooting (V Sligo 16)

Sligo’s shooting
Sligo shooting (V Rocommon 16)
x = missed, disc = score, yellow = deadball, black = 1st half from play, white = 2nd half, red = goal attempt


Players with >= 3 shots from play

Shots Scores Success Rate Exp Pts
C Devaney (Roscommon) 7 0 – 03 43% 3.86
P Hughes (Sligo) 6 0 – 05 83% 2.28
D Shine (Roscommon) 5 0 – 02 40% 3.61
D Keenan (Roscommon) 4 0 – 03 75% 3.03
C Cregg (Roscommon) 4 0 – 00 0% 2.34
D Smith (Roscommon) 3 0 – 02 67% 2.63
N Murphy (Sligo) 3 0 – 02 67% 1.22

Kerry v Roscommon 2016 League SF

April 14, 2016

For those new to the blog, or who haven’t been here for a while, please find a refresher on the definitions and how the numbers are compiled here

Team Possessions Attacks Shots Scores Exp Pts
Kerry 45 33 26 3 – 15 16.74
Roscommon 50 40 33 0 – 14 17.49

Although the 70 minute overview doesn’t read too badly for Roscommon this game was over by the 18th minute when they were attempting just their fifth shot. The gulf is probably better represented by the below comparison.

Kerry v Roscommon league SF Expt Pts

By the time of that fifth shot Kerry had scored 1-06 from their opening ten shots. Almost as impressive as that strike rate is how they killed the game instantly inside three minutes. Cooper bagged his goal with an excellent finish from the left of the small square. Kerry then went on to win the next three Roscommon kickouts scoring a point off each. Roscommon went in to the 12th minute 0-03 to 0-02 down and emerged in the 16th minute 1-06 to 0-02 down with their only possession of the ball being 3 goal kicks. Absolutely clinical.

Not all of Kerry’s league games were televised but this is not the first time we have seen them sprint out of the traps this year. Against Cork, by the 20th minute, they bagged 0-10 from their opening 12 shots killing that game off too. It will be interesting to see how they start against Dublin in the final.
Speaking of that final what may also be illuminating is the kickout battle. Michael Quirke had a good article in the Examiner during the week stating that Down, Donegal, Cork & Kerry won just five of Dublin’s kickouts combined. Now we can argue the merit of that stat (did those teams push up? How many were short & thus uncontested?) but the crux of the article is that Cluxton is a potent weapon for Dublin. I think on that we can all agree.

And yet in the All Ireland final Kerry managed to seriously pressure Cluxton winning three of their ten short kickouts (unheard of previously) whilst Mayo also managed to break down the kickout routine at the end of the drawn replay.

On the other hand Kerry might be worried about their own kickouts. In that final Dublin lorded it over them in the second half until that dominance forced Kerry to go short in the last quarter. Here Roscommon got their hands on 60% (12 of 20) of Kerry’s contestable kickouts. Granted that return was aided by Roscommon winning five of the last six Kerry kickouts. It could be argued that Kerry had switched off towards the end whilst Roscommon were still working trying to eek something from what was to that point an excellent league campaign (& still is). But even still prior to this the count was seven apiece on contestable kickouts.

What of Roscommon?

Roscommon shooting (V Kerry 16 league SF)
x = missed, disc = score, yellow = deadball, black = 1st half point attempt from play, white = 2nd half point attempt from play, red = goal attempt

Their shooting was poor here. Not necessarily the shot selection but the execution with some very simple chances missed in the first half. Scoreboard pressure after Kerry’s early onslaught? Or something else?

Looking at the four (vs Monaghan, Donegal & Kerry twice) league games charted Roscommon attempted 102 shots scoring 2 – 56. This is against an Expected Return of ~63 points. That’s not a bad return at all when you consider the weather and pitch conditions (the Expt Pt is modelled on Championship games) and the fact that they were stepping up in regards the quality of opposition. It would appear from this distance that there is no glaring issue with their shooting.

Another element that stands out on the above chart is just how clean in front of the goal is. Kerry managed to stop Roscommon having any shots at goal. In the other three games Roscommon manufactured five shots at goal scoring 2-02. Not exactly prolific and perhaps one area they can take away to work on.

One final point to note on Roscommon is their short kickout routine. Short kickouts going astray is an occupational hazard for teams that employ the tactic but it was a short kickout that effectively cost them the game late on versus Monaghan and here again they found a Kerry man wiiiide open inside their own 45 on a short one (different keepers on both occasions). This doesn’t count the numerous instances that I visibly winced as a defender received the ball with the attackers bearing down on him.

Short kickouts are fine – and will go astray – but Roscommon seem to flirt with danger more than most.

Appendix

Kerry shooting chart

Kerry shooting (V Roscommon 16 league SF)

Sligo V Roscommon 2015 Connacht Championship

June 22, 2015

For those new to the blog, or who haven’t been here for a while, please find a refresher on the definitions and how the numbers are compiled here

Overall

Team Possessions Attacks Attack % Shots Shot % Scores Success % Weighting
Sligo 52 37 71% 28 76% 15 54% +1.531
Roscommon 55 39 71% 28 72% 13 48% -0.801
Avg 37.0 28.7 77.7% 14.7 51.2%

A relatively even set of returns. Though Roscommon had three more possessions (in the main due to their kickout supremacy) both teams transferred the ball into an attack and a subsequent shot at very similar rates. What difference there was came in the form of Sligo’s superior shooting – and the goal.

Shots from Play

Team Shots Scores Success % Weighting
Sligo 22 11 50% +1.599
Roscommon 22 10 45% +0.023
Avgs 21.4 9.7 45.3%

Adrian Marren had an absolute stormer scoring 0–04 from 5 attempts; two each on his left and right and all from outside the 20m line.

Outside of Marren there will be areas of concern. Although the rest of the team’s point attempts were average (44% Conversion Rate with a weighting of -0.126) you get the sense that average wont suffice against Mayo whilst the only goal attempts Sligo created were the penalty and a Kelly snapshot from a rebound. They didn’t really manufacture goal chances.

Roscommon had their Marren in Cathal Cregg who also scored 0-04 from outside the 20m line but none of the other forwards stood up (E Smith & S Kilbride combined for 0-02 from 9 attempts). Whereas Sligo had the two Breheny’s & Hughes contributing 0–02 each Roscommon relied on Cafferky & Daly coming up from the back to bolster their scoring.

Shots from deadballs

Player Shots Scores Success % Weighting
A Marren (Sligo) 6 4 67% -0.068
C Murtagh (Roscommon) 3 2 67% -0.229
F Cregg (Roscommon) 1 1 100% +0.397
D O’Malley (Roscommon) 1 0 0% -0.389
D Murtagh (Roscommon) 1 0 0% -0.603
team avgs 7.2 4.9 68.7%

Marren’s free taking was below average getting the two close in and converting one of three from >= 35m. His most important contribution was the penalty however. In the last three years ~82% of penalties have been converted however in a weekend when Munnelly missed one for Laois, as did Gollogly for Monaghan, their conversion should never be taken for granted.

Slight bit of a quirk in Roscommon’s deadballs in that they all came from the left. Four players combined for a Conversion Rate of 50% (4 from 6) and a weighting of -0.824. Hindsight is a great thing but in a game when you are behind, and time matters, bringing your goalie up to attempt an outrageously difficult 45 was the not the greatest idea.

Kickouts

Sligo’s kickouts Won % Turned into an attack % Shot %
Sligo 16 64% 10 63% 9 56%
Roscommon 9 36% 5 56% 3 33%
Roscommon’s kickouts Won % Turned into an attack % Shot %
Sligo 4 17% 2 50% 1 25%
Roscommon 19 83% 16 84% 11 58%

Roscommon lorded their own kickouts winning 83%. It could have been even more impressive as they gained possession on 18 of their first 19 kickouts but the introduction of Gilmartin seemed to add some beef to Sligo’s midfield.

Given Roscommon’s dominance it was no surprise to see Sligo going short. Almost one in three (8 of 25) of their kickouts went short whilst Devaney was also very good at finding men when they came open. Sligo won 8 of the 17 kickouts they sent past the 45 – 5 of those 8 were won relatively cleanly.

Turnovers

Team giving up the ball Pass In the Tackle from a Shot Other
Sligo 12 6 1 6
Roscommon 18 5 3 4

Roscommon’s passing was poor with 18 going astray including four passes into the forward line where the forwards lost a contested ball.

Sligo were much neater only giving the ball away in the pass 12 times

Shot Charts

Sligo’s shooting
Sligo shooting (V Roscommon 15)

Roscommon’s shooting
Roscommon shooting (V Sligo 15)
x = missed, disc = score, yellow = deadball, black = 1st half from play, white = 2nd half from play,

Players with >= 3 shots from play

Shots Scores Success % Weighting
C Gregg (Roscommon) 6 4 67% +1.589
E Smith (Roscommon) 6 2 33% -0.538
A Marren (Sligo) 5 4 80% +2.063
M Breheny (Sligo) 4 2 50% +0.398
P Hughes (Sligo) 4 2 50% -0.076
C Breheny (Sligo) 3 2 67% +0.757
D Kelly (Sligo) 3 1 33% -0.422
S Kilbride (Roscommon) 3 0 0% -1.115

Roscommon V Mayo 2014 Championship

June 10, 2014

For those new to the blog, or who haven’t been here for a while, please find a refresher on the definitions and how the numbers are compiled here

Overall

Team Possessions Shots Shot Rate Scores Success Rate Weighting
Roscommon 37 27 73% 10 37% -2.368
Mayo 36 23 64% 13 57% +0.159
Champ avg (’12 & ’13) 35.8 27.6 77.2% 14.1 51.0%

Roscommon will be kicking themselves. They worked extremely hard to keep Mayo to a paltry 23 shots which is a lower than any team managed in Mayo’s run to the All Ireland final last year (returns of 27, 34, 33, 34, 37 & 31 in their six games). Included in those returns are the 37 shots that Mayo racked up against Roscommon in last year’s mauling.

Yes, like in last year’s encounter, Mayo had an excellent strike rate of 57% however from such a low base of 23 shots this should not have helped Mayo. And it wouldn’t have *if* Roscommon had had their shooting boots on. It was not as if Roscommon’s effort was purely defensive – they manufactured four more shots than Mayo – however they only converted a very poor 37% in total. Anywhere near the average of 51% and they would have won this game – even without Cafferkey’s goal.

Shots from Play

Team Shots Scores Success Rate Weighting
Roscommon 22 7 32% -2.401
Mayo 15 6 40% -0.970
Champ avg (’12 & ’13) 20.3 9.2 45.4%

Bad enough that Mayo only managed 15 shots from play but at one point it was looking a lot worse. They went 25 minutes in the 2nd half with just one shot from play – and that from Donie Vaughan. Granted O’Connor won four frees (in that time) which were all converted but such a fallow period from the rest of the forward line must be of huge concern to the Mayo selectors.

The stat line for Mayo from play at 60 minutes was a 22% Success Rate (2 from 9) with a weighting of -2.051 – it was looking horrendous with only their deadball accuracy keeping them in it. The one shaft of light they can take from the performance was that in that final ten minutes they stood up (4 scores from 6 shots with a weighting of +1.081).

In those 25 minutes at the start of the 2nd half, when Mayo had a combined 5 shots, Roscommon had 12 attempts at goal (10 from play & 2 from frees). They converted 1-05 (or 50%), which is the average, but it felt as though they were underperforming mainly due to the shot that they were attempting. Two of the three attempts were from outside the 45 whilst a further wider effort from Higgins hit the post.

On Kevin Higgins; he had a monster day in the middle of the park but his shooting options were poor. He had six attempts in total converting only one. None of his six attempts were from central zones and better options may have presented themselves if he had just retained the ball rather than shoot. But that’s hindsight.

Shots from deadballs

Player Shots Scores Success Rate Weighting
C O’Connor (Mayo) 6 5 83% +0.440
K McLoughlin (Mayo) 2 2 100% +0.685
D Shine (Roscommon) 2 1 50% +0.019
S Kilbride (Roscommon) 1 1 100% +0.227
D Murtagh (Roscommon) 1 1 100% +0.160
F Cregg (Roscommon) 1 0 0% -0.371
team avgs (’12 & ’13 Champ) 7.3 4.9 66.7%

Excellent strike rate from Mayo with the only miss coming from a free just inside the 45 for the right footed O’Connor from the right side. Considering he converted 83% of his frees O’Connor’s weighting might appear low however three of his frees were more or less in front of goals.

Whilst the weighting might be low he still converted the attempts – and this after being directly responsible for winning four of Mayo’s eight frees. A stat that will go unnoticed in most reports on the game.

Whilst Roscommon’s combined returns were average (converting 3 from 5 attempts with a weighting of +0.036) Mayo will be delighted with their defensive effort. Only two of those attempts came from fouls within the 45.

Kickouts

Roscommon’s kickouts Won % Turned into a possession % Shot %
Roscommon 15 60% 9 60% 7 47%
Mayo 10 40% 6 60% 2 20%
Mayo’s kickouts Won % Turned into a possession % Shot %
Roscommon 8 42% 8 100% 8 100%
Mayo 11 58% 8 73% 7 64%

Although the headline numbers show an even contest, with a 23-21 split of kickouts won in favour of Roscommon, when we look a bit deeper Roscommon had by far the better of this contest.

Roscommon managed to convert 65% (15 of 23 won) of their kickouts won to a shot whereas Mayo only converted 43% (9 of 21). Roscommon managed an extra six shots from kickouts.

As can be seen from above the difference is most pronounced on what the teams did with primary possession from the opposition’s kickouts. Roscommon won 8 of Mayo’s 19 (42%) kickouts – and converted them all to shots. Mayo won 10 of Roscommon’s 25 kickouts (40%) but only managed to convert two to a shot.

Perhaps the most surprising element of the kickout battle was how few short kickouts there were – only three combined from the 43 we could track in full (the cameras missed one of the early Roscommon kickouts).

Turnovers

Team “coughing up” possession Shots from Turnovers %
Roscommon 30 9 30%
Mayo 34 14 41%


Misplaced Pass Tackled Shots not going dead Mishandled possession Fouled ball
Roscommon 11 12 5 1 1
Mayo 19 8 3 4 0

Again it is Roscommon coming out on top generating four more turnovers and also converting more of the turnovers they engineered into shots.

The table showing how the turnovers occurred backs up the earlier point about Mayo’s defensive discipline – 40% of the turnovers they manufactured came from tackles. On the games where turnovers have been tracked that figure of 12 tackles looks good. Tyrone managed 11 (37% of all turnovers) in their game with Down whilst there was 13 combined between Derry & Donegal.

What will be of concern to Mayo is the fact that they “gave” away 56% of their turnovers through misdirected passes. This is within their own control.

Shot Charts
Mayo were remarkably unbalanced in their shooting from play with only the one shot, from Aidan O’Shea, coming from the left hand side Sectors (sectors 6 & 9). I cannot say that I have noticed this from Mayo before so will chalk it down as an aberration – but one worth monitoring.

Mayo’s shooting
Mayo shooting (V Roscommon)

Roscommon’s shooting
Roscommon (V Mayo)
x = missed, disc = score, yellow = deadball, black = 1st half from play, white = 2nd half from play

Players with >= 2 shots from play

Shots Scores Success Rate Weighting
Kevin Higgins (Roscommon) 6 1 17% -1.174
K McLoughlin (Mayo) 4 2 50% +0.008
D Murtagh (Roscommon) 3 2 67% +0.922
S Kilbride (Roscommon) 3 2 67% +0.224
A Moran (Mayo) 2 2 100% +1.003
J Doherty (Mayo) 2 1 50% +0.281
C Shine (Roscommon) 2 0 0% -0.719
C Murtagh (Roscommon) 2 0 0% -0.824
D O’Gara (Roscommon) 2 0 0% -0.858

Roscommon V Mayo 2013

June 18, 2013

For those new to the blog, or who haven’t been here for a while, please find a refresher on the definitions and how the numbers are compiled here

Overall

Team Possessions Shots Shot Rate Scores Success Rate Weighting
Roscommon 32 26 81% 9 35% -3.912
Mayo 43 37 86% 21 57% -0.369
2012 avg 35.28 27.02 76.6% 13.96 51.67%

Considering the fact that they scored 0-21, and have a success rate above average, it may come as a surprise to see a weighting below zero. This is due to the type of shot missed. Mayo had 11 attempts from play at a score from Sector8 yet only converted five. Of those six misses five came in the second half and was an indication of the malaise that set into the game post half time.

Shots Scores Success Rate Weighting
1st Half 11 8 73% +2.617
2nd Half 16 6 38% -2.175

The above table shows the difference in Mayo’s shooting from play from one half to the next. Mayo were razor sharp in the first half when the game was “live”. Once the contest had abated their accuracy wained.

Shots from play

Team Shots Scores Success Rate Weighting
Roscommon 20 5 21% -3.137
Mayo 27 14 52% +0.442
2012 avg 20.14 9.36 46.47%

Overall Mayo’s shooting from play was average but Roscommon’s was abysmal. Yes it could be said they took on shots in the second half, through sheer frustration, that they wouldn’t normally attempt had the game been close but in the first half they only hit 33% (3/9).

One notable feature of the game was the difference in the pressure being applied to the forward as they were in the act of shooting. Whilst the game should have had some intensity in the first half Mayo got 63% (7 of 11 shots) of their shots off without any pressure. On the flipside they applied pressure to 100% (9 from 9) of Roscommon’s first half shots.

Shots from deadballs

Player Shots Scores Success Rate Weighting
S Kilbride (Roscommon) 4 3 75% +0.015
D Smith (Roscommon) 2 1 50% -0.790
K McLoughlin (Mayo) 5 5 100% +0.476
A Freeman (Mayo) 3 2 67% -0.248
D Clarke (Mayo) 1 0 0% -0.481
K O’Malley (Mayo) 1 0 0% -0.558
2012 team avgs 6.88 4.6 66.9%

In Cillian O’Connor’s absence Kevin McLoughlin carried over his league form. In the 5 Mayo league games charted he hit 90% (5/6) – again in this game he hit 100%. None of the frees he is asked to take would be deemed difficult – the longer ones were left to the two goalies and Freeman – but what else can you ask of what is essentially your back up free taker other than consistency?

I am unsure as to why Mayo asked the two goalies to take the long frees. McLoughlin showed he has good leg strength with the one from c38m.

Shot Charts
I’m not sure if it was just randomness or the fact that Mayo’s two best winners of primary possession up front, Freeman & Moran, were steering their runs out to the right, but there was a marked difference in where Mayo shot from when comparing the two halves. Almost everything from play came from the right in the second half.

This can be seen in the Mayo shot chart with 2nd half shots from play in black and 1st half in white.

Mayo’s shooting

Mayo Shooting

Roscommon’s shooting

Roscommon shooting

x = missed, disc = score, yellow = deadball, white = play

Kickouts
Kickouts

Roscommon did quite well in the kickout department. I am sure pre game they would have been glad to hold Mayo to 55% given the presence of the O’Shea brothers.

From this vantage we do not know what Mayo’s view of a good kickout return is. What is their risk appetite? When they went short they only got a shot off 33% (3/9) of the time but they controlled the ball. They had a shot differential of +3

When they went past the 45m line with their kickouts they converted 83% (5/6) of those they won into shots however they also gave Roscommon 4 shots from the 7 they won. A shot differential of +1.

So do you go long and get more shots but risk the opposition also getting shots? Or go short and convert less of that possession to shots but don’t give the opposition much in the way of shooting opportunities?

Players with >= 2 shots from play
In the last Mayo game (Vs Galway) the one player I called out was Alan Dillon. At that stage he had hit 11 from 12 shots in his last 4 Mayo games charted. And of course he goes and throws in a stinker. He wasn’t alone; I’m sure Cathal Shine would like some of those wayward attempts back.

Colm Boyle had a nice game but overall the shooting was widely dispersed with average enough displays

Shots Scores Success Rate Weighting
A Dillon (Mayo) 5 1 20% -1.558
C Shine (Roscommon) 4 0 0% -1.601
C Boyle (Mayo) 3 2 67% +0.863
C Devaney (Roscommon) 3 1 33% -0.353
R Feeney (Mayo) 3 1 33% -0.649
D Coen (Mayo) 2 2 100% +1.23
E Smith (Roscommon) 2 2 100% +1.185
A Moran (Mayo) 2 1 50% +0.14
K Higgins (Roscommon) 2 1 50% +0.13
K Mannion (Roscommon) 2 1 50% +0.074
L Keegan (Mayo) 2 1 50% +0.056
A Freeman (Mayo) 2 1 50% -0.196
A O’Shea (Mayo) 2 1 50% -0.196
K McLoughlin (Mayo) 2 1 50% -0.342
S Kilbride (Roscommon) 2 0 0% -0.645

Roscommon Vs Galway

May 24, 2012
Team Possessions Shots Shot Rate Scores Success Rate
Galway 40 32 80% 18 56%
Roscommon 32 21 66% 10 48%
avg 41.8 28.3 67.7% 14.1 49.8%

To the naked eye Joe Bergin appeared to lord over midfield once Finneran went off and the above table would support this. Roscommon’s shot & success rate was almost bang on average but the number of possessions they had was relatively small – they were starved of ball inside Galway’s 45m line.

Galway on the other hand used what ball they had excellently. In the 36 games charted in 2010 (that are currently being used to provide the averages in the tables) no team had greater than a 77% shot rate – we might not see another team hit 80% again this year.

When you see an outlier like this something exceptional has happened. A lot of people will recognise the outlier as Galway’s direct style of play and quality of foot passing into the forward line. Yes this will be part of the equation however how many times, from here on in, will they meet a defence as compliant as Roscommon’s? Galway have good forwards however if that shot rate drops due to (a) teams screening in front of Conroy or (b) stopping the likes of Bradshaw & O’Donnell attacking will the 56% accuracy hold up?

From play

Team Shots Scores Success Rate Vs Expected
Galway 28 15 54% +2.59
Roscommon 14 6 43% -0.36
avg 21.1 9.3 44.0% 0.00

From deadballs

  Shots Scores Success Rate Vs Expected
G Sice (Gal) 2 2 100% +0.55
M Meehan (Gal) 1 1 100% +0.14
M Hehir (Gal) 1 0 0% -0.55
D Shine (Ros) 5 2 40% -1.50
S Kilbride (Ros) 2 2 100% +0.55
team avgs 7.3 4.8 66.5% 0.00

Again Galway were good from play but maybe not as good as thought – compare their return (+2.22) with that of Donegal’s on the same day (+3.32). Both had low to mid 50s success rate – it was just that Donegal converted more of the difficult scores. Galway can only beat what is put in front of them so the arguement can be made that they didn’t need to take on the difficult shots – if that is the case then a 52% success rate was pretty poor. Galway were good on Sunday; just not excellent.

Players with >= 2 shots from play

  Shots Scores Success Rate Vs Expected
P Conroy (Gal) 9 5 56% +1.06
D Shine (Ros) 4 0 0% -1.80
D Cummins (Gal) 3 0 0% -1.30
G Bradshaw (Gal) 2 2 100% +1.25
J Bergin (Gal) 2 2 100% +1.17
D O’Gara (Ros) 2 2 100% +1.04
G Sice (Gal) 2 2 100% +0.82
S Armstrong (Gal) 2 1 100% +0.11
M Hehir (Gal) 2 1 50% 0.07
G O’Donell (Gal) 2 0 0% -0.83

Conroy showed very well and produced the goods – both success rate and expected returns were above average. He was ably supported by a cast of Bradshaw, Bergin & Sice. Cummins only came on in the 63rd minute – we’ll put that showing down to over exuberance!

As for Roscommon …. we need to talk about Donie

I was on the verge of writing a seperate post altogether on Donie Shine as I’m not sure I’ll do it justice here – I don’t mean to be over critical but it is what it is. Shine had 9 shots in total on the day scoring with two of them. It was a poor outing with a combined (deadball & play) expected return of -3.30. We have however seen this before. Below are Shine’s results for the 4 games charted (3 in 2010 & this game). On 3 of the 4 occassions he returned a negative expected return and in all games his deadball striking has been below average.

Game   Shots Scores Success Rate Vs Expected
Cork V Roscommon from play 4 2 50% +0.06
  deadballs 5 3 60% -0.33
Leitrim Vs Roscommon from play 4 1 25% -0.64
  deadballs 11 7 64% -1.10
Sligo Vs Roscommon from play 3 3 100% +1.63
  deadballs 13 7 54% -0.36
Roscommon Vs Galway from play 4 0 0% -1.80
  deadballs 5 2 40% -1.50

The deadball returns go against the perception of Shine as an excellent free taker. I would argue that he is a taker of excellent frees rather than an excellent free taker – we remember the booming kicks he hits to win games but forget the two 45s he misses in the same game.

The arguement can (will) be made that Shine is the only quality forward Roscommon has. He knows this and thus takes the responsibility on his shoulders to shoot on sight or take the difficult shots.This might also explain his poor return from play. It is an arguement that has some validity however this is where the expected return comes into play – he is below average in converting those shots he does take on. Whether they are easy or hard he’s simply not converting enough.

In doing this I knew I would come across players/teams that did not meet the perceived wisdom. I had hoped to unearth this team/player in a positive manner – one who outperforms their general image. Unfortunately the opposite has occurred