Early Conversion Rates
Whilst uploading the 2016 data into the database I was noodling around in the numbers and produced a simple chart for production on Twitter.

Something was quite obviously happening in the first 10 minutes that saw the cumulative Conversion Rates much lower than the average. There were two initial thoughts
1. a number of “lower level” teams were dragging the average down early in games (either through just poor shooting or an inability to get “quality” shots off against better teams early on when the scoreboard was close)
2. shooting types, and where shots were being taken from, were so different in the frantic opening periods of games that the early Conversion Rates were being skewed
Upon doing some more superficial digging it appears that neither were the case
1. Conversion Rates by teams

The phenomenon (of Conversion Rates being lower early on) was observed in three of the four semi-finalists (NOTE1) whilst all other teams followed the overall trend to a tee. The only outliers – unsurprisingly – were Dublin.
2. Expected Points over time
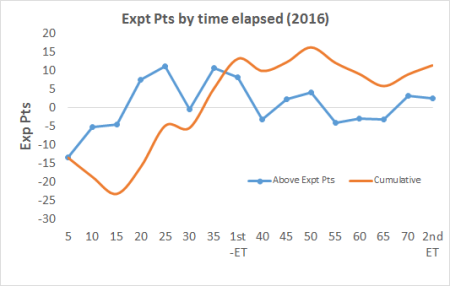
The above is a replica of the Conversion Rate chart but replacing Conversion Rates with Expected Points (Expt Pts). Although the shape of the chart is different than the original the occurrence of poor early returns is still evident. And by using Expt Pts we remove the shooting types as an issue as Expt Pts bakes in the difficulty of a shot (NOTE2). All shots are being converted at a lower rate than expected until around the 30th minute but teams are noticeably struggling in the first 15 minutes.
Conversion Rates by shot type
So the phenomenon is real but cannot be attributed to a specific team type nor to shot selection/execution. It is across the board except for Dublin. Three shots types – free kicks, point & goal attempts from play – make up ~97% of all shots. Is there anything we can determine from investigating these shot types independently to explain this poor shooting in those early exchanges? And is there anything therein that explains how Dublin are managing to avoid this poor shooting early on?
Free kicks

This is probably the most surprising, and hardest to attribute, of all the results. When the very first chart was produced on Twitter I mischievously suggested that whatever all the back-up teams were doing to get teams warmed up they needed to change it. There were some good responses re the intensity of teams, especially in the pressure applied to shots, being higher early on. Or that teams were defensively more conservative early on leaving less space for clear shots. All plausible and probably have a grain of truth. However none applicable to free kicks – and the phenomenon of poor conversion rates early on is noticeable here too.
Now by slicing the volumes into the first 10 minutes of one season’s games we are running in to sample size issues. Specifically for this segment the volume is 47 so this comes with a rather large health warning.
Assuming games are now 80 minutes the first 10 minutes make up 12.5% of the game; the 47 frees in the first 10 minutes make up 13% of all frees. On top of that the two main free takers – D Rock & C O’Connor – make up 21% of all frees in the first 10 minutes whereas they make up 25% of all frees in the database for 2016. So the first 10 minutes, low sample size and all, are representative of the whole year. So what happens in those opening 10 minutes?
|
Shots |
Scores |
Expt Pts |
Conversion % |
v Expt Pts |
| All frees |
47 |
29 |
32.8 |
62% |
-3.8 |
| Rock & O’Connor |
10 |
9 |
7.8 |
90% |
+1.2 |
| Others |
37 |
20 |
25.0 |
54% |
-5.0 |
What the above table shows is that Rock & O’Connor were on point from the get go. Overall for the year they combined for an 86% Conversion Rate and in the first 10 minutes they were 90%.
If the two main protagonists were on point the rest of the free takers must be dragging the averages down from 71% overall to 62% in the first 10 minutes. And as the table shows this is the case. Indeed they were very poor returning a paltry 54% (the 80 minute average for all free takers outside Rock & O’Connor was 66%).
And this somewhat negates the argument for lower Conversion Rates early on being affected by what the opposition’s defence is doing. The opposition can’t really affect free taking. Outside of Rock & O’Connor it looks like free takers were just not ready early on (NOTE3).
Points from play

The Conversion Rate for 2016 was 44.2% and for the five years from 2012 was 45.8%. For the first 10 minutes of 2016 games the conversion rate was 36% and only rose to a cumulative 38% by 20 minutes. Again the Expt Pts was lower in the first 10 minutes (-15.70) as against the remainder of the game (+5.84).
I do track whether a shot was taken under pressure however have only used it anecdotally to date as it is a simple “Y/N” flag and is probably not nuanced enough for any concrete use. Having said that however there is only one person applying the flag so we would expect a certain degree of consistency of application across the ~1,000 shots tracked here.
In the first 10 minutes I charted 53.6% of all point attempts occurring whilst under pressure. The remainder of the time it was 54.2%. Near enough as makes no difference.
So the poor shooting for points from play is real, is not linked to poorer shot types (as evidenced by the Expt Pts return) and from the empirical data we have is not linked to greater pressure applied earlier on in the game. I am completely open to the intensity of the pressure being different early on (NOTE4) but if this was the case you would expect some uptick early on in the percentage of shots marked as taken under some/any pressure in this timeframe. There is none.
There may be other non measurable factors such as nerves (these are amateurs after all) but as of now I can’t come up with anything other than the aforementioned “mischievous” reason that players are just not at peak performance early on. Maybe this is to be expected?
So what of Dublin? We saw that their early conversion Rates outperformed everyone else. This is in part due to the fact that Dean Rock went 5 from 5 on his frees but how was their shooting from play?
|
Shots |
Scores |
Expt Pts |
Conversion % |
v Expt Pts |
| Dublin |
23 |
9 |
10.2 |
39% |
-1.2 |
| Mayo |
28 |
8 |
12.0 |
29% |
-4.0 |
| Tyrone |
19 |
8 |
8.7 |
42% |
-0.7 |
| Donegal |
17 |
4 |
7.4 |
24% |
-3.4 |
| Tipperary |
13 |
5 |
6.8 |
38% |
-1.8 |
| All first 10 |
179 |
65 |
80.7 |
36% |
-15.7 |
Again volumes are low (NOTE5) but Dublin were no great shakes early on. Yes they were above the average for the first 10 minutes but they still underperformed when compared to the whole game average and their Expt Pts – like all the teams above – was below 0.00.
Perhaps the most striking return here is Mayo. From the 10th minute onwards they were exactly in line with Dublin (Mayo 49% on 126 shots with an Expt Pts of +5.59; Dublin 49% on 132 shots with an Expt Pts of +5.54) but for those first 10 minutes they were much poorer.
Another theory for the poor start was not where teams were shooting from but who was shooting – less pressure on returns early on so midfielders/defenders were more inclined to “have a pop”. So I had a look at Mayo’s shot distribution. In the first 10 minutes 64% of their shots came from what I would state are obvious offensive players (A Moran, A O’Shea, J Doherty, A Dillon and the two O’Connor’s). From the 10th minute onwards, and adding E Regan, C O’Shea and A Freeman to this mix who didn’t have a shot in the first 10, these forwards accounted for 60% of point attempts (NOTE6).
It is difficult to attribute offensive/defensive tags to all players in today’s game but if there was a decisive split in who was shooting for teams you would expect it to show up in the team with perhaps the worst split. But it doesn’t.
Goal Attempts

To be honest I am just including the above for consistency and to help explain Dublin’s apparent ability to start faster than others. Whilst I have consistently cautioned against low sample sizes it is an overarching feature of this shot type and can explain a lot of the variance within the five minute groupings above. In total there were 137 goal attempts with just 15 in the first 10 minutes and 36 within the first 20.
Having said all that …. the Conversion Rate for goal attempts was 53% in 2016 and only crawled up to 40% after 15 minutes. With the evidence we have teams again were not converting on goal attempts early on in games.
Dublin? They had six goal attempts in the first 10 minutes scoring 3-00. 50%. And there is their apparent early start in a nutshell. They were 50% on goal attempts, 100% on deadballs (as well as Rock’s aforementioned frees he was 2 from 2 on 45s as well) and slightly below average at 39% on point attempts – giving them the aggregate of ~52% early doors.
Overview
This is based on one year’s data (NOTE7) but poor early conversion rates were definitley a “thing” that year
There is no evidence that shot selection (through Expt Pts), opposition pressure (through the simple “Y/N” flag) nor type of shooter (using Mayo as an example) is any different in the first 10 minutes to the rest of the game
It is also evident in early free taking, except for the very best in Rock & O’Connor who were on point from the very start, which somewhat nullifies the theory that it is something the opposition is doing to affect the shooting.
There are undoubtedly other factors at play. Some can be measured; first shot in the game, effect of new surroundings, debutants vs more experienced players, intensity of pressure. Some we may never be able to measure – nerves, mentality of players early on versus later in the game, etc.
But as of now, and taking all of the above into account, I cannot escape the initial gut reaction that players are just not ready – for whatever reason – early on
NOTE1 – we need to be careful with any segmentation. There are only 1,640 shots in total being reviewed here with 249 in the first 10 minutes. Segment that further by team and you get some ridiculous numbers; Kerry just have the 7 shots across two 2016 games; similarly Tipperary only have 16 shots in the same timeframe. You can’t make any judgements on those numbers. In truth I would not normally use a chart with such low volumes but I include it here as it was the chart that sparked me into looking deeper into the issue.
NOTE2 – for more on why this is so please see here
NOTE3 – I had a further look at the non Rock & O’Connor frees to see if any one player was having an effect. There was none really. 34 of the 37 were a player’s first attempt in the game which makes sense as it is uncommon for a team to have two shots at goal from a free in the opening 10 minutes.
This leads to a further corroboration that could be investigated – across the year’s how does a player’s very first free kick equate to the rest of their results?
NOTE4 – I started to grade pressure on a sliding 0 – 3 scale for the two All Ireland finals. It feels a lot more robust as having to apply a grade makes you stop and think. It will be very instructive from here on in but as of now I’m not inclined to go back over the entire season to retrospectively apply the grade(s)!
NOTE5 – This table lists all the teams with >10 shots from play in the first ten minutes. Again we are running into sample size issues.
NOTE6 – the non offensive players with a shot in the first 10 minutes were B Moran, D Vaughan, K McLoughlin, L Keegan, P Durcan & T Parsons. Other defensive players with shots post the 10th minute were C Boyle, K Higgins, S O’Shea, S Coen, B Harrison & K Keane
Note that whilst some of these could be moved into the “offensive” pot their individual shot volumes are such that it wouldn’t make a material difference to the overall point.
NOTE7 – why one year? Because for some unknown reason I didn’t track the time (outside of 1st half/2nd half) for previous years. Hell of an oversight in retrospect! The only reason I started in 2016 was I was so bored of looking at kickouts so decided to look at the rest of the game. I have one or two other pieces I newly gathered in 2016 so hoping to get another long form piece out on those


